

How does sharewise work?
Discuss
Discuss and share predictions for your favorite stocks in the forum. Let your opinion be heard
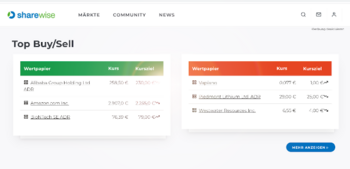
Show moreTop Buy/Sell (This Month)
| Security | Price | Target price |
|---|---|---|
| Microsoft Corp. | €409.30 | €500.46 |
| Amazon.com Inc. | €239.60 | €257.76 |
| Alphabet Inc. C | €315.00 | €367.50 |
| Security | Price | Target price |
|---|---|---|
| Western Union Co. | €5.63 | - |
| Clorox Co. | €83.66 | €86.92 |
| Principal Financial Group | ? | €70.18 |
New Top predictions since last week
| Prediction | User | Perf. (%) |
|---|---|---|
| B Replimune Group Inc | Kryptonit | 62.26% |
| B Axt Inc. | AlexanderDanielSchneider | 56.94% |
| B Sandisk Corp. | AlexanderDanielSchneider | 28.48% |
| Prediction | User | Perf. (%) |
|---|---|---|
| S Entera Bio | Kryptonit | -23.60% |
| S Pantaflix AG | Vassago1 | -22.98% |
| S Apple Inc. | fenjal | -10.56% |

sharewise BeanCounterBot AI-generated
The analysis provided is generated by an artificial intelligence system and is provided for informational purposes only. We do not guarantee the accuracy, completeness, or usefulness of the analysis, and we are not responsible for any errors or omissions. Use of the analysis is at your own risk.Financial analysis of Cintas
Cintas Corp (CTAS.US) – FY2026 Annual Report
Cintas appears to have extended its track record of consistent expansion, with revenue surpassing the $11 billion mark for the first time. The company’s overall trajectory, marked by steady revenue and profit growth over the past five years, seems intact, and return on equity approaching 39% could indicate that management continues to deploy capital effectively within its niche service model.
The top-line growth of nearly 9% year-over-year was accompanied by a continuation of the gradual margin expansion that has characterized recent periods. Gross margin edged above 50%, while operating margin reached 23.1%, both representing incremental improvements. Notably, the First Aid and Safety Services segment appears to be outpacing the core Uniform Rental business in growth rate, suggesting it may be becoming a more meaningful contributor to the overall revenue mix. The presence of modest transaction expenses related to UniFirst Corporation hints at ongoing consolidation activity in this fragmented market, which could have implications for future cost structures and integration risk.
Many tell you which stocks to buy.
We measure how often they are right!


Portfolios of our members
D-wave Quantum Inc.

When it comes to stocks, what is important for you?
Find stocks based on your criteria with our sharewise stock finder. All results are based on thousands of votes by our community
Pros and Cons of these stocks (New Predictions)
Ocean Power Technologies Inc.
WKN: A2PFQU / Symbol: OPTT / Name: OPT / Stock / Electrical Utilities & IPPs / Micro Cap /
Pros
Cons
Symrise AG
WKN: SYM999 / Name: Symrise / Stock / Chemicals / Large Cap /
Pros
Cons
Try sharewise+ and get hundreds more matching stocks
Sign up for free!Tops & Flops S&P 500
| Security | Price | Change(%) (%) |
|---|---|---|
| Newell Rubbermaid | €4.84 | 9.300% |
| Bristol-Myers Squibb | €60.24 | 6.320% |
| Carnival Paired Ctf | €23.45 | 5.850% |
| Discovery Communications C | €22.42 | 5.110% |
| Mohawk Industries Inc. | ? | 4.630% |
| Security | Price | Change(%) (%) |
|---|---|---|
| UDR Inc. | €33.23 | -4.150% |
| Advance Auto Parts Inc. | €48.72 | -3.960% |
| Sandisk Corp. | €1,020.0 | -3.770% |
| Kansas City Southern | €256.50 | -2.950% |
| Micron Technology Inc. | €694.40 | -2.810% |
Courses
sharewise Introduction

Get started on the stock market in these easy steps
Things you will learn:
- What is a stock
- What is a fund
- What is an ETF
- How to open a depot
- How to manage a depot that will regularly beat managed funds
- Why you mostly need patience to succeed on the stock market
Predictions
Commerzbank AG
09:54
03.08.27
12:17

Ocean Power Technologies Inc.
09:38
03.11.27
12:10
Lumentum Holdings Inc
09:37
03.08.27
12:12
Top News

Exco Technologies Q3 Earnings Call Highlights
Key Points
- Interested in Exco Technologies Limited? Here are five stocks we like better.
- Exco Technologies posted record Q3 fiscal 2026 sales of CAD 165.4 million, up 7% year over year, while

TMX Group Q2 Earnings Call Highlights
Key Points
- Interested in TMX Group Limited? Here are five stocks we like better.
- TMX Group delivered strong Q2 results: Revenue rose 16% to C$487.5 million, adjusted diluted EPS increased 19%

Whitecap Resources Q2 Earnings Call Highlights
Key Points
- Interested in Whitecap Resources Inc.? Here are five stocks we like better.
- Record financial performance: Whitecap reported C$1.4 billion in second-quarter funds flow and C$925

Vista Gold Q2 Earnings Call Highlights
Key Points
- Interested in Vista Gold Corp.? Here are five stocks we like better.
- Mt Todd development advanced: Vista Gold continued work on permitting, technical optimization and execution
Toromont Industries Q2 Earnings Call Highlights
Key Points
- Interested in Toromont Industries Ltd.? Here are five stocks we like better.
- Toromont’s second-quarter revenue rose 16% and operating income increased 41%, driven primarily by the


Best PIMCO Mutual Funds to Buy Now: 3 Top-Ranked Picks
Founded in 1971, Pacific Investment Management Company, LLC or PIMCO, is an internationally acclaimed investment management firm. Headquartered in Newport Beach, CA, the company provides a wide


New Strong Buy Stocks for August 3rd
Here are five stocks added to the Zacks Rank #1 (Strong Buy) List today:
FormFactor, Inc. FORM: This provider of semiconductor testing solutions, including probe cards, systems, and cryogenic

New Strong Sell Stocks for August 3rd
Here are three stocks added to the Zacks Rank #5 (Strong Sell) List today:
Adecco Group AG AHEXY is a human resources services company. The Zacks Consensus Estimate for its current year earnings has

Bull of the Day: Ciena (CIEN)
Ciena Company Overview
Zacks Rank #1 (Strong Buy) stock Ciena Corporation (CIEN) is a leading provider of optical networking equipment, software, and services. Ciena is best known for its optical
News

Bear of the Day: Boston Beer (SAM)
Boston Beer Company Overview
Zacks Rank #5 (Strong Sell) Boston Beer Co. Inc (SAM) is one of the largest alcohol companies in the United States. The Boston, MA-based company produces beer, malt

Best Growth Stocks to Buy for August 3rd
Here are three stocks with buy ranks and strong growth characteristics for investors to consider today, August 3:
Schneider National, Inc. SNDR: This provider of truckload, intermodal, and logistics

Best Value Stocks to Buy for August 3rd
Here is a stock with buy rank and strong value characteristics for investors to consider today, August 3:
Huron Consulting Group Inc. HURN: This provider of healthcare, education, and commercial

Best Income Stocks to Buy for August 3rd
Here are two stocks with buy rank and strong income characteristics for investors to consider today, August 3:
Schneider National, Inc. SNDR: This provider of truckload, intermodal, and logistics

Spin Master Q2 Earnings Call Highlights
Key Points
- Interested in Spin Master Corp.? Here are five stocks we like better.
- Q2 performance exceeded expectations: Consolidated revenue rose 9%, while toy revenue increased 12%, helped by
Tourmaline Oil Q2 Earnings Call Highlights
Key Points
- Interested in Tourmaline Oil Corp.? Here are five stocks we like better.
- Tourmaline reported C$786 million in second-quarter cash flow and C$192 million in free cash flow, with
Timbercreek Financial Q2 Earnings Call Highlights
Key Points
- Interested in Timbercreek Financial Corp.? Here are five stocks we like better.
- Stable distributable income: Timbercreek Financial reported Q2 distributable income of C$14.6 million

Trican Well Service Q2 Earnings Call Highlights
Key Points
- Interested in Trican Well Service Ltd.? Here are five stocks we like better.
- Second-quarter profitability deteriorated: Revenue was broadly flat at C$214.6 million, but adjusted

Supremex Q2 Earnings Call Highlights
Key Points
- Interested in Supremex Inc.? Here are five stocks we like better.
- Strong second-quarter results: Revenue rose 8.5% year over year to C$71.6 million, while adjusted EBITDA increased
Contest

Still running

Leeway
Die Analyse-Plattform Leeway untersucht mit KI-unterstützten Algorithmen aussagekräftige Zusammenhänge am Aktienmarkt. Anhand von vielen Millionen Datenpunkten finden die Algorithmen die Kennzahlen und Bewegungen, die nachweisbare Auswirkungen haben und Vorteile schaffen.
Kostenlos ausprobieren
Heibel Ticker
sharewise sagt: Stephan Heibel ist ein langähriger Unterstützer und Autor der Wunschanalyse. Er betreibt meiner Meinung nach einen der besten Börsenbriefe. Es gibt eine kostenlose und eine Premium Variante.
Kostenlos ausprobierensharewise
Du findest das sharewise Projekt spannend und möchtest es unterstützen?
Mit einer
sharewise+-Mitgliedschaft
unterstützt du uns finanziell und bekommst zusätzliche Funktionalitäten freigeschalten.
sharewise
Du findest das sharewise Projekt spannend und möchtest es unterstützen?
Mit einer
sharewise+-Mitgliedschaft
unterstützt du uns finanziell und bekommst zusätzliche Funktionalitäten freigeschalten.