

The Data Supports the FED


The central banks continue to be in the driver’s seat and, like all good drivers, they are cognizant of what has occurred in the rear-view mirror and what is likely to happen far ahead of their present position, while looking through what is immediately in front of them. The latter, has inflation that is below the targeted 2%, but the FED is looking through this and out into the future where the present tight labor market is expected to increase inflation. The FED can afford to wait until later in the year to raise rates again, but it cannot afford to get behind the curve in normalizing rates.
On Tuesday, the European Central Bank President, Mario Draghi, provided an upbeat assessment of eurozone inflation and growth trend which caused a steepening of the yield curve (German Bunds yield nearly doubled). But by midweek, the ECB came out saying that Mr. Draghi’s Tuesday remarks were misinterpreted as hawkish while they were meant to strike a balance. In spite of this, longer-dated Treasuries and German bunds held their ground.
The economic data that came out this week, while not particularly inflationary, does support a growing economy:
Personal income increased 0.4% in May after a downwardly revised 0.3% increase (from 0.4%) for April. Personal spending was up 0.1%, as expected, following an unrevised 0.4% increase in April. The core PCE Price Index, which excludes food and energy, increased 0.1%, as expected.
The Chicago Business Barometer, otherwise known as the Chicago Purchasing Managers Index, jumped to 65.7 in June from 59.4 in May.
the New Orders Index served as the springboard for the June jump, rising from 61.4 to 71.9 and signaling solid manufacturing demand in the Chicago Fed region.
The University of Michigan’s Index of Consumer Sentiment was revised from the preliminary reading of 94.5 for June to 95.1 as the final reading.
The fed funds futures market still points to the December FOMC meeting as the most likely time for the next rate-hike announcement with an implied probability of 54.4%, up from last week’s 51.3%. This, of course, can change in an instant if future data continue to show growth.

Global economic data, also continues to show economic growth that will support the beginning of rate normalization:
China’s June Manufacturing PMI 51.7 (last 51.2) and June Non-Manufacturing PMI 54.9 (last 54.5)
Eurozone June CPI +1.3% year-over-year (expected 1.2%; last 1.4%) and Core CPI +1.1% year-over-year (consensus 1.0%; last 0.9%)
Germany’s Unemployment Change 7,000 (expected -10,000; last -7,000) and Unemployment Rate held at 5.7%, as expected. May Retail Sales +0.5% month-over-month (expected 0.3%; last -0.2%); +4.8% year-over-year (consensus 2.5%; last -0.4%)
UK’s Q1 GDP +0.2% quarter-over-quarter, as expected (last 0.2%); +2.0% year-over-year, as expected (last 2.0%). Q1 Current Account deficit GBP16.90 billion (expected deficit of GBP17.30 billion; last deficit of GBP12.10 billion). Q1 Business Investment +0.7% year-over-year (last -0.9%)
France’s May PPI -0.6% month-over-month (last -0.4%) and June CPI 0.0% month-over-month, as expected (last 0.0%). May Consumer Spending +1.0% month-over-month (expected 0.5%; last 0.4%)
All-in-all, the various world economies are not deflating, even if they fall short of the magic 2% inflation rate, which opens the door for Central Banks to start normalizing rates.
Equities
The AAII investor sentiment index shows a shift in sentiment from both the bullish and bearish sides, to the neutral middle.
Bullish: 29.7%, down 2.9 percentage points.
Neutral: 43.4%, up 5.0 percentage points.
Bearish: 26.9%, down 2.1 percentage points.
Bullish and bearish sentiment are both below their historical averages of 38.5%, and 30.5% respectively, and neutral sentiment is well above its historical average of 31%. This means that the total non-bullish sentiment is at 70.3%.
{This section is for paid subscribers only. Join us at www.angtraders.com}
The bear-to-bull fund asset allocation ratio continues to sink lower and the moving average shows no sign of reversing, which indicates the bull continues to defy the skeptics and remains firmly in place (chart below).

The NAAIM index continues to bullishly rise (chart below).

{This section is for paid subscribers only. Join us at www.angtraders.com}
The European market may be going through a correction, but we still are of the view that it will continue to strengthen in the medium term (chart below).

Oil
{This section is for paid subscribers only. Join us at www.angtraders.com}
Gold
Despite a three-day decline in the dollar and potentially dangerous geo-politics (Syria, Qatar, and N. Korea), gold traded sideways, which goes to show just how weak gold is at the moment.
{This section is for paid subscribers only. Join us at www.angtraders.com}
The dollar is not trading with its usual negative correlation to gold, but the same cannot be said about the USD/JPY ratio. The ratio is once again trading up above its 38% Fibonacci retrace level and gold has maintained the negative correlation by trading down in response (chart below).

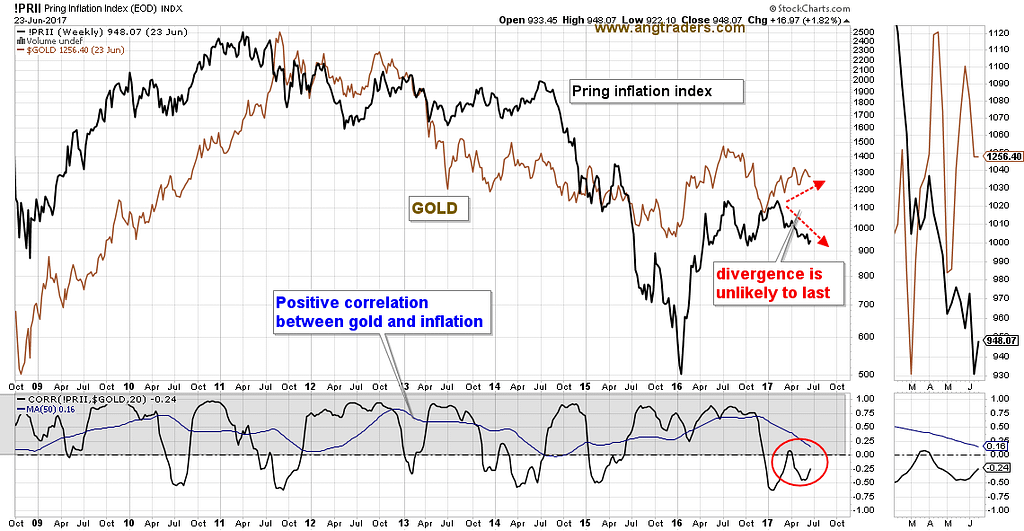
Gold has traded in a reciprocal manner to inflation for much of 2017, but its reversion to the mean (positive correlation) may have already started (chart below).
{This section is for paid subscribers only. Join us at www.angtraders.com}
We wish our subscribers a profitable week ahead.
Regards,
ANG Traders
www.angtraders.com
Source: Nicholas Gomez