

Gold Under Technical Pressure


Long-term, gold is working on a large bearish head-and-shoulders pattern (purple curves on the chart below), and a smaller head-and-shoulders pattern within the right-shoulder (red curves on chart below).
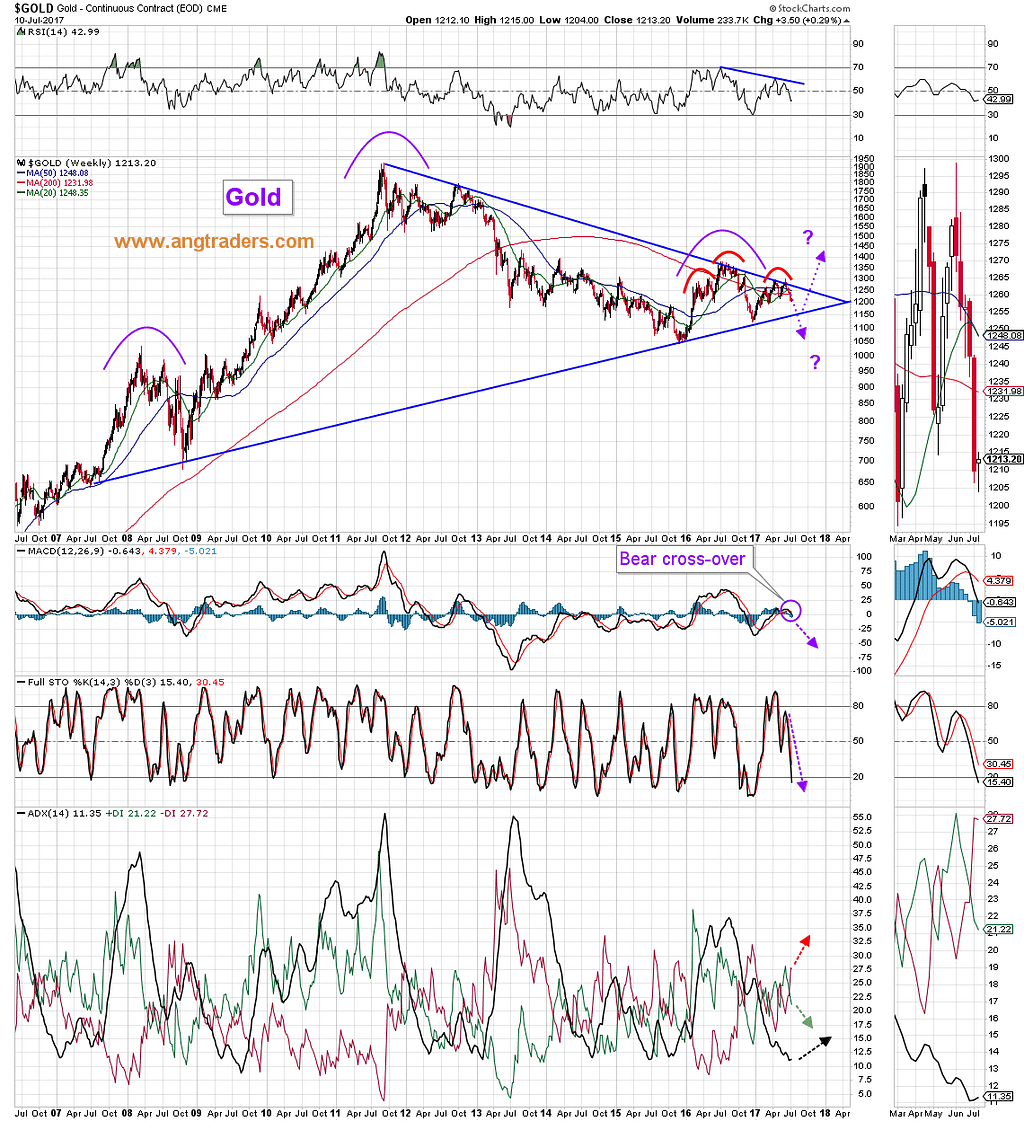
The MACD has crossed-over into a bearish slope, and the stochastics and RSI are heading south also. Combine this with the fact that the price is being squeezed into the corner of a triangle, and you get a picture of gold under long-term pressure .
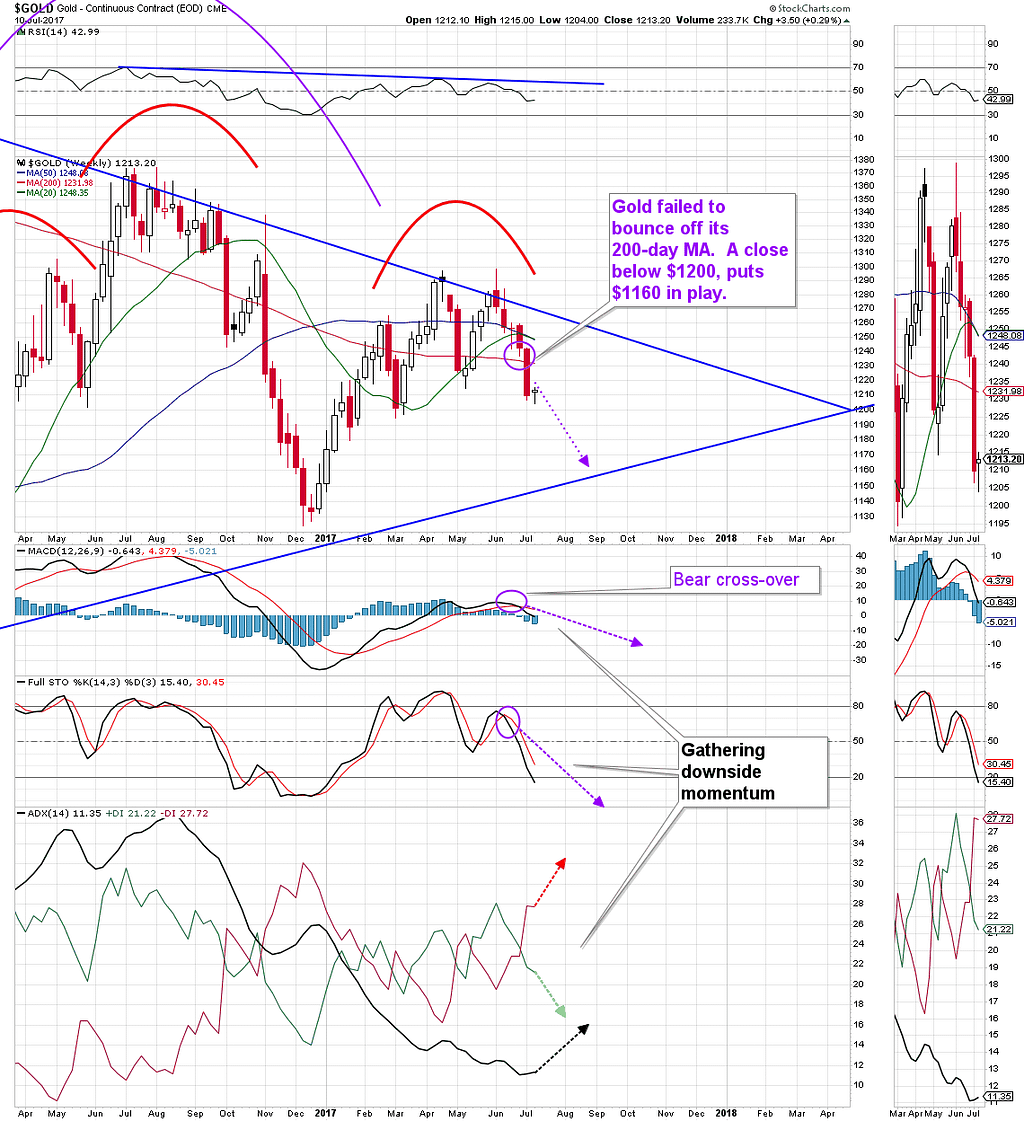
What about shorter term? Have a look at the daily chart of gold below. Notice that the 20-day MA has turned down to remain below the 50-day MA, and that both averages have negative slopes. Notice also, that gold fell definitively below its 200-day MA last Friday, and that the MACD, stochastics, and the ADX indicators are all gathering downside momentum.
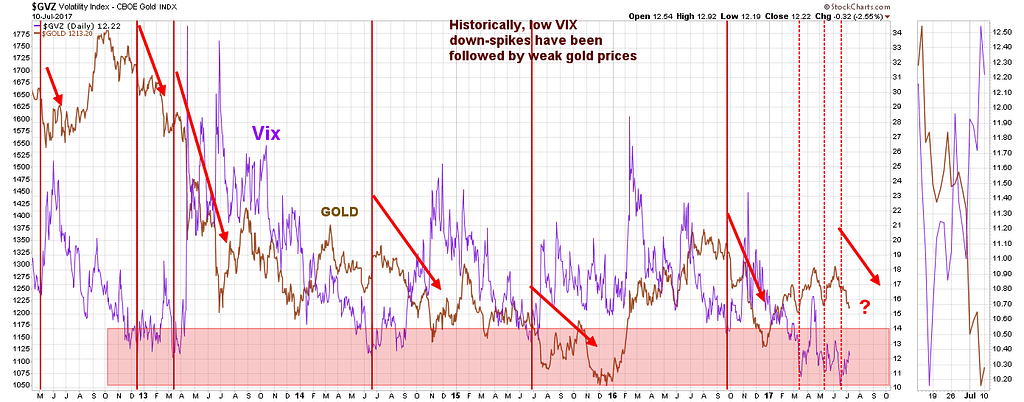
The chart below, shows the gold volatility index superimposed on the price of gold. The red vertical lines indicate down-spikes in the gold VIX, and the red arrows show the movement of the gold price following the VIX down-spikes. Historically, gold has dropped following a low in the gold VIX.
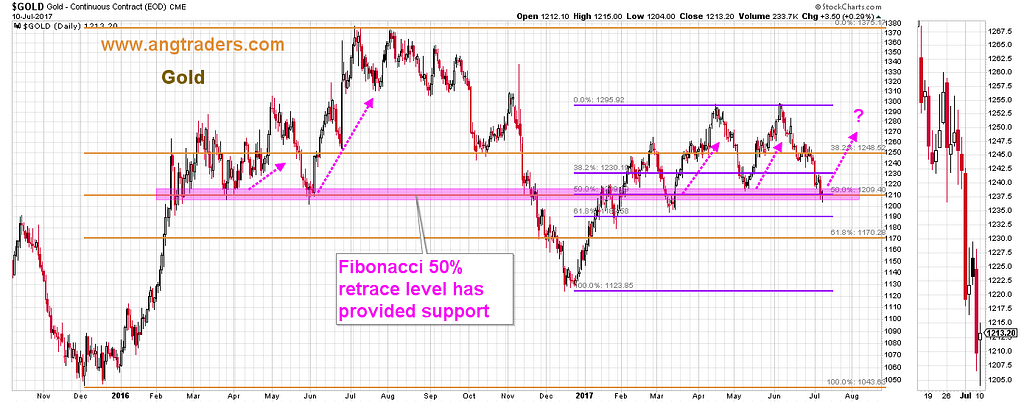
Most of our discussion, so far, has been about the weakness in gold, but there is one technical aspect that may be bullish for gold.
The chart below, is marked with a pink horizontal rectangle which highlights the Fibonacci 50% retrace level of both the 2016 January-to-August rally (yellow), and the 2017 January-to-June rally (purple). This double Fibonacci retrace level stands at $1209 and has provided support to gold on four previous occasions (pink arrows on chart). Gold may rally again from this level, but if it breaks below this important support, then the gold-price will be in significant trouble.
In conclusion, most technical indicators point to further pressure on gold.
ANG Traders
Join us at www.angtraders.com and replicate our trades and profits.
Source: Nicholas Gomez