

Still Correct


Last week, we argued that the FED had acted correctly by raising rates even though inflation is below the arbitrary 2% rate. We pointed out that the FED is focused on the robust labor situation (4.3% unemployment), and high-lighted the elevated ‘quit rate’ in the construction industry which we see as a forward sign that wages and, therefore, inflation will be rising in the future. We considered the lower construction permits and starts as a function of a tight labor market, not as a true ‘slow-down’ in the economy.
Our view is supported by the positive existing home sales report (Wednesday), which was up month-over-month, and the rising house prices which are the result of a constrained inventory.

On Friday, the new homes sales report came out and it too showed an improvement. The prior month was revised upward, and this month’s report came in 2.9% above that.

This shows demand continues in place and that a slowdown is not evident at the moment. The FED raising rates still looks like the right thing to do.
Equities
It was a rather uneventful week for equities; almost devoid of data, and equities finished nearly flat.
{This section is for paid subscribers only. Join us at www.angtraders.com and get the full service}
The Rydex bear/bull fund asset allocation ratio is a non-survey measure of where funds are investing their assets. The lower the ratio, the more bullish the sentiment, and low ratios correlate with market tops. Even though the ratio is at near-historic lows, the moving average continues to track lower like it did during the tech rally of 1999–2000. A major market top could still be months away.

The 8-week moving average of the put-to-call ratio moved sideways this week, indicating indecision by investors.

{This section is for paid subscribers only. Join us at www.angtraders.com and get the full service}
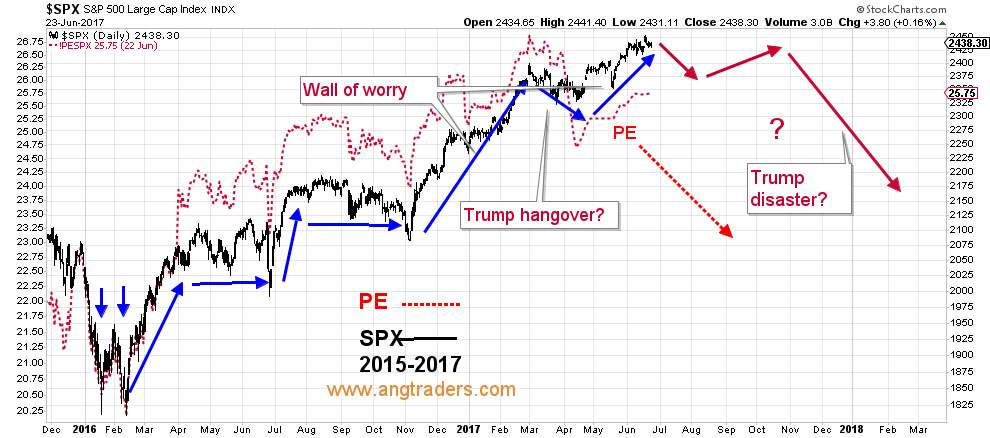
The trading pattern the market has experienced since the start of 2016 continues to look very much like 1999–2000. This similarity adds to our expectation of a temporary market pull-back.

{This section is for paid subscribers only. Join us at www.angtraders.com and get the full service}
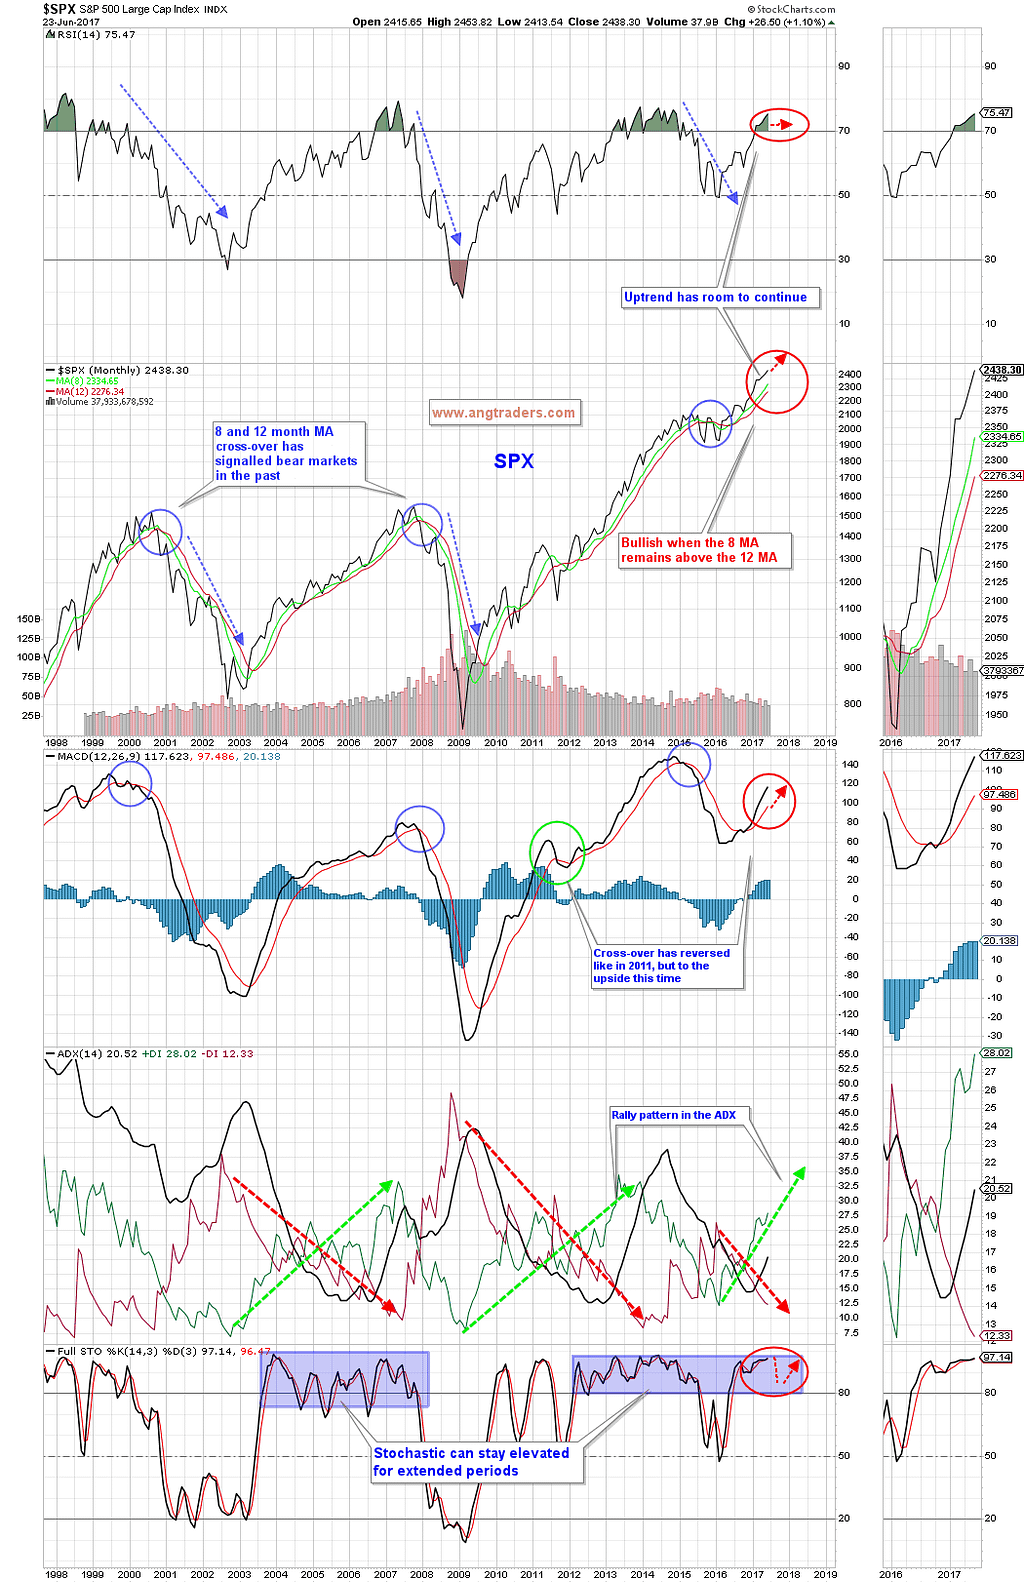
In any case, it seems that we continue to be in a longer-term bull market that is devoid of any signs of weakness (chart below).
{This section is for paid subscribers only. Join us at www.angtraders.com and get the full service}
Gold
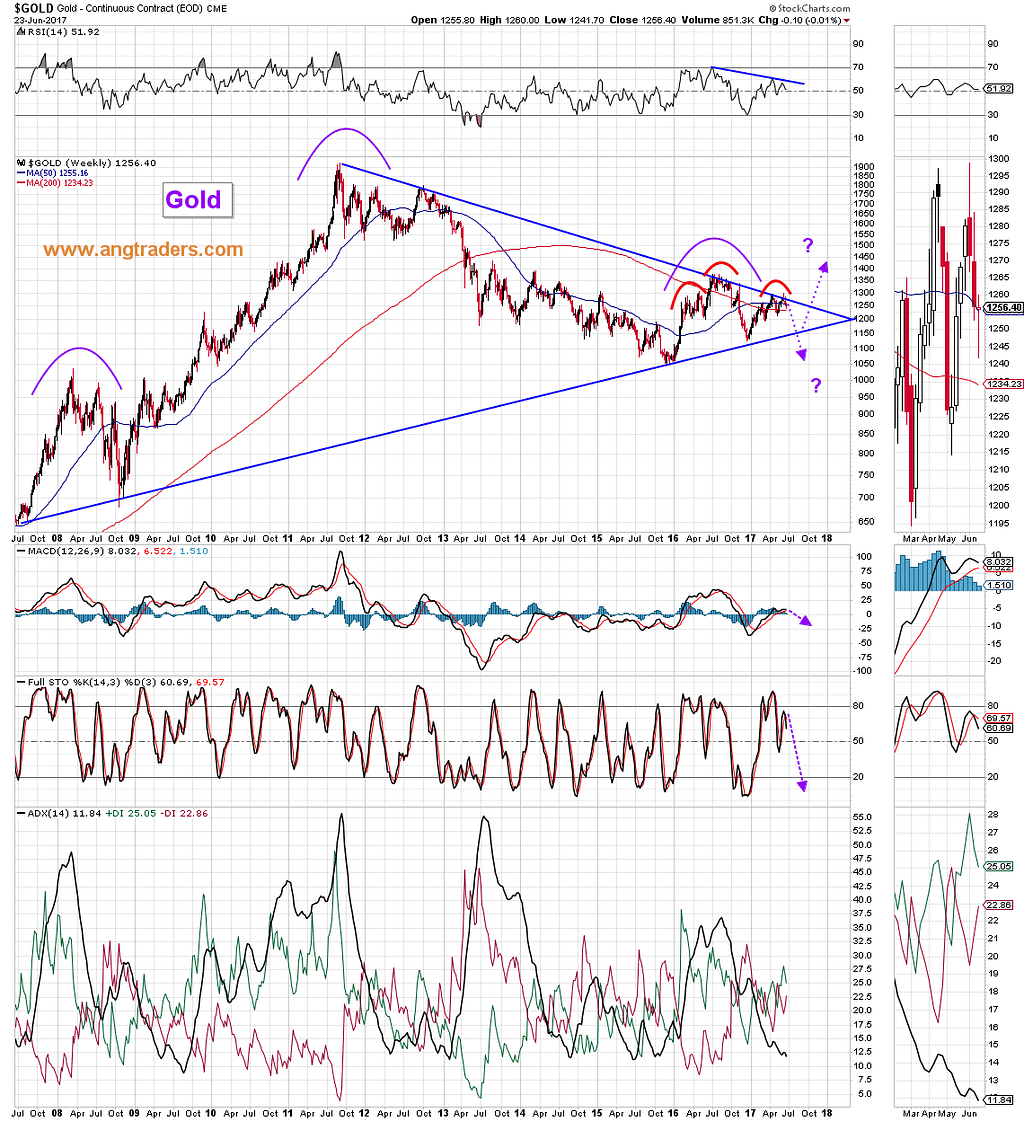
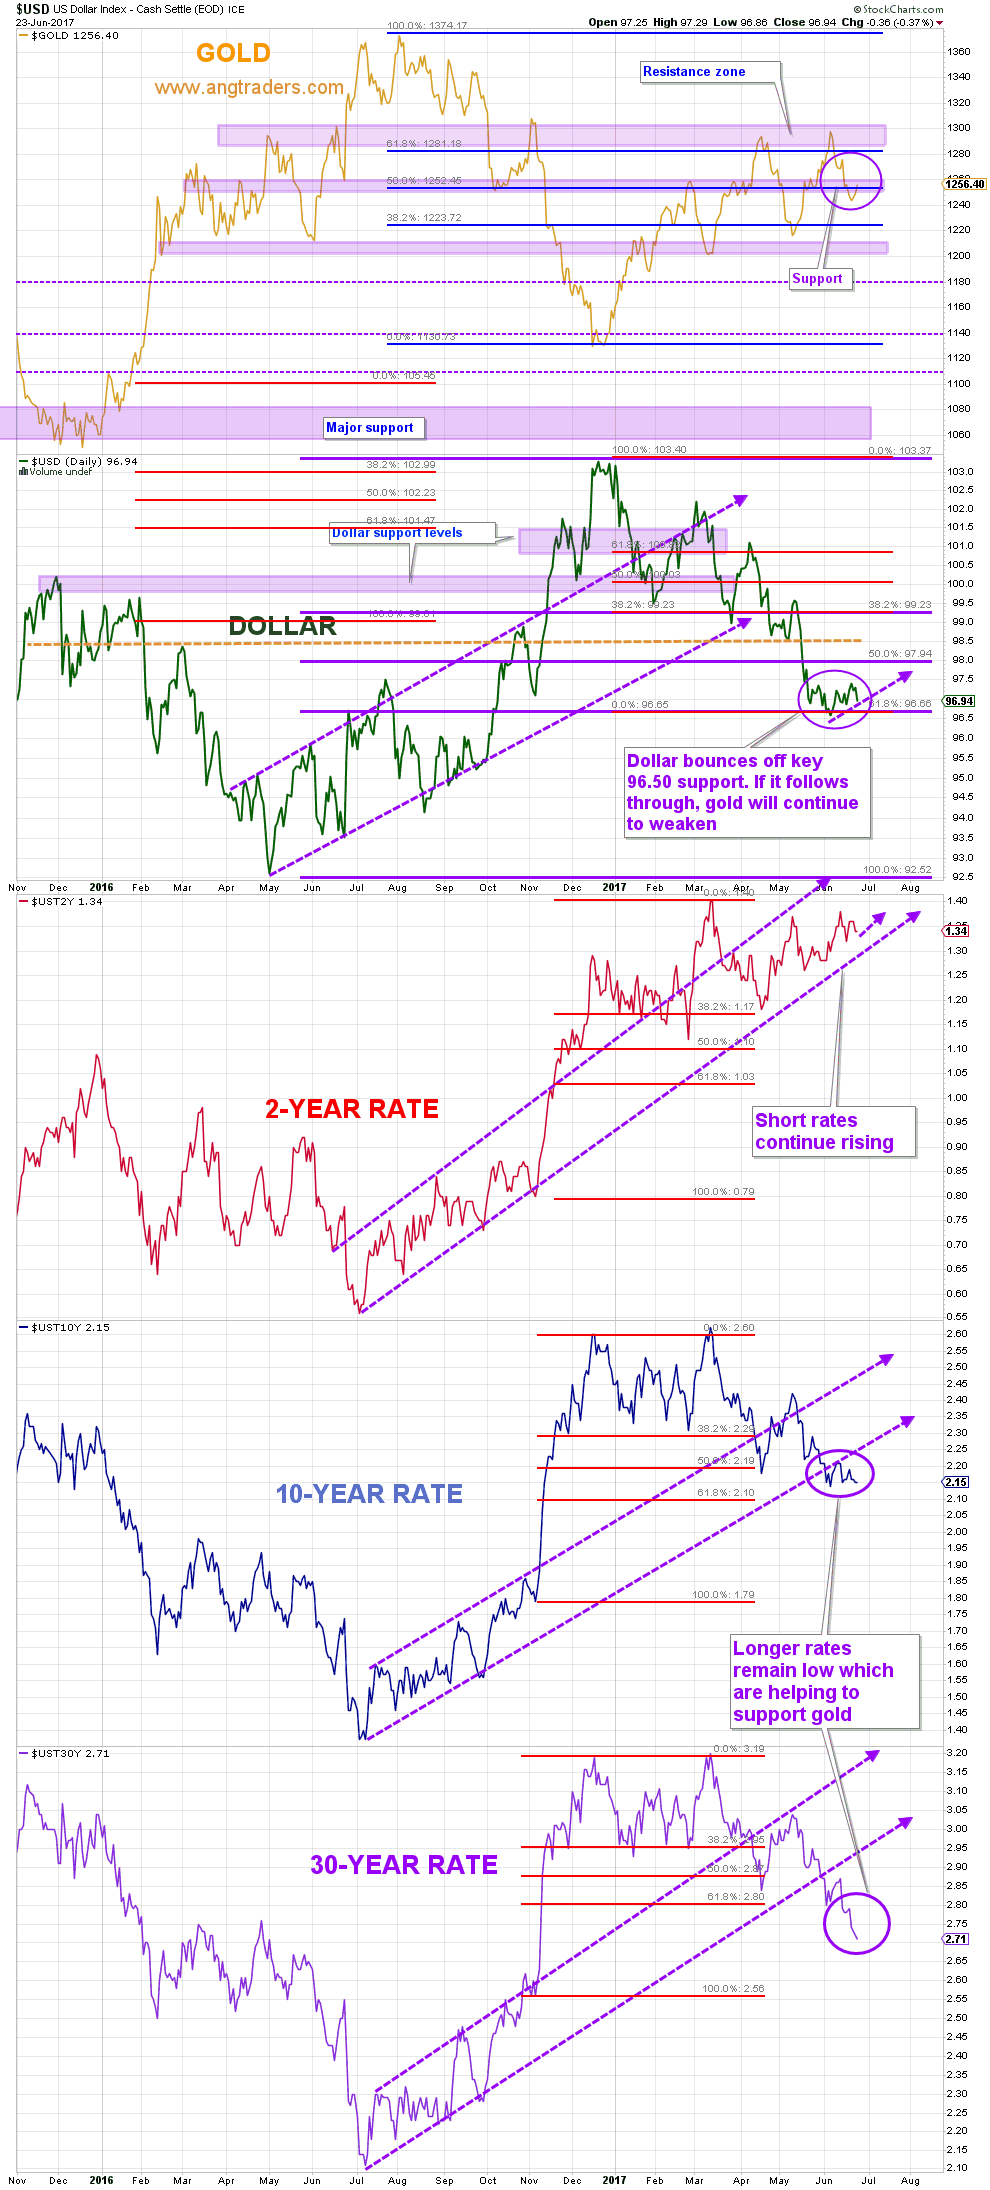
Long-term, gold continues in a bear bias despite showing some strength on Friday (chart below).
{This section is for paid subscribers only. Join us at www.angtraders.com and get the full service}
The dollar has held above the important 96.50 level, but it needs to follow-through to the upside for gold to drop. The 2-year Treasury rate remains positive, but the 10-year and especially the 30-year rate are depressed which is supportive of gold. Gold is unlikely to continue dropping until long rates start moving up.
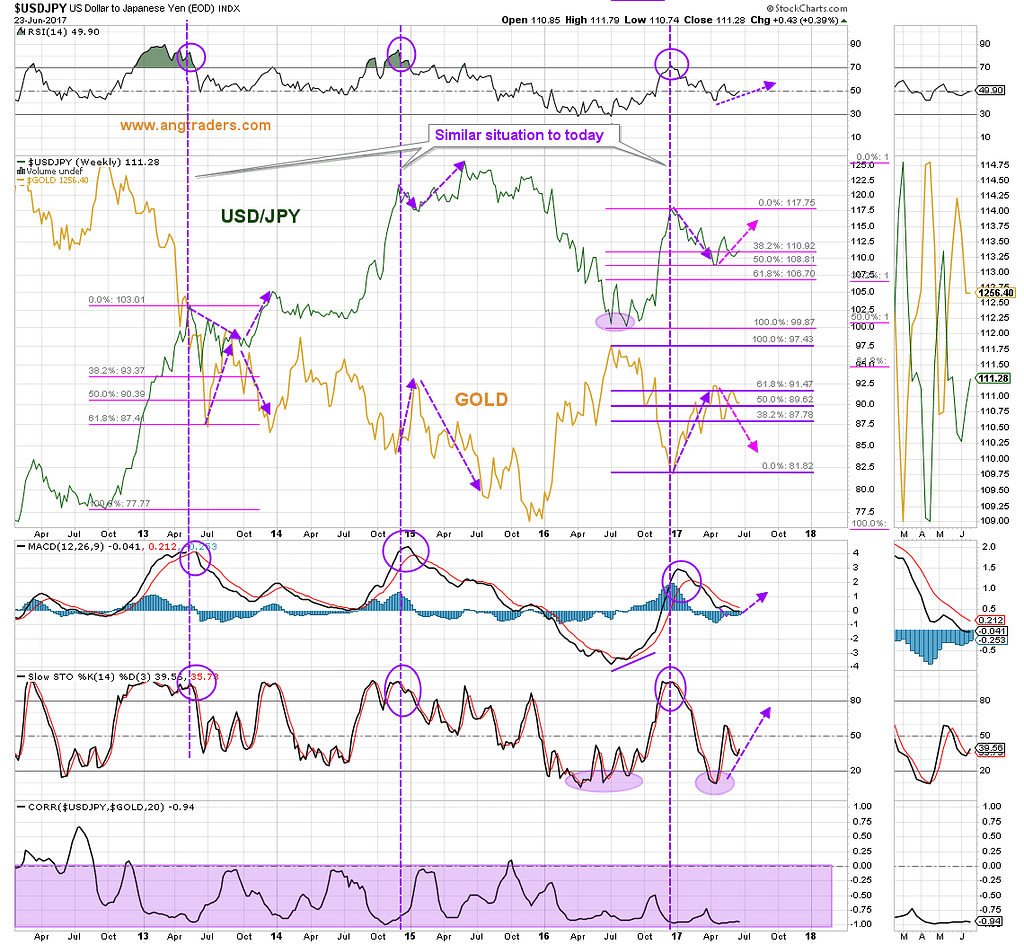
The USD/JPY FOREX ratio is still within its uptrend (chart below).
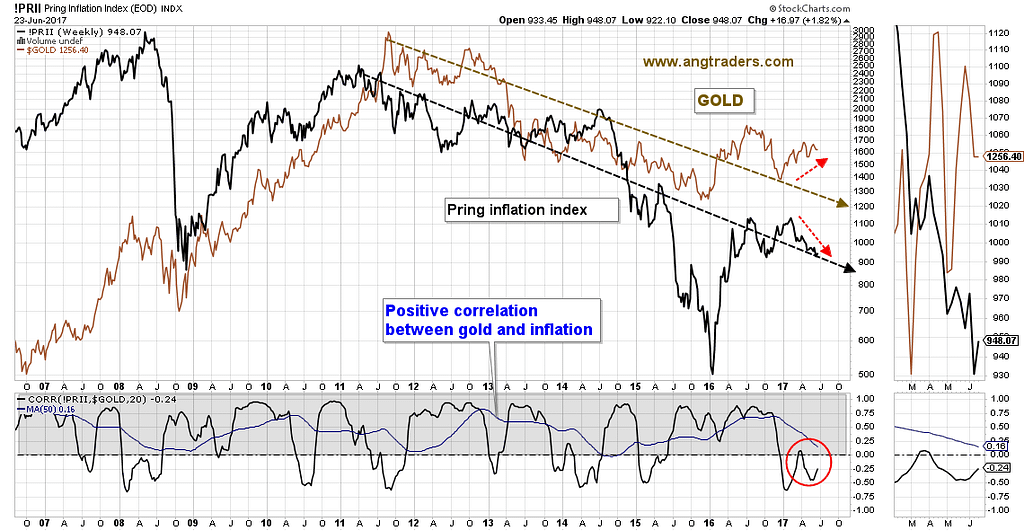
On-average, inflation and gold have a positive correlation. Since January, however, the reverse has been true. A reversion to the mean should push the gold price down since the FED looks determined to keep inflation down (chart below).
{This section is for paid subscribers only. Join us at www.angtraders.com and get the full service}
We wish our subscribers a profitable week ahead and ask that email be monitored for Trade Alerts.
ANG Traders
Join us at www.angtraders.com and replicate our trades and profits.
Source: Nicholas Gomez