

Logica Capital April 2023 Commentary


Logica Capital commentary for the month ended April 30, 2023.
Summary
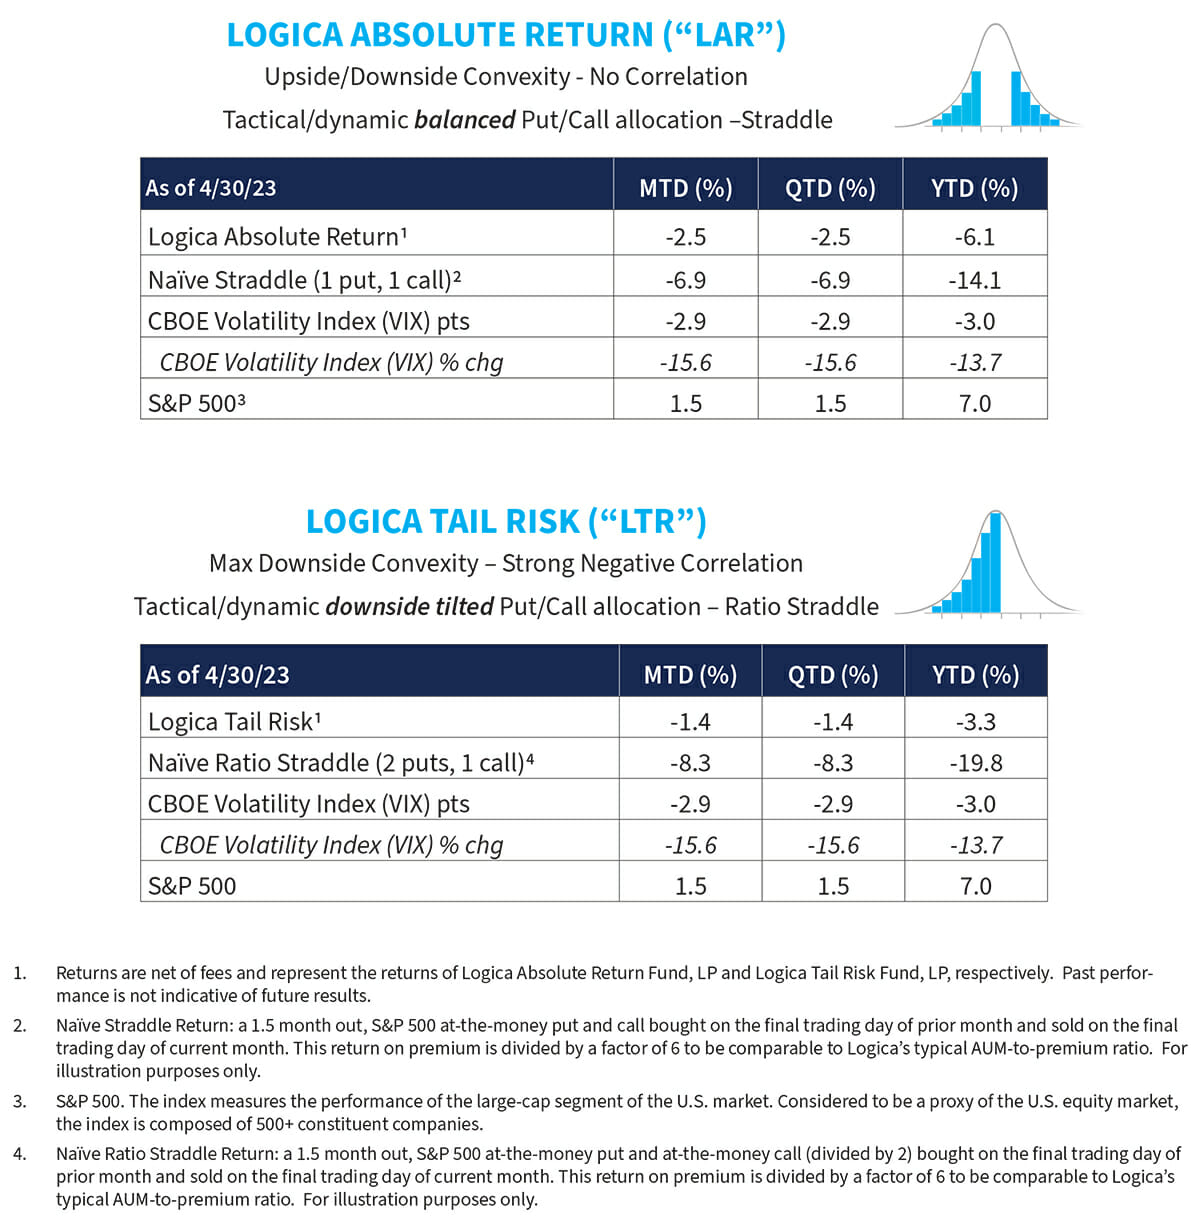
Relative to the 1.5% gain for the S 500, implied volatility got disproportionately whacked in April, resulting in a fierce headwind for Logica’s strategies (as well as the naïve straddle benchmarks).
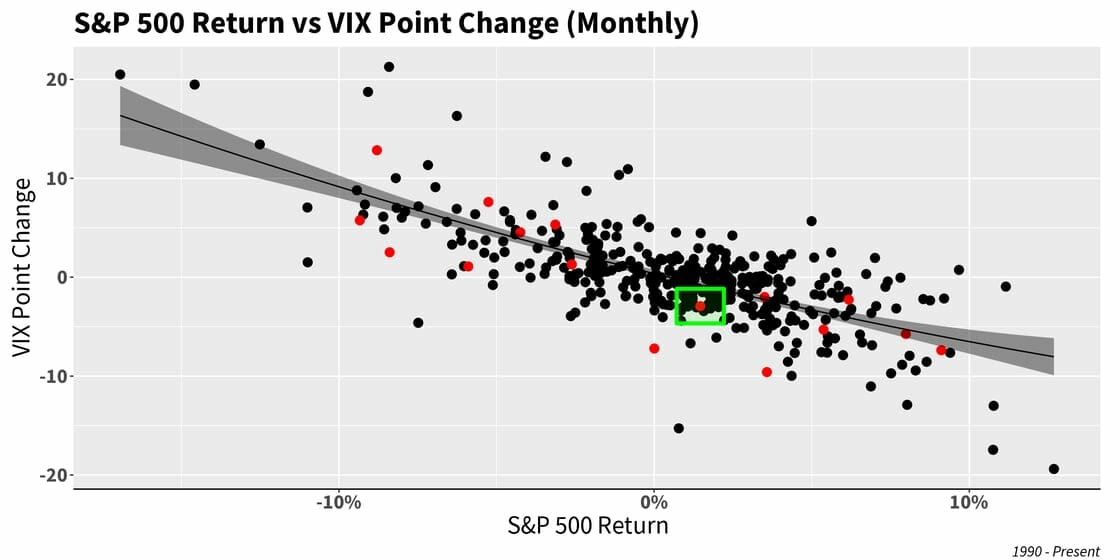
To give some perspective, the “rule of thumb” historical norm is roughly 1:1: that is, a 1% S gain comes with a 1-point VIX decline. In April, this relationship showed a 1:2 ratio, or almost double the expected decline in implied volatility.
Commentary Portfolio Return Attribution
The Portfolio: Looking Inside
“Comprehension is a far more rational choice than assumption.”
– Temi O’Sola
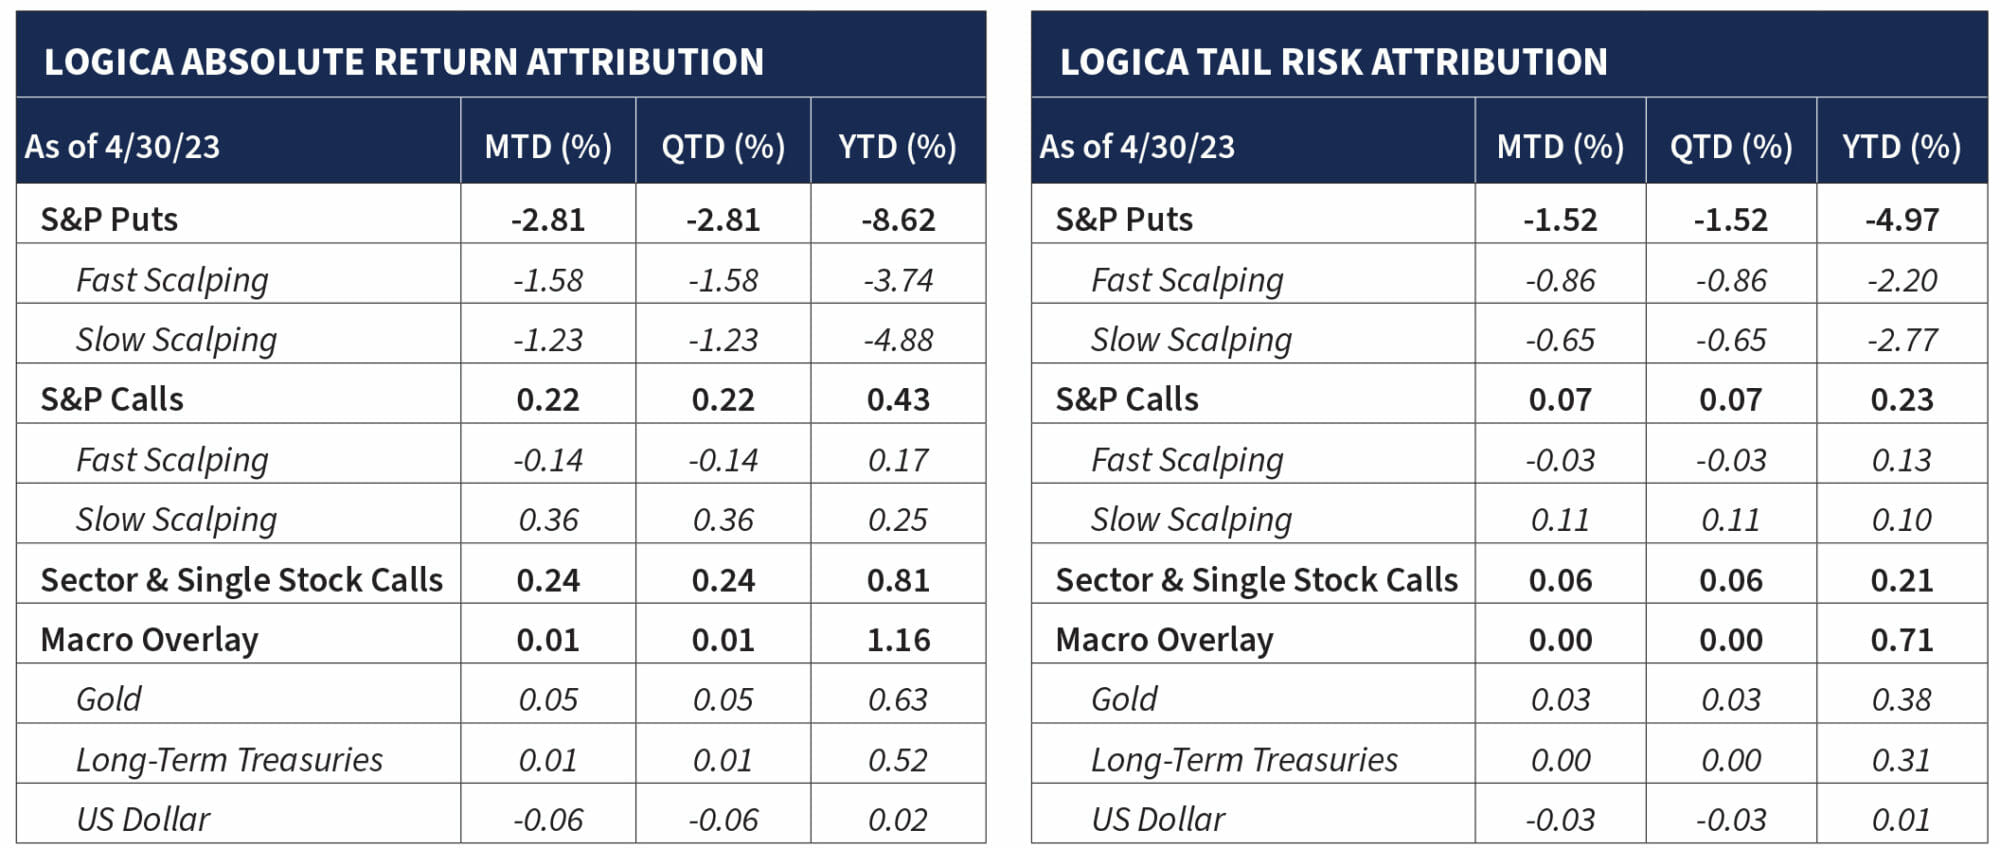
The effect of implied volatility crush is clear across all our modules. To elaborate on our summary above, VOLI, a measure of implied volatility at-the-money (“ATM”), was down -3.42 points in April, alongside -7.5 points YTD (demonstrating just how much of it occurred in the month of April). The implied volatility decline accounts for much of the pain we’ve suffered so far in 2023 (in addition to some points we discuss below).
And while we are never going to suggest that we – or anyone for that matter — could be bottom timers, it goes without saying that at these current levels, and in respect of the long historical record, volatility is nearing the end of its heavy decline and landing fairly into reasonably priced territory. While it closed at 15.5 in April, VIX’s historical average of 16 hasn’t been seen in about a year and a half.
With this in mind, our S Puts got hit particularly hard, while our S Calls faced an aggressive headwind, and while generating alpha, were unable to keep up with the underlying index. Separately, and in relation to the thin market breadth in April, where, as discussed in last month’s letter, the old “FAANG” type behavior has seen leadership from a select group of tech names while the broader market has trailed behind.
Accordingly, and even though our models have been slowly increasing exposure to technology, our Sector and Single Stock Calls also trailed the S 500 Index in April, generating +50bps as a standalone strategy, compared to 1.5% for the S 500.
“Of course size matters. Nobody wants a small cup of coffee.”
– On a Mug
Although we’ve mentioned it in prior letters, we thought it increasingly important to illustrate that our performance is well within expectation, and while seemingly larger by the numbers, this must not be assessed in a vacuum, but in volatility terms, and more importantly, relative to the increasing asymmetry of our positioning.
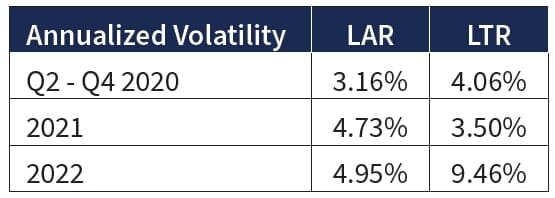
We have been steadily increasing the gross notional exposure of both our strategies throughout late 2022 and 2023 – and are now at approximately 50% higher volatility than last year — and so would like to dive even deeper into the rationale; sharing our philosophy and the associated numbers, analysis, and illustrations to drive home just how much we see in the improving environment.
High level, our models have been doing this in response to several things: the first is the realized variance of our strategy in post Covid 2020, 2021, and 2022 as a function of the inflated cost of volatility since the Covid spike in Q1 of 2020.
The environment post Q1 2020 (a continued unwind of the massive vol spike in Q1 2020) led to our models tightly managing the expected decay/crush, alongside our mandate to continue to carry a meaningful long position in volatility in case any new event were to take place.
This led to admirable results for long volatility during the bear market (in volatility) of the latter part of 2020 and into 2021, and then the continuing inflated, but rangebound volatility market of 2022.
The big point, however, is that our models — that aim to scale gross notional exposure by the expensiveness/cheapness of volatility – have produced fairly low variance in our strategies in recent years; in fact, half of our approximate 10% target in LAR.
With that in mind, and per the “coiling spring” analogy we used in our prior month’s letter, as volatility has more aggressively declined, especially in the environment post-2022, we continue to increase gross notional exposure. We illustrate LAR’s exposure over the last few quarters shown below:
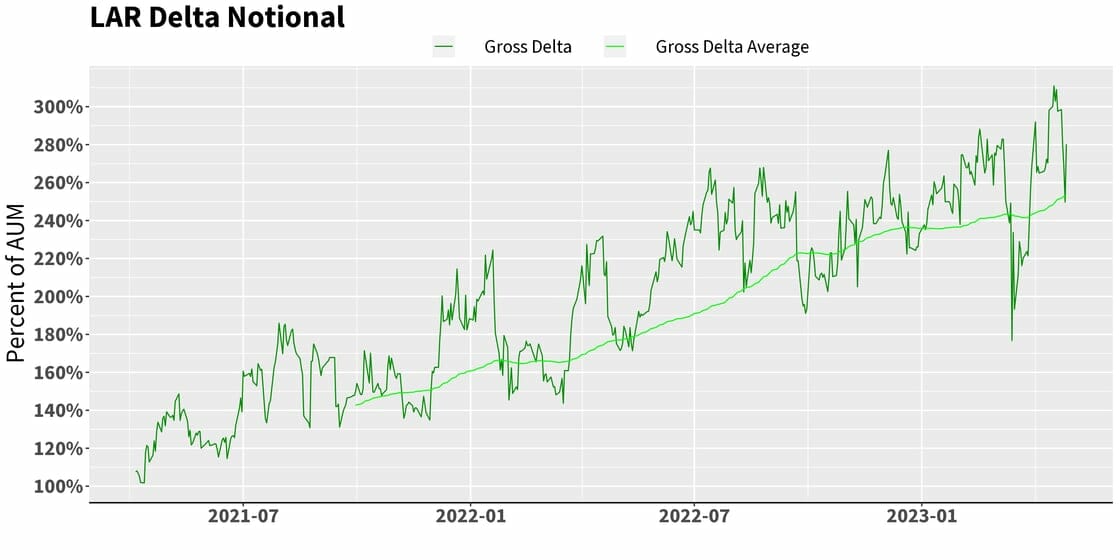
And to be clear, the zig and zags around the trending increase in gross notional exposure is a result of both market movement and our vega scalping along the path. Despite these structural and opportunistic oscillations, it’s clear that our exposure has been steadily increasing in 2022 and into 2023.
And so, our strategy’s volatility, and related magnitude of up/down monthly moves are now expected to be 50% larger than the last several years (specifically, since Q2 2020), as we steadily reclaim our targeted 10% annualized vol (assuming Vol gets that low to enable us to).
One might ask if we started increasing too early. Or suggest that we should’ve waited till VIX at 10-12 (or some materially lower point) to more dramatically scale. Our model did actually wait – as looking at the table above, we stayed lower volatility for quite some time even though implied volatility had already starting declining. Our model has multiple triggers.
Secondly, now that the scaling has begun, we certainly will continue to scale up, harkening back to the compressing spring philosophy, wherein the lower it goes, the less it has to squash, and the more room above it has to leap.
But the reason we don’t just “wait” and load it all up at VIX 12 or some overfit lower number is because we don’t believe one can ever know the “bottom” (what if it doesn’t touch 12 before the next event occurs?!), and so without a crystal ball to the future, the best tool we have is a probabilistic approach given relatively increasing cheapness.
If we assess the probability of payoff, our asymmetry is of course better at VIX 16 than it was at 25. To state the obvious, if the next event occurs, VIX at 25 might pop to the 30’s for perhaps a 5-10 point leap, but at 16 would just as easily give us a doubling! And, concurrently, in the other direction, 25 can crush in half to 12, whereas once at 12, history tells us that we’ve got very little downside left.
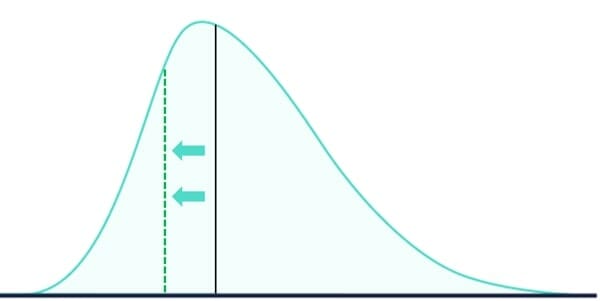
In fact, VIX at 9 or 10 is about the lowest we’ve ever seen it (in 2017). If we expand this idea out more generally, it is analogous to the Omega ratio in evaluating hedge fund returns, but with respect to the beautiful right skewed distribution we all love about volatility.
To understand fully, view the illustration below, considering the ratio of density (area under the curve) in the distribution to the RIGHT vs. to the LEFT of the solid line. At the solid line, we have decent asymmetry, but as we move toward the dashed line, there becomes even greater asymmetry, with more area to the right, and less area to the left. Our asymmetric “density ratio” (effective Omega) has improved significantly.
In Logica’s view, and thanks to many years of empirical work in this area, we are very confident in the power of this model – a probabilistic approach to improving asymmetry. Summarized simply, we believe that since one cannot ever call the bottom, and a vol spike (aka crisis event) can come at any moment, the greater asymmetry there is in the payoff, the bigger bet one should take.
So, while on the one hand we can acknowledge that the pain of increasing notional exposure along the way can be difficult to endure, on the other hand, we steadfastly trust the mathematics and have confidence in the thesis. In fact, this is the cornerstone of right-skew investing: as an asset gets more attractive, hold more of it. In this case, we are rigorously measuring and quantifying that relationship.
Of course, the balancing act is that one needs reliable sources of alpha to carry that additional inventory in potentially waiting months, or even years, for a payoff. And while we do have these alpha generators in place, we acknowledge there has been some recent weakness in them (although well in the bounds), alongside a higher-than-average decline in volatility as the “spring” compressed — at a higher overall exposure.
The Volatility Market: Looking Outside
“Without data you’re just another person with an opinion.”
– W. Edwards Deming
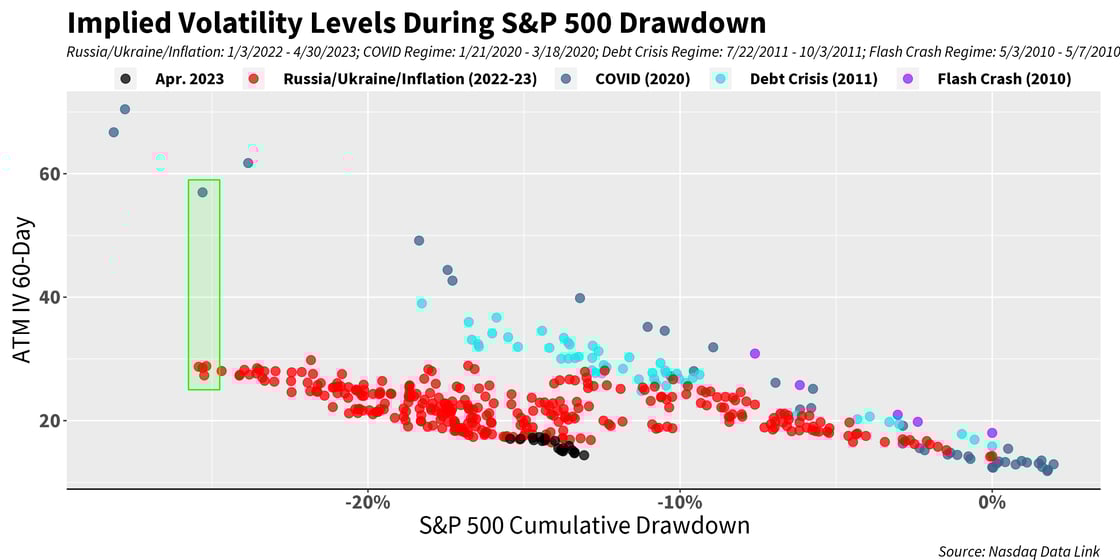
Turning toward the volatility landscape, we now see some new “lows” made in April throughout this prolonged S 500 drawdown that began in early 2022:
And as discussed above (and in the top summary of the letter), we can visualize how the VIX crushed more in April than one might expect given the S 500 return of +1.46% on the month:
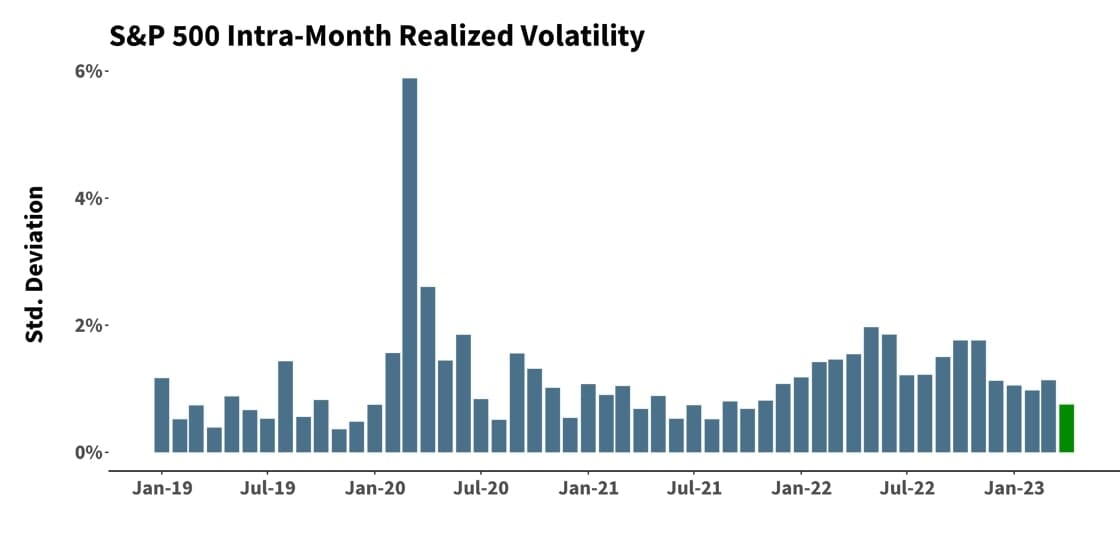
That said, IV crushed with conceptually good reason, as realized volatility recorded its lowest calendar month print since late 2021:
“Volatility is smiling again.”
– Wayne Himelsein
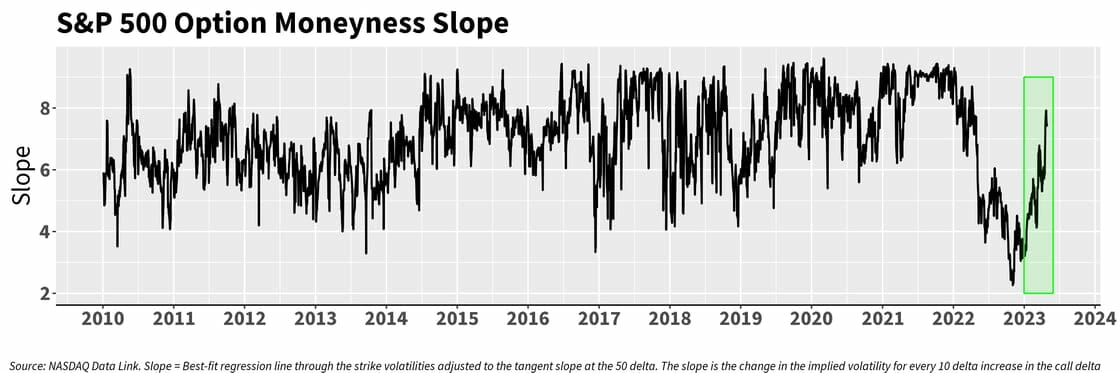
And we see clear evidence that OTM implied volatility has bounced back in a huge way in 2023 relative to ATM. Recall that we suggested this reversion was likely, probabilistically speaking, back in our December of 2022 and January 2023 letter, when we pointed out that “the compression of skew seemed overdone, and the mean reversionary tendency of markets was likely eager to reveal itself.”
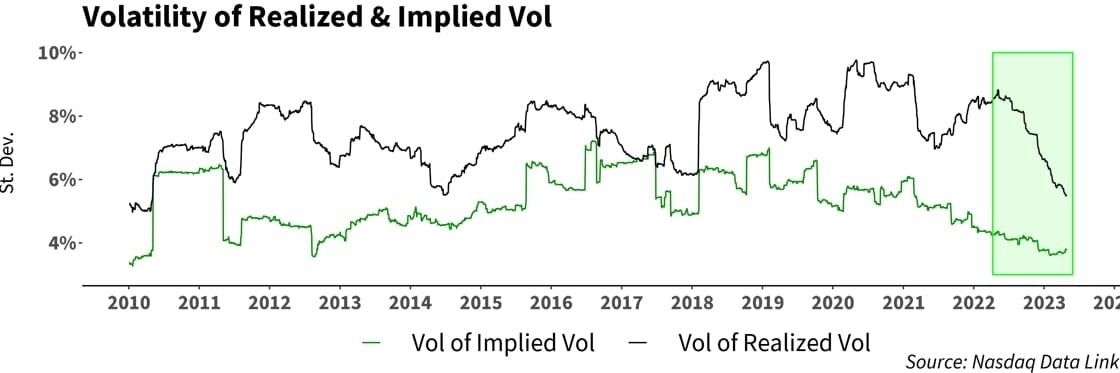
Relatedly, in observing Vol-of-Vol, we note that the vol of realized vol has been falling at a far more dramatic rate than the vol of implied vol. We have mentioned this in prior letters, and April just continued this trend. This speaks, once again, to the increasingly “fair” pricing in volatility:
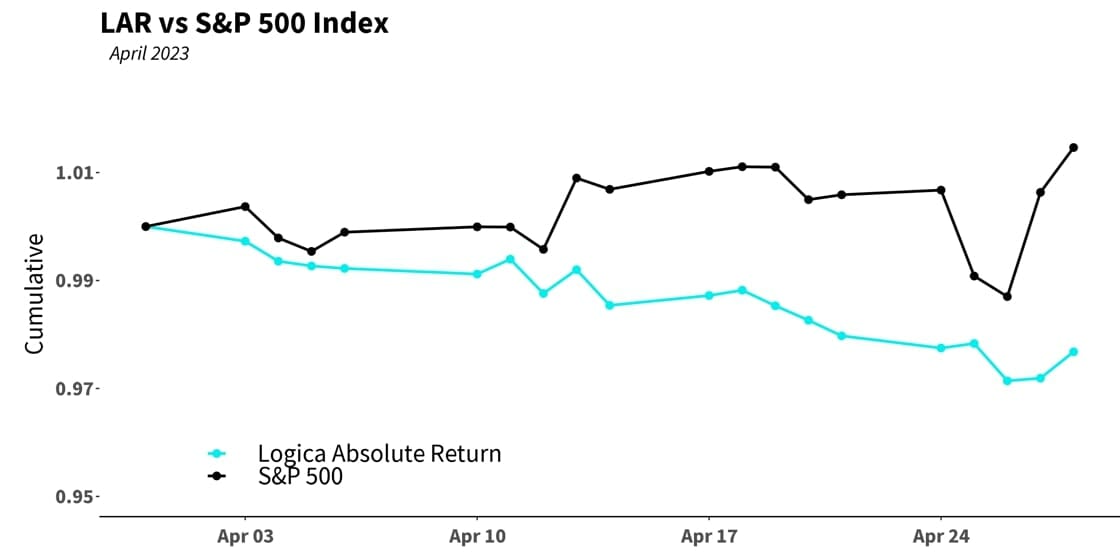
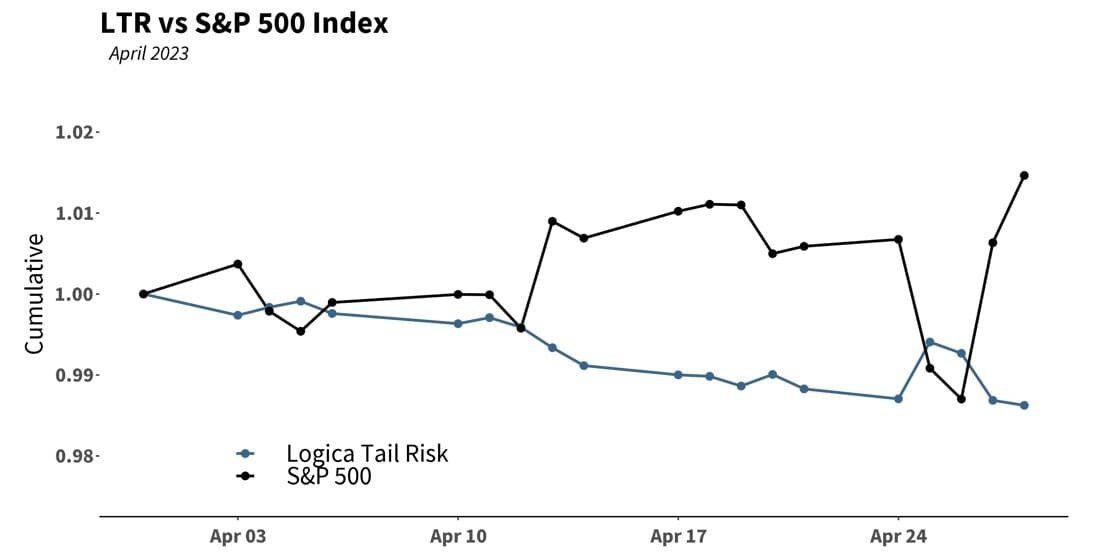
Finally, taking a closer look at the daily movement of our strategies for the month of April, we can see that both strategies deteriorated over the course of the month in the face of a large volatility headwind:
Source valuewalk