

It’s All About Fear


It is a waste of time to try and assign cause to moves in the market. Market systems are both complex and chaotic; complex because there are so many variables, and chaotic because, even if we understood how all the variables interact (which we do not), we can never know the initial conditions of all the variables, which makes the market look like chaos.
News, geopolitical or financial, do not correlate consistently with market moves; sometimes, bad news has a positive effect, and good news can have a detrimental effect. News simply does not matter! The only consistent factor is the emotion of fear…fear of losing…and fear of missing-out (greed). That, never changes.
Human emotion leaves repetitive patterns in the markets. We need to find these patterns, and listen to what they are saying.
Sentiment-Based Patterns
AAII
With the AAII sentiment survey at only 38% bullish, there is little risk of a market turn. Most markets do not top out until the bull sentiment is above 50% and the bear sentiment is below 30%. There is simply too much fear in the market for this to be a market top (chart below).

NAAIM
The National Association of Active Investment Managers (NAAIM) exposure index 50-week MA leads market down-turns and lags market up-turns. It has flattened and is starting to move back up. This is a pattern that is seen at the start of market rallies, not at the end of them (chart below).

Put-to-Call Ratio
The put-to-call ratio has a strong negative-correlation with the SPX (S&P 500); down-spikes in the 8-week MA indicate local market tops, while up-spikes indicate local bottoms. A down-spike formed in early June, marking the local high in the SPX, after which, the market dropped until the final week of June.
Since then, until this past week, the 8-week MA had been rising which normally correlates with a decreasing SPX, but this time, the SPX has been rallying along with the Put-to-call ratio. This week, the 8-week MA made an up-spike (blue oval, furthest to the right) which has a nearly 100% probability of being followed by a rally (chart below).

PE:VIX
The price/earnings ratio of the S&P 500 in ratio to the volatility index (PE:VIX) has a strong direct-correlation to the S&P 500; 85% of up-spikes in the ratio correspond with local market tops, while nearly 100% of down-spikes correspond with market lows.
Last week we wrote:
This past week, a down-spike formed which implies a rally from this point (chart below).

Here is this week’s PE:VIX chart:

This continues to be a bullish pattern.
VIX
The volatility index (VIX), by itself, has a strong inverse correlation with the S&P 500; down-spikes in the VIX correlate with market highs. As we have been stating for several weeks now, the current VIX pattern has some potential to move up (SPX down) without changing the over-all bullish pattern. However, the market has charged higher without a break. This is a similar pattern to what we saw during the powerful September/17 to January/18 rally. Last week, we stated that “This supports the idea that the market is going to reach for new highs sooner rather than later”, and that is exactly what happened (chart below).

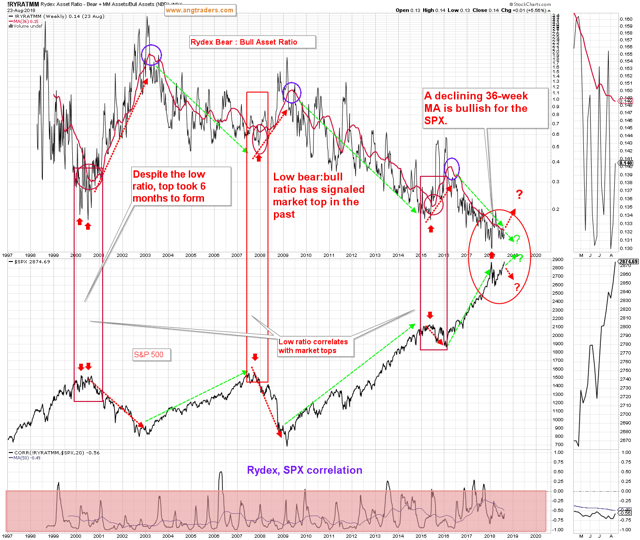
Rydex Bear:Bull Asset Allocation Ratio
The bear-to-bull asset allocation of the Rydex family of funds, has a strong inverse correlation with the SPX; a declining 36-week MA in the Rydex ratio is bullish for the SPX. Down-spikes in the ratio, correspond with tops in the market. In other Weekly Summaries, we have pointed out the similarity in trading patterns of the current bull market, with those of the tech bull market of 2000. During the later-stages of the tech rally, the Rydex ratio (nominal) made a down-spike early in 2000, but the 36-week MA continued to move lower while the SPX moved higher for another six-months before hitting its second (and final) high, and the Rydex ratio made its second (and final) down spike. It looks like this pattern is again forming.
We saw new highs in the SPX this week and the Rydex bear-to-bull ratio’s 36-month MA continued lower (chart below). This remains a bullish pattern and not what you would expect if the market was weakening (chart below).
All of the above patterns, correlate with the underlying market sentiment that is prevalent during bull markets. Geopolitical or financial news do not even come into consideration. We are not at the end of the current bull market.
We provide our subscribers with a unique perspective, developed over the past 40-years, which helps to keep us on the ‘right-side’ of the market, and away from the herd.
SPECIAL NOTICE: As of September 5/18, our subscription rates (for new subscribers only) will be $50/month or $400/year.
We invite you to join us, before September 5/18, at the current rate of $30/month or $240/year, which will never increase as long as the membership is maintained.
ANG Traders
Join us at www.angtraders.com
Source: Nicholas Gomez