

Is This The Inflection Point?


For months now, we have been pointing out that stocks, bonds, and gold were trading off-the-curve and unsupported by the fundamentals. We also pointed out that there is no way of predicting when reality will hit the market and bring prices back down to meet the curve.
Friday’s move in the markets had the look of an inflection point, but one day does not determine the great return to the mean.
{This section is for paid subscribers only}
Even though it is unlikely that the FED will raise rates in September, the bias for interest rates is up. We opined that the FED wanted to “chatter” about raising rates while staying pat until after the election, and that seems to be what is happening. Throw in the fact that the European Central Bank (ECB) is leaving both its interest rate complex, and its asset purchase program unchanged from July, and the bias only gets louder.
Recall that the markets have been rallying as if there was no risk, mostly because the various central banks, through their asset purchases, have removed the risk that is normally associated with owning equities and bonds by guaranteeing liquidity and prices as the buyers of last resort. On Thursday, the ECB backed-away from increasing its bond purchases and this seemed to throw some cold reality on the market; without the central banks’ guaranteed asset purchases, the risk/reward is suddenly increased.
Stocks
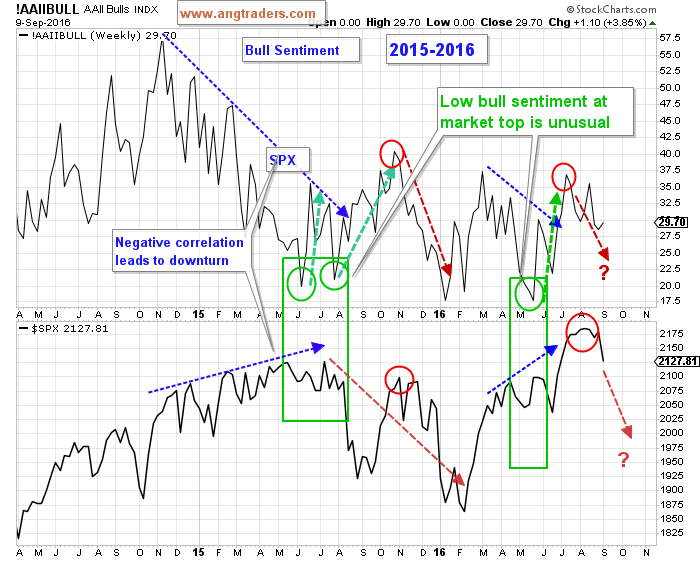
A pattern that we track, which we haven’t displayed for a while, is the Rydex Bull Assets versus the S&P 500 (chart below). When the Rydex Bull Assets are dropping, while the SPX is rising (negative correlation), a correction in the SPX usually occurs (pink arrows).
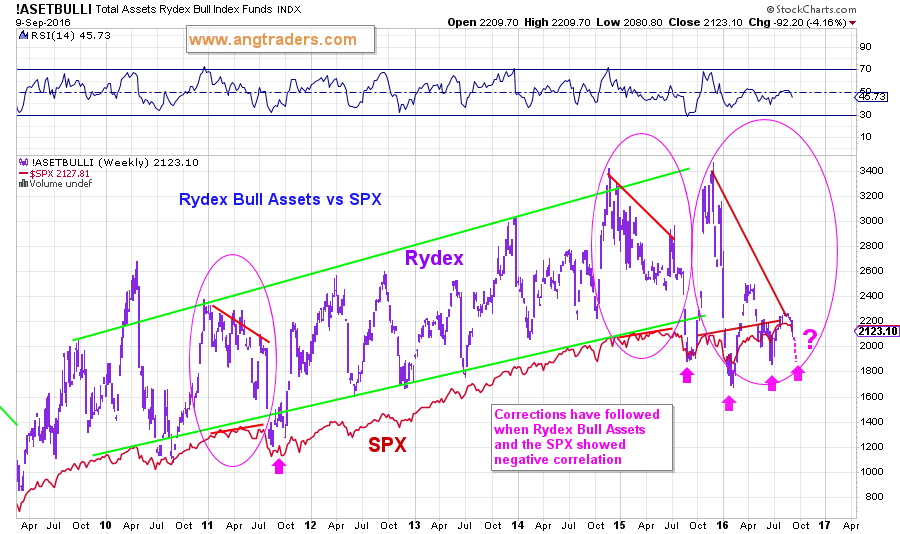
At the moment, a drop down to the 2000 level on the S&P 500 is likely, and if this psychological support is breached, there is very little fundamental support underneath. With the price-to-earnings ratio (PE) at a very high 25, it would take a 40% drop in the S&P 500 index, or a 60% increase in earnings, or some combination of the two, in order to return to the long-term mean PE of 15.
{This section is for paid subscribers only}
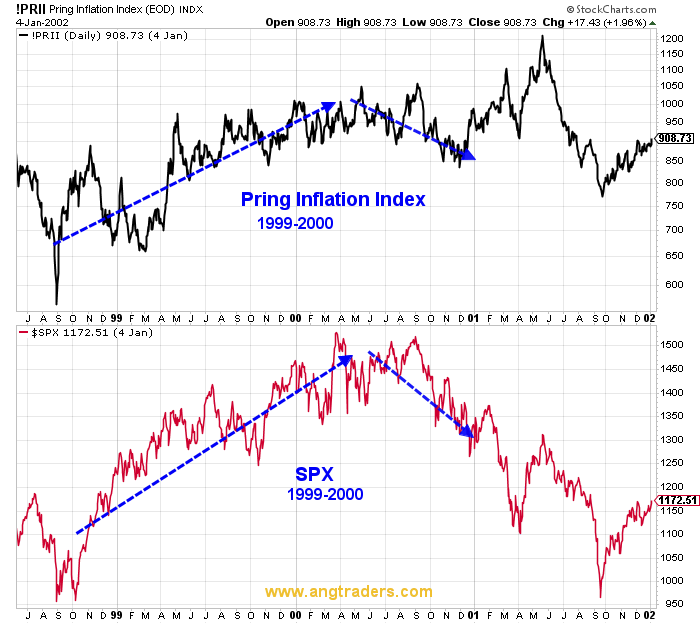
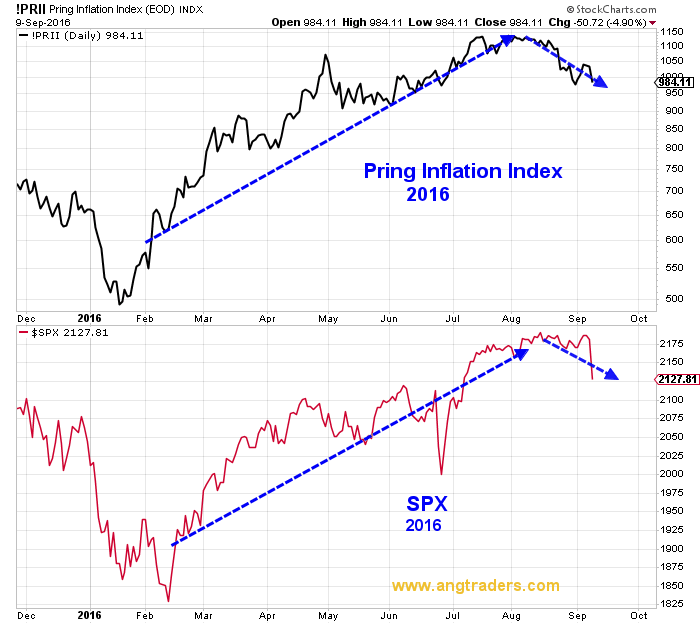
Recently, we outlined the similarities that exist between the trading patterns of 1999, and those of today. The next two charts show how the SPX traded relative to the Pring Inflation Index, then and now. The pattern is predicting further downside.
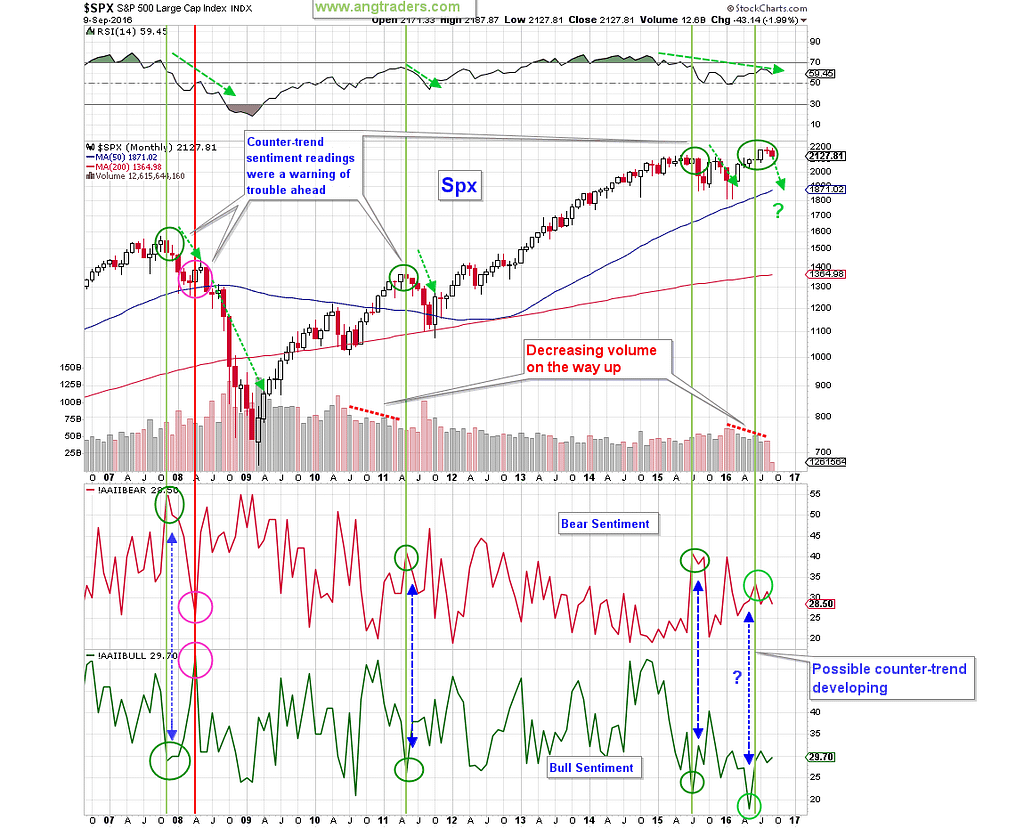
The low-bull-sentiment-at-market-tops pattern continues to play-out. The first chart below shows the long-term pattern, while the second chart show the short-term pattern.
{This section is for paid subscribers only}
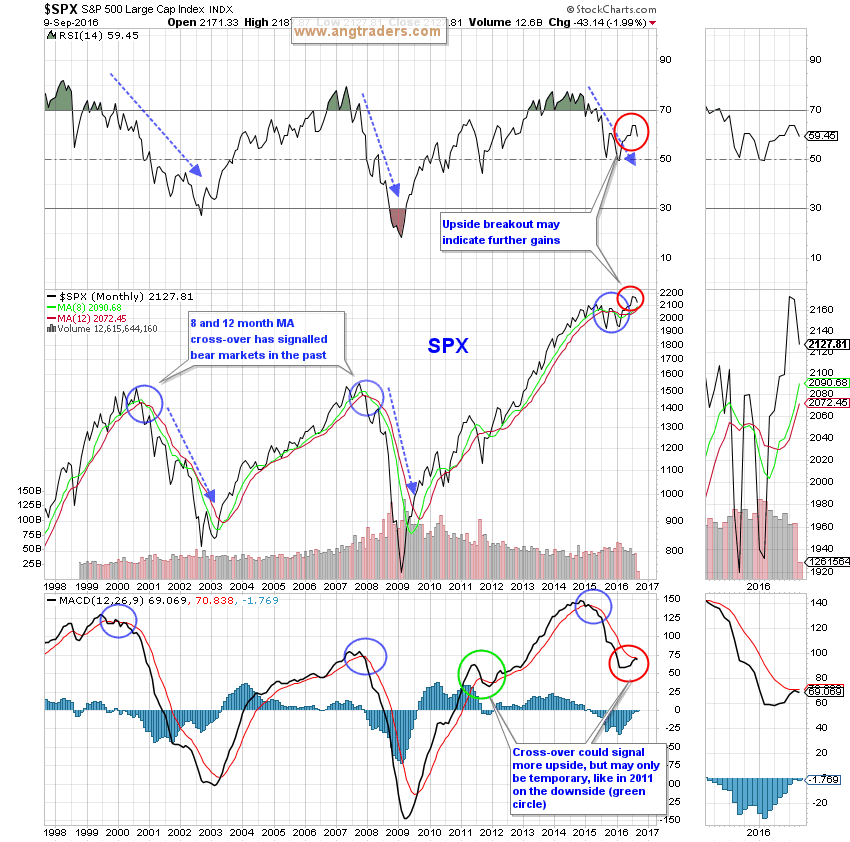
The chart below shows a long-term view of the SPX and some of its indicators. The fact that the MACD did not complete the cross-over (bottom red circle), increases the chances of a resumption of downward pricing for the S&P 500.
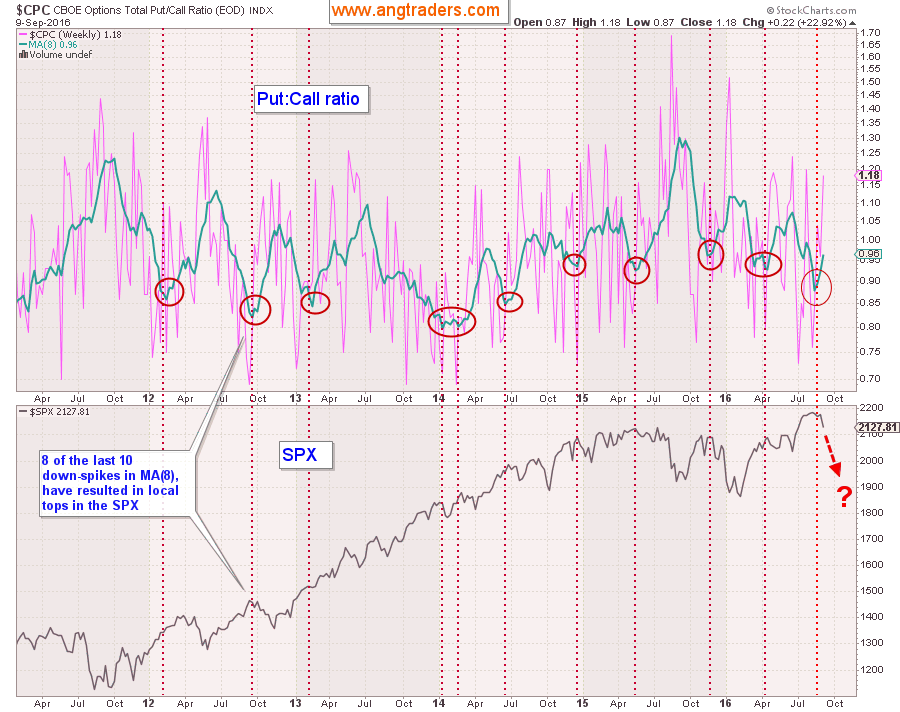
The put to call ratio (chart below), reinforces the likelihood that at least a local top has formed.
{This section is for paid subscribers only}
Gold
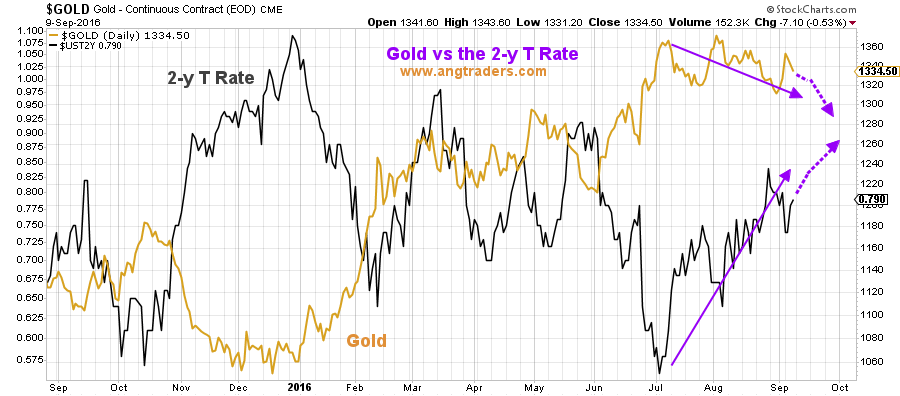
The upward-bias in rates discussed above, has begun to affect gold. The chart below shows how the 2-year Treasury rate has been increasing since the beginning of July and that gold has been decreasing in response.
But gold has not been affected anywhere near as much as the junior gold miners. The gold miners end up being affected on two counts; they are affected by lower gold prices and they are affected by weak equity markets.
{This section is for paid subscribers only}
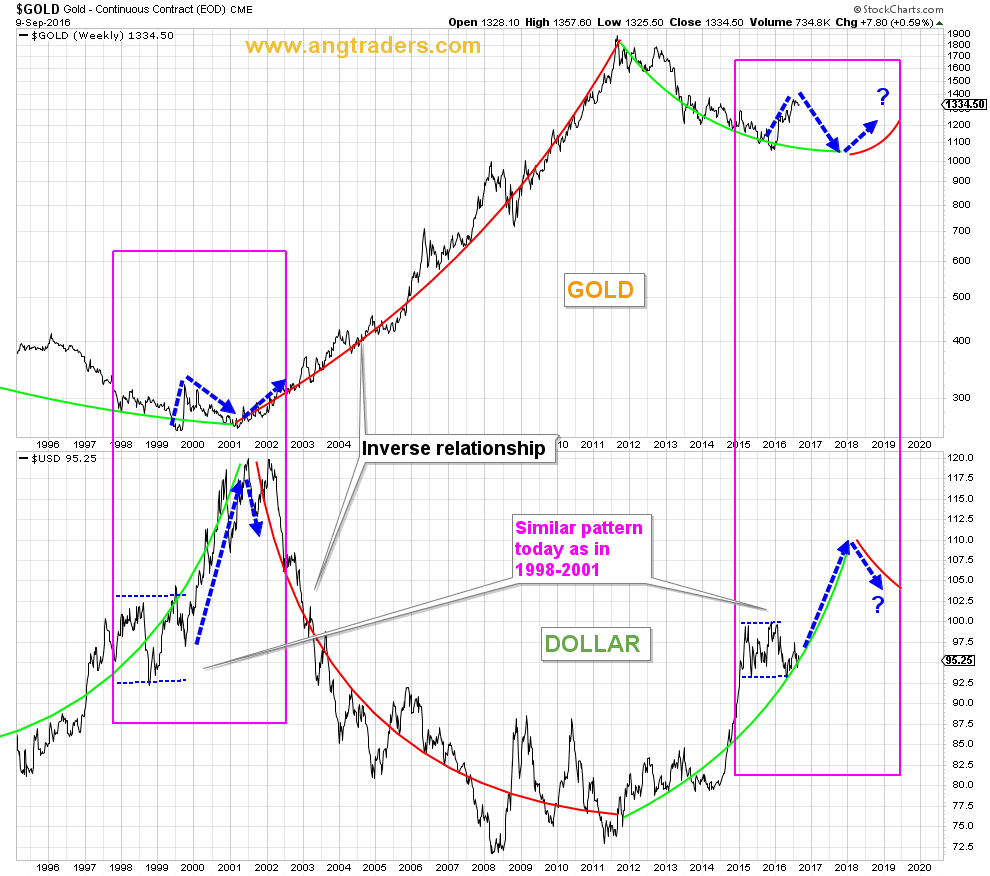
Like the equity market, gold and the dollar seem to be trading like they did in 1999 (pink rectangles on the chart below); the dollar is following the curve upward and gold is moving down to meet its curve. After gold meets the curve, it could turn around to start a new bull market like it did in 2001. We continue to hold the view that the rise in gold, since the start of the year, is not fundamentally supported, but that later in 2017 the inflation conditions and the value of the dollar, might provide a foundation for a new Gold rally to grow from.
{This section is for paid subscribers only}
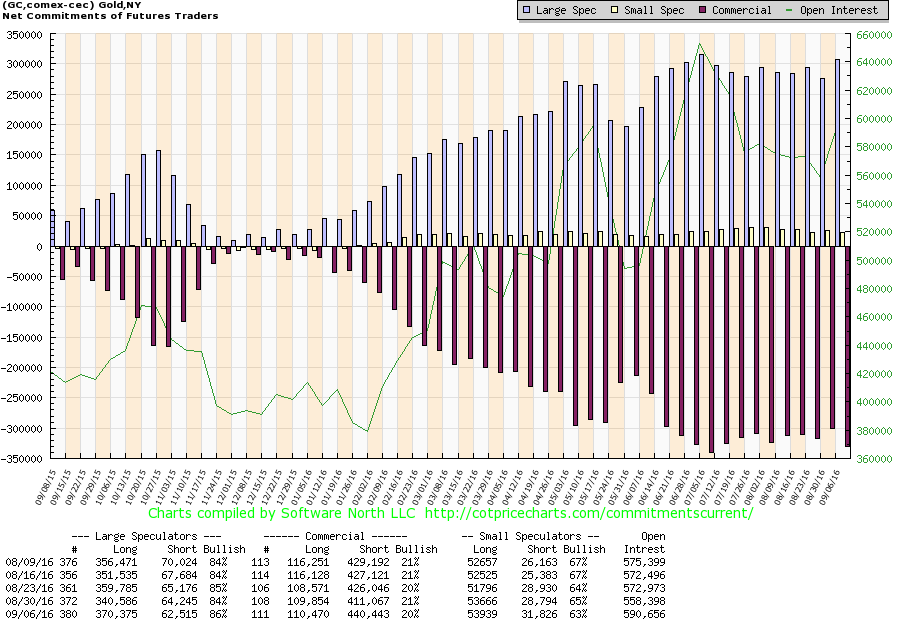
The commitments of gold futures traders continue to hover at historical highs. Not including the Wednesday to Friday data, the speculators (hedge funds) have increased their long position, while the commercials traders (producers, users, and swap dealers) have increased their short positions (chart below).
In conclusion, the probability of a continued correction in both equities and gold is high, but of course not guaranteed.
{This section is for paid subscribers only}
Please monitor email for Trade Alerts.
We wish our subscribers a profitable week ahead.
Regards,
ANG Traders
Join us at www.angtraders.com and replicate our trades and profits.
Email queries to [email protected]
Source: Nicholas Gomez