

Partying Like It’s 1999


In our recent SA article, we pointed out that the gold market today has a number of similarities to that of 1998–2001. Here, we present the argument that today’s stock market also has some intriguing similarities to that period in the Tech bubble.
During the tech bubble, people were aware of the unreasonable valuations in the market, just like we are today. Greenspan’s warning of “irrational exuberance” came in 1996, but the market rallied for another four years before reality hit. No two markets are exactly alike, but all markets have similarities.
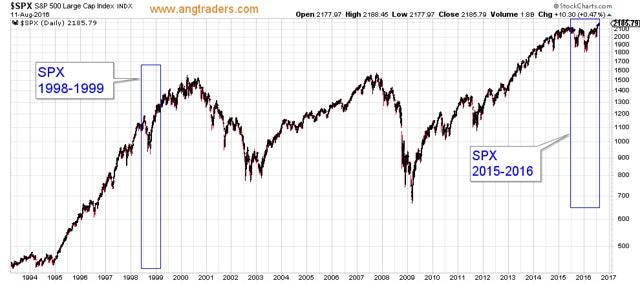
In the graph below, we have blocked-off two time-periods that may have some relevant similarities: the double-bottom and subsequent rally of 1998 -1999, and the recent double-bottom of 2015–2016.
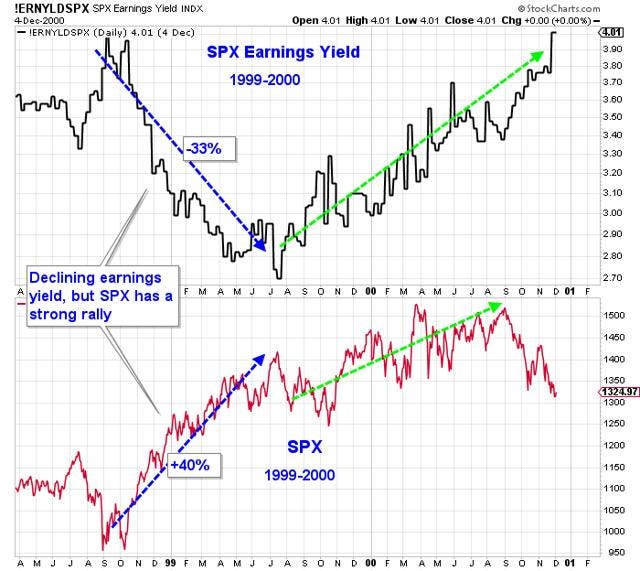
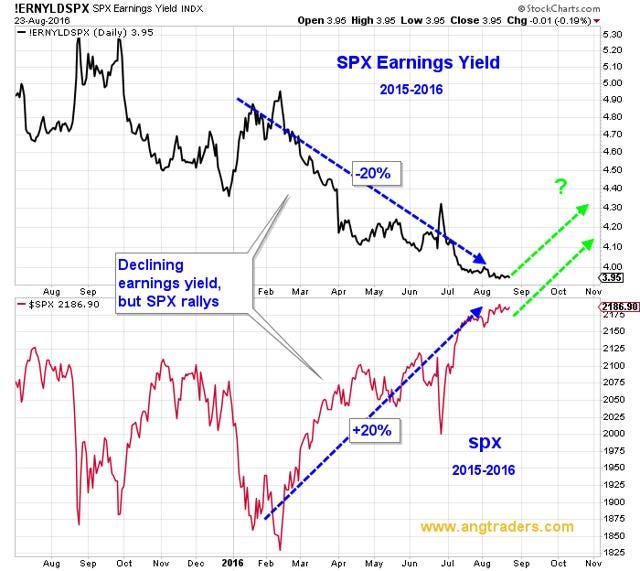
Below, we have expanded the two time-frames and have pointed out the similar trading patterns between S&P 500 earnings yield and the S&P 500 index. Notice how between October 1998 and July 1999, earnings yield declined 33%, while the SPX increased by 40%, and between January and August 2016, the earnings yield declined 20%, while the SPX increased by 20%. Declining earnings yield did not stop the equity rally then, and it’s not stopping it now.
The Pring Inflation Index tracks inflation-sensitive sectors such as mining and energy. As illustrated in the charts below, the SPX is increasing along with the Pring Inflation Index this year, just as it did in 1999.
Finish reading the rest of the article here.
ANG Traders
www.angtraders.com
Source: Nicholas Gomez