

How does sharewise work?
Discuss
Discuss and share predictions for your favorite stocks in the forum. Let your opinion be heard
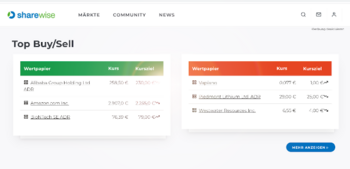
Show moreTop Buy/Sell (This Month)
| Security | Price | Target price |
|---|---|---|
| ServiceNow Inc. | €77.30 | €160.70 |
| Amazon.com Inc. | €221.85 | €244.48 |
| NVIDIA Corp. | €182.08 | €208.15 |
| Security | Price | Target price |
|---|---|---|
| T.Rowe Price Group Inc. | €86.07 | €82.63 |
| Southern Copper | €145.60 | €132.22 |
| Prudential Financial | €82.78 | €79.37 |
New Top predictions since last week
| Prediction | User | Perf. (%) |
|---|---|---|
| B AnaptysBio Inc | Barclays PLC | 28.22% |
| B Sivers Ima Holding Ab | PortfolioMoney40 | 14.91% |
| B InflaRx NV | Oppenheimer Holdings Inc. | 14.85% |
| Prediction | User | Perf. (%) |
|---|---|---|
| S POET Technologies Inc. | Kryptonit | -48.60% |
| S Sparc Ai Inc. | daimler1 | -44.80% |
| S Intellia Therapeutics Inc | michaelkr | -26.08% |
Many tell you which stocks to buy.
We measure how often they are right!


Portfolios of our members
A.D.S.6

When it comes to stocks, what is important for you?
Find stocks based on your criteria with our sharewise stock finder. All results are based on thousands of votes by our community
Pros and Cons of these stocks (New Predictions)
Meta Platforms Inc.
WKN: A1JWVX / Symbol: FB / Name: Meta / Stock / Software & IT Services / Large Cap /
Pros
Cons
Yelp Inc. A
WKN: A1JQ9H / Symbol: YELP / Name: Yelp / Stock / Media & Publishing / Mid Cap /
Pros
Cons
Try sharewise+ and get hundreds more matching stocks
Sign up for free!Tops & Flops S&P 500
| Security | Price | Change(%) (%) |
|---|---|---|
| Centene Corp. | €42.34 | 14.110% |
| Franklin Resources Inc. | €25.16 | 5.780% |
| Nucor Corp. | €192.25 | 5.180% |
| Discovery Communications C | €22.42 | 5.110% |
| Humana Inc. | €197.00 | 4.710% |
| Security | Price | Change(%) (%) |
|---|---|---|
| Alexandria Real Estate Equ. | €34.58 | -10.970% |
| Pentair plc | €70.78 | -10.160% |
| Zimmer Holdings | €70.70 | -10.120% |
| Universal Health Services B | €139.00 | -9.740% |
| Corning Inc. | €130.66 | -9.100% |
Courses
sharewise Introduction


Key figures for stocks
Predictions

Cognizant Technology Solutions Corp.
28.04.26
28.04.27
28.04.26
Top News

The $880M Bet to Survive Real Estate's Reset
A definitive agreement for The Real Brokerage Inc. (NASDAQ: REAX) to acquire RE/MAX Holdings, Inc. (NYSE: RMAX) for an $880 million enterprise value is a high-stakes strategic survival maneuver

Giants Costco, Sanofi, and SAP Raise Dividends by Over 10%
Several stocks with market capitalizations above $100 billion just made notable dividend announcements. These names are among the largest in their respective industries, and despite widely

Coca-Cola’s Q1 Results Prove It's a Good Buy to Hold and Hold
Coca-Cola (NYSE: KO) is not without headwinds, but it is navigating them well, delivering market-beating results and driving ample cash flow.
Its Q1 earnings results highlighted its strengths

Joby’s Stock Just Got Its Wings Over New York City
The future of urban transportation has long been a promising but distant vision for investors. However, a series of recent flights weaving through the iconic New York City skyline has forcefully

Insiders Are Selling Big Tech, But Here Are 3 Reasons You May Not Want To
Insiders are selling big tech stocks, but investors should think twice about doing the same.
The insiders, all of whom have been in position for years, most for at least 10 and some for over 20
Compared to Estimates, Unum (UNM) Q1 Earnings: A Look at Key Metrics
For the quarter ended March 2026, Unum (UNM) reported revenue of $3.36 billion, up 1.9% over the same period last year. EPS came in at $2.14, compared to $2.04 in the year-ago quarter.
The reported


South Plains Financial (SPFI) Q1 Earnings: How Key Metrics Compare to Wall Street Estimates
South Plains Financial (SPFI) reported $54.15 million in revenue for the quarter ended March 2026, representing a year-over-year increase of 10.2%. EPS of $0.85 for the same period compares to $0.72

Compared to Estimates, Webster Financial (WBS) Q1 Earnings: A Look at Key Metrics
For the quarter ended March 2026, Webster Financial (WBS) reported revenue of $735.87 million, up 4.4% over the same period last year. EPS came in at $1.57, compared to $1.30 in the year-ago

Here's What Key Metrics Tell Us About Bank of NT Butterfield & Son (NTB) Q1 Earnings
For the quarter ended March 2026, Bank of NT Butterfield & Son (NTB) reported revenue of $155.9 million, up 5.5% over the same period last year. EPS came in at $1.55, compared to $1.30 in the
Ashland (ASH) Reports Q2 Earnings: What Key Metrics Have to Say
Ashland (ASH) reported $482 million in revenue for the quarter ended March 2026, representing a year-over-year increase of 0.6%. EPS of $0.91 for the same period compares to $0.99 a year ago.
The
Mirion Technologies (MIR) Q1 Earnings: Taking a Look at Key Metrics Versus Estimates
Mirion Technologies, Inc. (MIR) reported $257.6 million in revenue for the quarter ended March 2026, representing a year-over-year increase of 27.5%. EPS of $0.10 for the same period compares to
News
Seacoast Banking (SBCF) Reports Q1 Earnings: What Key Metrics Have to Say
For the quarter ended March 2026, Seacoast Banking (SBCF) reported revenue of $205.07 million, up 45.8% over the same period last year. EPS came in at $0.62, compared to $0.38 in the year-ago
American Assets Trust (AAT) Reports Q1 Earnings: What Key Metrics Have to Say
American Assets Trust (AAT) reported $110.59 million in revenue for the quarter ended March 2026, representing a year-over-year increase of 1.8%. EPS of $0.51 for the same period compares to $0.70 a
Compared to Estimates, RenaissanceRe (RNR) Q1 Earnings: A Look at Key Metrics
For the quarter ended March 2026, RenaissanceRe (RNR) reported revenue of $2.61 billion, down 16.7% over the same period last year. EPS came in at $13.75, compared to -$1.49 in the year-ago quarter.
Merchants Bancorp (MBIN) Q1 Earnings: Taking a Look at Key Metrics Versus Estimates
For the quarter ended March 2026, Merchants Bancorp (MBIN) reported revenue of $175.25 million, up 20.1% over the same period last year. EPS came in at $1.25, compared to $0.93 in the year-ago
Renasant (RNST) Q1 Earnings: How Key Metrics Compare to Wall Street Estimates
For the quarter ended March 2026, Renasant (RNST) reported revenue of $273.83 million, up 60.5% over the same period last year. EPS came in at $0.93, compared to $0.66 in the year-ago quarter.
The

Chain Bridge Bancorp, Inc. (CBNA) Q1 Earnings: Taking a Look at Key Metrics Versus Estimates
For the quarter ended March 2026, Chain Bridge Bancorp, Inc. (CBNA) reported revenue of $17.37 million, up 19.4% over the same period last year. EPS came in at $1.08, compared to $0.85 in the
Compared to Estimates, Stellar Bancorp (STEL) Q1 Earnings: A Look at Key Metrics
Stellar Bancorp (STEL) reported $111.04 million in revenue for the quarter ended March 2026, representing a year-over-year increase of 6%. EPS of $0.58 for the same period compares to $0.46 a year
Sensata (ST) Q1 Earnings: Taking a Look at Key Metrics Versus Estimates
Sensata (ST) reported $934.8 million in revenue for the quarter ended March 2026, representing a year-over-year increase of 2.6%. EPS of $0.86 for the same period compares to $0.78 a year ago.
The
Landstar (LSTR) Q1 Earnings: Taking a Look at Key Metrics Versus Estimates
Landstar System (LSTR) reported $1.17 billion in revenue for the quarter ended March 2026, representing a year-over-year increase of 1.6%. EPS of $1.16 for the same period compares to $0.85 a year
Contest

Still running
sharewise
Du findest das sharewise Projekt spannend und möchtest es unterstützen?
Mit einer
sharewise+-Mitgliedschaft
unterstützt du uns finanziell und bekommst zusätzliche Funktionalitäten freigeschalten.

Leeway
Die Analyse-Plattform Leeway untersucht mit KI-unterstützten Algorithmen aussagekräftige Zusammenhänge am Aktienmarkt. Anhand von vielen Millionen Datenpunkten finden die Algorithmen die Kennzahlen und Bewegungen, die nachweisbare Auswirkungen haben und Vorteile schaffen.
Kostenlos ausprobieren
Heibel Ticker
sharewise sagt: Stephan Heibel ist ein langähriger Unterstützer und Autor der Wunschanalyse. Er betreibt meiner Meinung nach einen der besten Börsenbriefe. Es gibt eine kostenlose und eine Premium Variante.
Kostenlos ausprobierensharewise
Du findest das sharewise Projekt spannend und möchtest es unterstützen?
Mit einer
sharewise+-Mitgliedschaft
unterstützt du uns finanziell und bekommst zusätzliche Funktionalitäten freigeschalten.