

"When all feels calm and prices surge, the markets may feel safe; but, in fact, they are dangerous because few investors are focusing on risk." --Seth A. Klarman


Long Treasuries, Short Stocks

LONG TREASURIES, SHORT STOCKS (September 4, 2023): In the entire history of the U.S. financial markets there has rarely been an opportunity where U.S. Treasuries were such compelling investments relative to U.S. stocks. The 6-month U.S. Treasury bill is yielding just about exactly 5.5% while the S 500 Index is yielding less than 1.6%, one of the greatest spreads ever recorded.
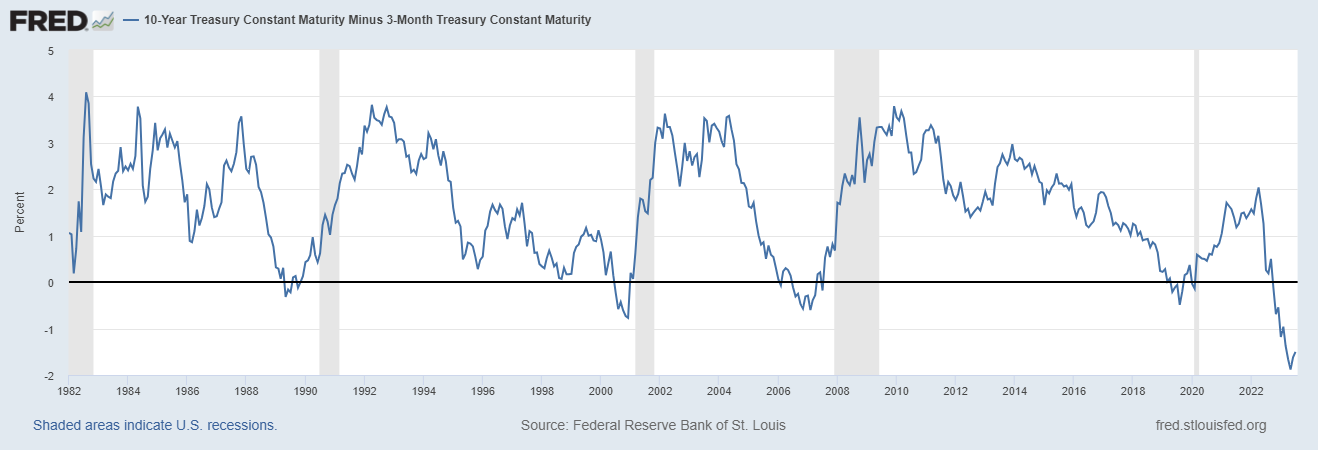
The U.S. Treasury yield curve is at all-time record inversion, meaning that the short-term U.S. Treasury bills of several months to maturity have their widest-ever spreads over longer-term U.S. Treasuries. This chart shows the spread between the 3-month and 10-year U.S. Treasuries going back to 1982:
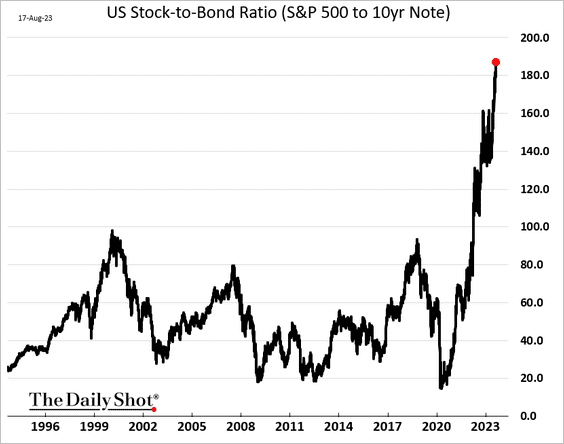
Here is a chart showing the extreme relative outperformance of the S 500 Index relative to the 10-year U.S. Treasury since 1993:
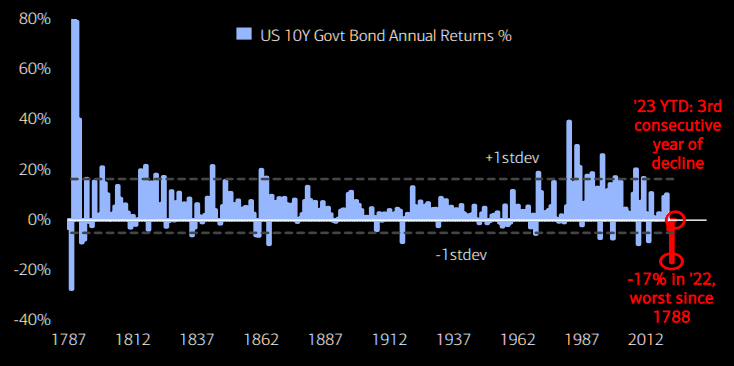
The 10-year U.S. Treasury hasn't underperformed so dramatically since it was first introduced by Alexander Hamilton in 1789, the year before the 1790 debut of equities trading on the Philadelphia Stock Exchange:
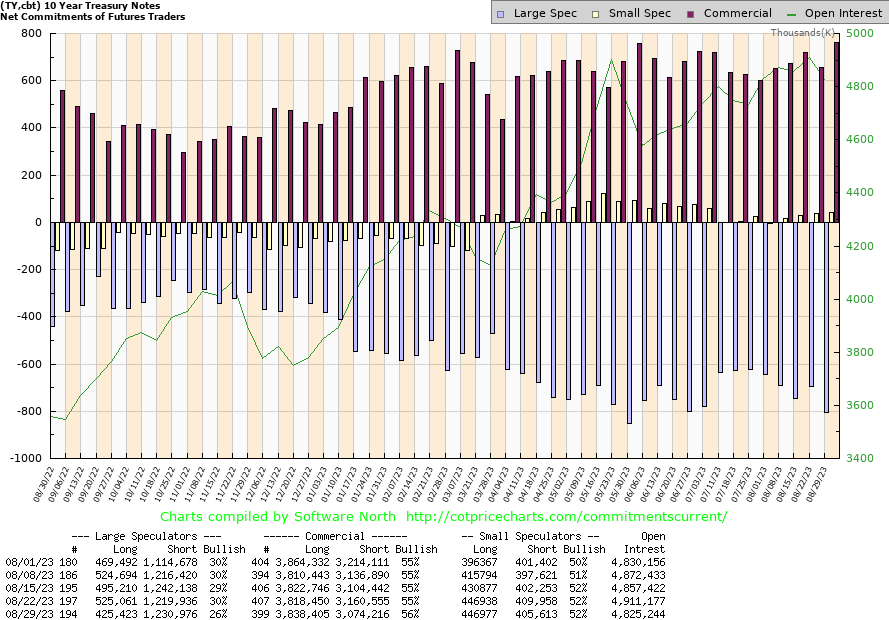
Commercials in U.S. Treasuries, analogous to top corporate insiders for individual companies, have a total net long position which is roughly twice their previous all-time record going back to 1990. The maroon bars represent the commercials in the 10-year U.S. Treasury, meaning those who trade it as a necessary part of their career rather than for the purpose of speculation (special thanks to Software North):
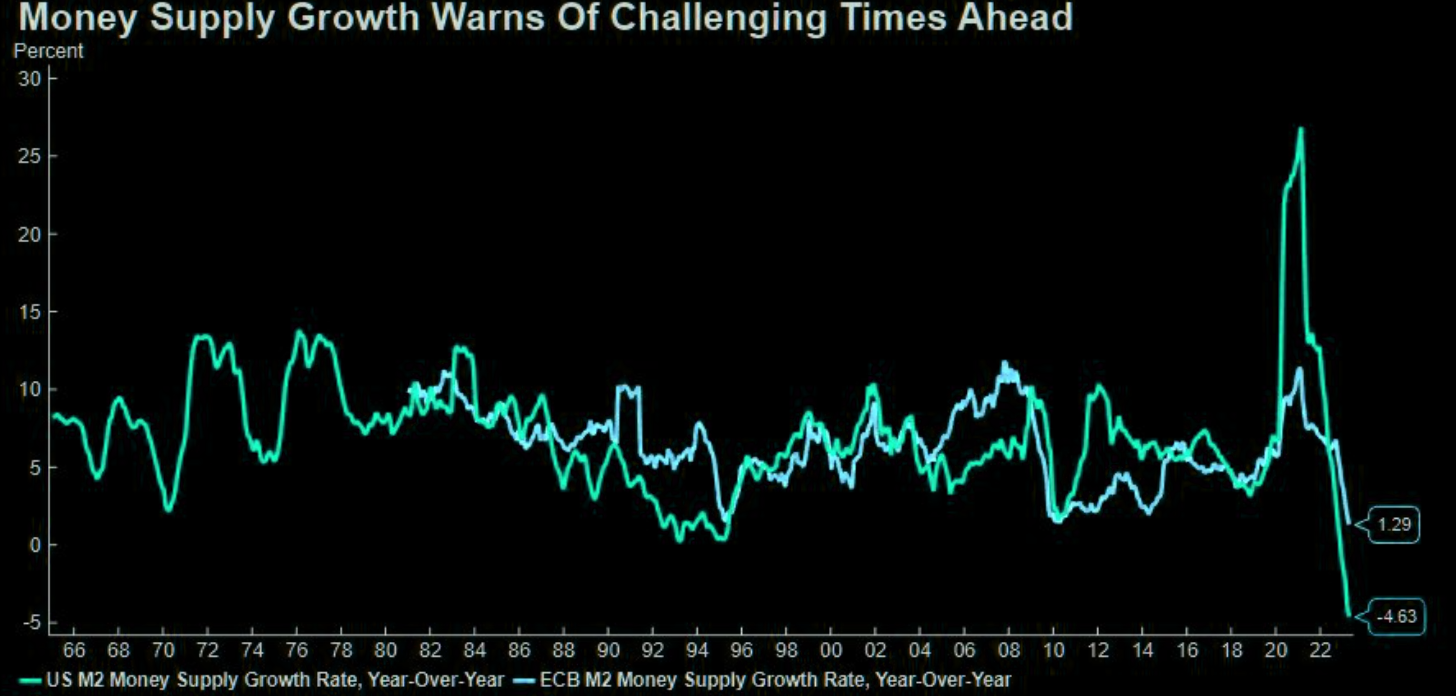
The U.S. money supply, measured by M2, has never contracted as sharply as it has done recently, as you can see from this chart dating back to 1965:
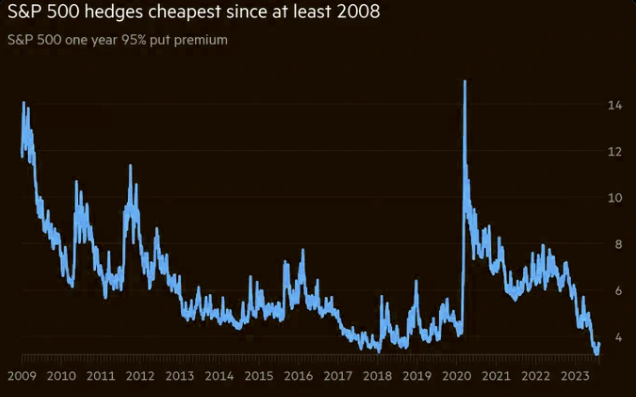
We have also experienced the lowest prices for one-year index put options since these valuations started to be tabulated in 2008:
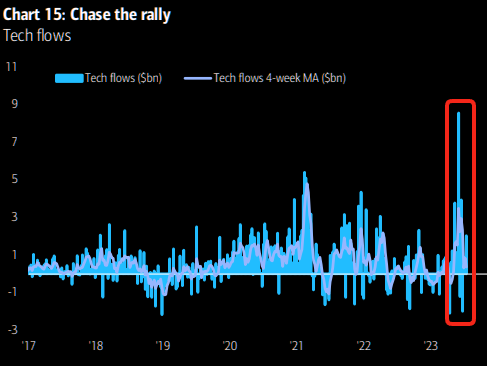
Investors love call options and hate put options at market peaks, while chasing after puts during all bottoming patterns. Meanwhile, most people were so excited about megacap U.S. tech shares in 2021 that total fund inflows exceeded those of 2001 through 2020 combined [not a misprint], but this record was far exceeded by the AI bubble eagerness in 2023:
U.S. equity overvaluations have never been more glaring than they were near their 2021, 2022, and 2023 peaks including July 2023:
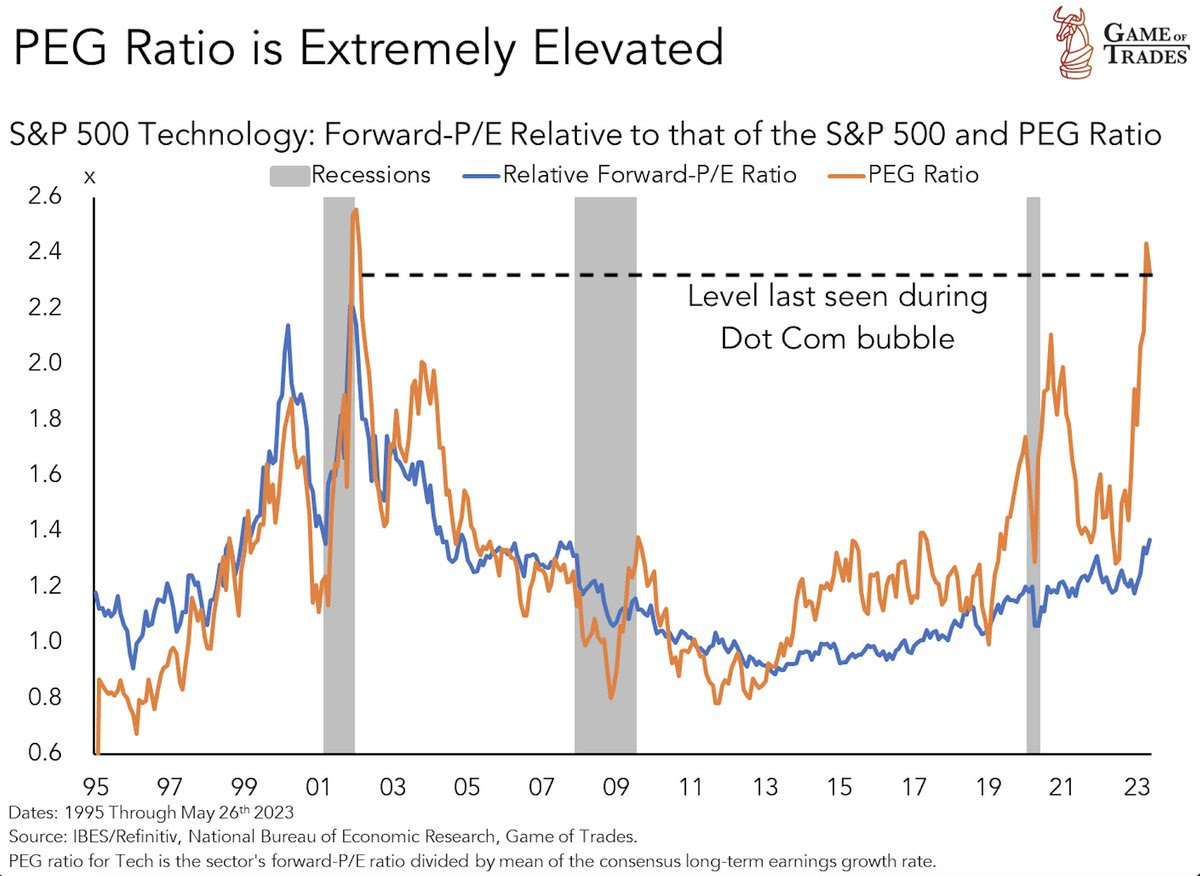
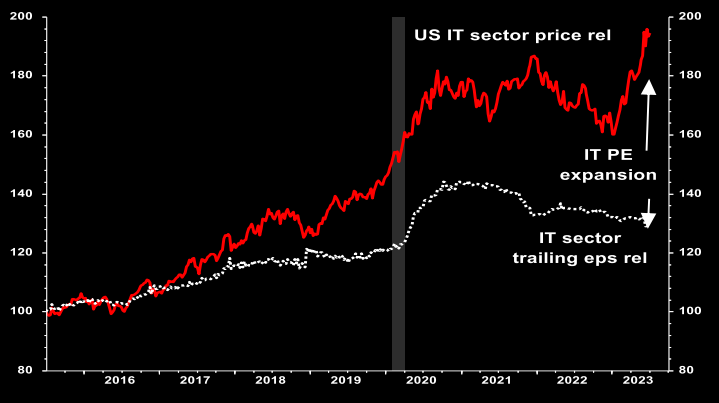
The prices of the most popular technology companies have soared far out of line with their actual earnings:
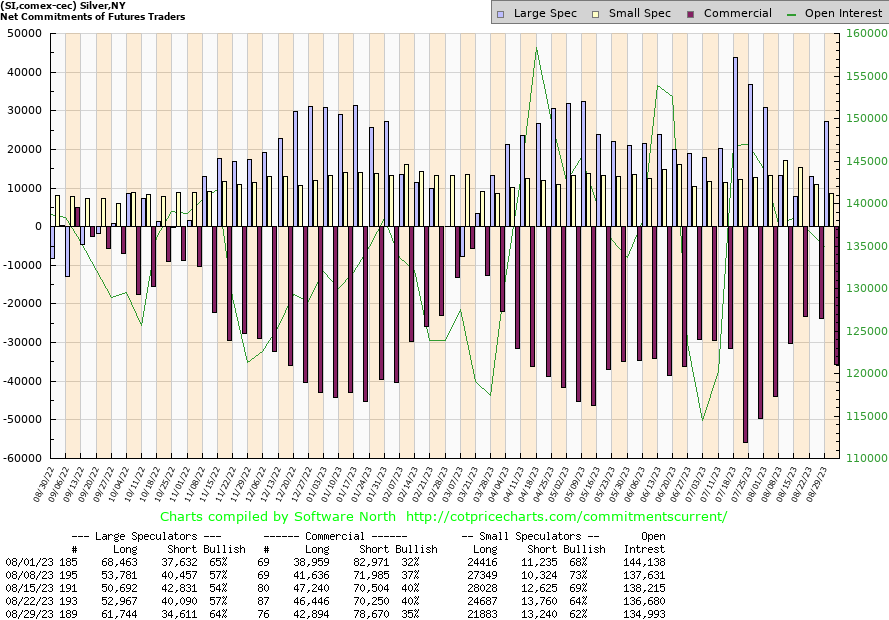
Not all global stock markets are overpriced. U.S. gold mining and silver mining shares and their funds are moving toward undervaluations which could become compelling later in 2023, although silver's traders' commitments warn that it's too early to buy as you can see by comparing the current maroon bars with those from the leftmost part of the following graph in September 2022 which was the last excellent purchase opportunity for precious metals and the shares of their producers:
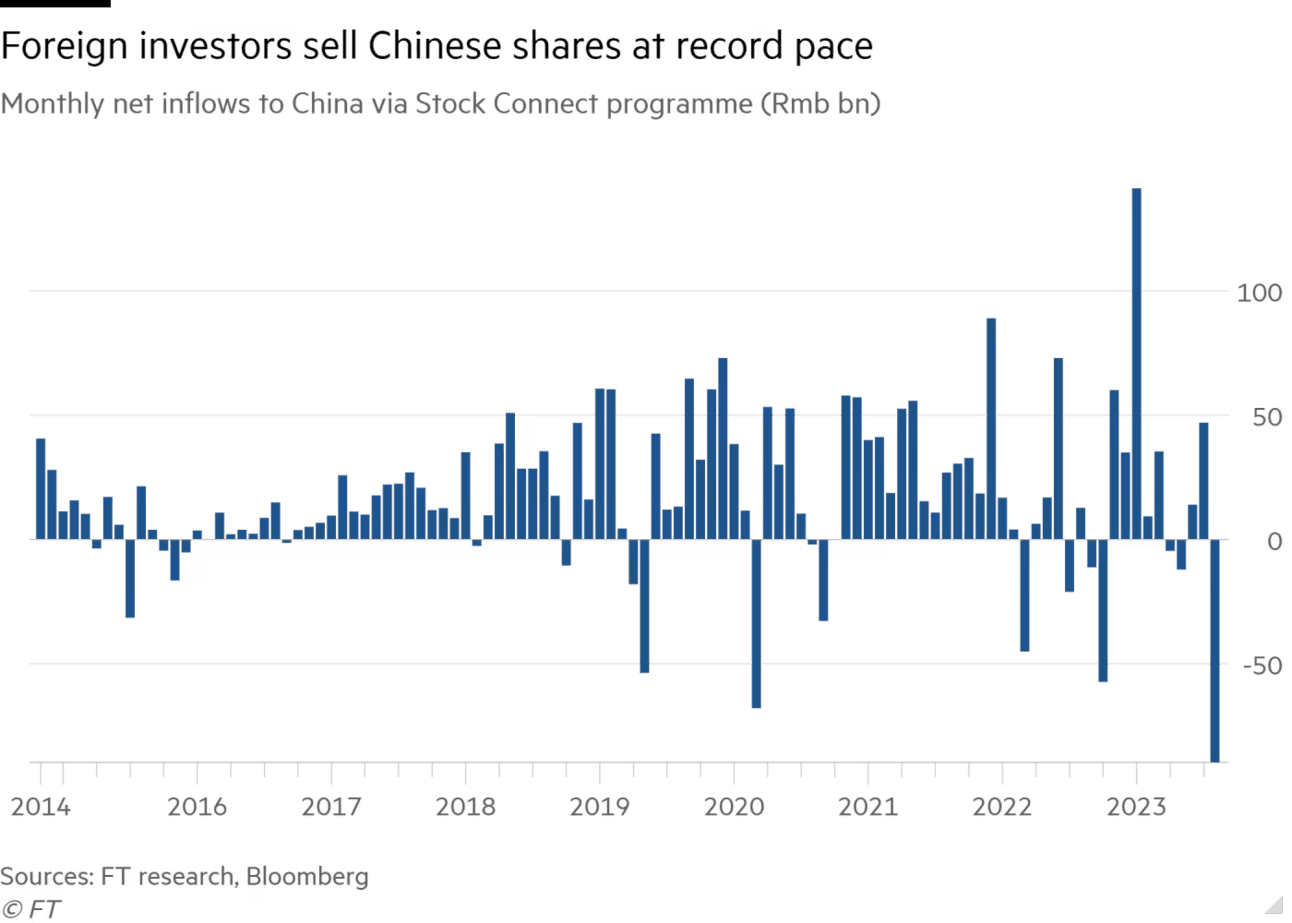
Much-hated Chinese stocks have suffered recent record net outflows and will likely be worth buying sometime during the next several months after U.S. stocks have already been in more pronounced downtrends:
The bottom line: In 2000, 2007, and 2023, we experienced the highest U.S. Treasury yields of each decade when investors were far more eager to own U.S. stocks than they were to be long "boring" U.S. Treasuries. This was followed by losses of more than half for most U.S. equities while those who had bought U.S. Treasuries were rewarded by locking in yields just before they had dropped steeply after both 2000 and 2007. It is more likely that this will occur again this time, rather than less likely, because we have a far greater degree of commercial accumulation of U.S. Treasuries now than we have experienced at any time since 1990. We also have all-time record extremes of U.S. equity call buying, the most undervalued put options, all-time record net equity fund inflows, and the lowest-ever total U.S. dollar amount of insider buying ever recorded during the past three months:
Disclosure of current holdings:
Below is my current asset allocation as of 4:00 p.m. on Monday, August 28, 2023. Each position is listed as its percentage of my total liquid net worth.
I computed the exact totals for each position and grouped these according to sector.
The order is as follows: 1) U.S. government bonds; 2) shorts; 3) bear funds; 4) gold/silver mining; 5) coins; 6) miscellaneous securities.
VMFXX/TIAA(Traditional)bank CDs/FZDXX/FZFXX/SPRXX/SPAXX/Savings/Checking long: 31.83%;
26-Week/17-Week/52-Week/13-Week/2-Year/8-Week/3-Year/5,10-Year TIPS/4-Week/42-Day long: 17.24%;
TLT long: 9.92%;
I Bonds long: 9.53%;
XLK short (all shorts unhedged): 25.15%;
QQQ short: 12.48%;
XLE short: 5.04%;
XLI short: 2.55%;
XLV short: 1.67%;
SMH short: 0.88%;
AAPL short: 0.02%;
SARK long: 1.20%;
PSQ long: 0.01%;
ASA long: 1.26%;
GDXJ long: 0.57%;
GDX long: 0.25%;
BGEIX long: 0.00%;
Gold/silver/platinum coins: 5.69%;
PAK long: 0.03%.
Steven Jon Kaplan runs True Contrarian where this article appeared first.
Source truecontrarian-sjk