

Total Stock Market Index Vs S&P 500: Which is better?


A huge part of almost every equity investor’s portfolio consists of large-cap stocks. But investors also want some exposure to mid-cap and small-cap stocks for better long-term returns. That’s why there is a lot of talk about Total Stock Market Index Funds that cover almost the entire investable US equity market. Many have pitched the Total Stock Market index fund as a superior alternative to the Standard & Poor’s 500. In this S&P 500 (INDEXSP:.INX) vs Total Stock Market index comparison, let’s check out their key differences.
S&P 500 Index Fund Holdings
Almost all major ETF and index fund companies offer products tracking both the S&P 500 and the Total Stock Market index. Both of them are considered “blend” indices, meaning they include growth as well as value stocks.
The Standard & Poor’s 500 index consists of the 500 largest stocks in the US by reference to their market capitalizations. Having 500 stocks in an index fund/ETF offers sufficient diversification. But the index is weighted by market capitalization. It means mega-cap stocks like Apple, Microsoft, Amazon, Alphabet, Facebook, and Berkshire Hathaway account for a large percentage of the index.
The top 10 largest stocks have close to 24% weightage in the S&P 500 index. The remaining 490 or so companies make up about 76% of the index. Fluctuations in the prices of mega-cap stocks have a much bigger impact on the index returns than the ups and downs in smaller stocks.
For a long time, investors have believed that the S&P 500 index captures the core of the US equity markets. Vanguard Group founder Jack Bogle had even argued that the index also provides healthy international diversification because most American corporations generate a large percentage of their revenues from overseas markets. Warren Buffett has also said that investing in the S&P 500 index is good enough for most investors.
Total Stock Market Index Fund Holdings
Proponents of the Total Stock Market index fund model claim that it offers greater diversification than the S&P 500 index fund. These market funds track the broader equity market including the large-cap, mid-cap, small-cap, and micro-cap stocks. That’s a high level of diversification. But we need to dig a little deeper to get a better understanding of the Total Stock Market fund model.
These market funds track the CRSP U.S. Total Market Index, Wilshire 5000 Index or the Russell 3000 Index. Vanguard’s Total Stock Market Exchange Traded Fund (VTI), the world’s largest Total Stock Market ETF, tracks the CRSP U.S. Total Market Index.
Just like the Standard & Poor’s 500, the CRSP U.S. Total Market Index is weighted by market capitalization. As a result, the top 500 largest stocks that constitute the S&P 500 index fund account for nearly 80% of the CRSP U.S. Total Market Index. That’s why the two indices have a high correlation.
The remaining 3,000 or so stocks account for only about 20% of the index. The inclusion of the small-cap and micro-cap stocks in the index makes it slightly riskier, but could also benefit investors in the long run.
S&P 500 vs Total Stock Market Index Fund: Which is better?
The constituents of the S&P 500 index fund make up for close to 80% of the Total Stock Market index fund. In both indices, the largest stocks are responsible for most of the gains or losses. That’s why the two have generated similar performances over the years.
To get a better perspective, let’s compare the returns of Vanguard’s S&P 500 ETF with the same fund house’s Total Stock Market Exchange Traded Fund. They both have the same expense ratio of 0.03%. And they both offer high liquidity and minimal tracking error.
The top 10 largest holdings account for 23.90% of the S&P 500 ETF and 19.90% of the Total Stock Market Exchange Traded Fund. The top ten constituents are also the same.
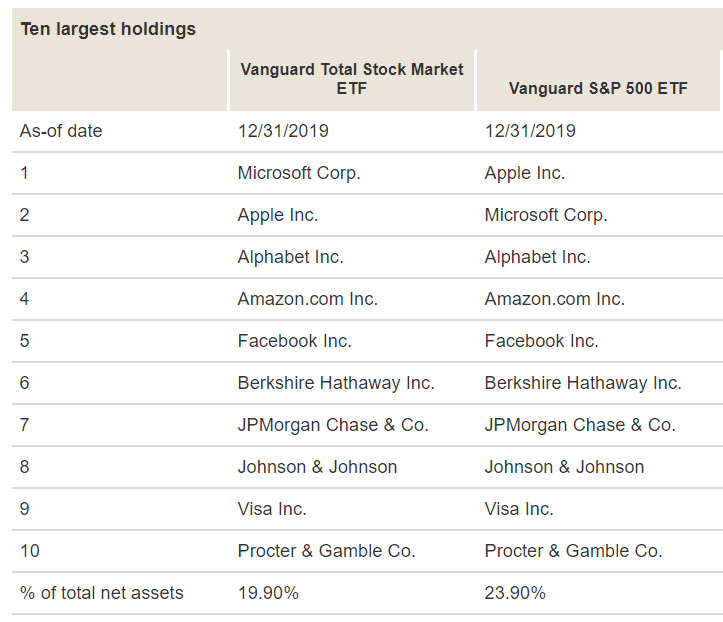
Image source: Vanguard.com (screenshot)
Their returns over the years are also similar (below). The 10-year return data is not available for the Vanguard S&P 500 ETF because the fund was launched in July 2010. It’s not 10 years old yet. For 1-year, 3-year, and 5-year, the returns of the two Exchange Traded Funds are similar.
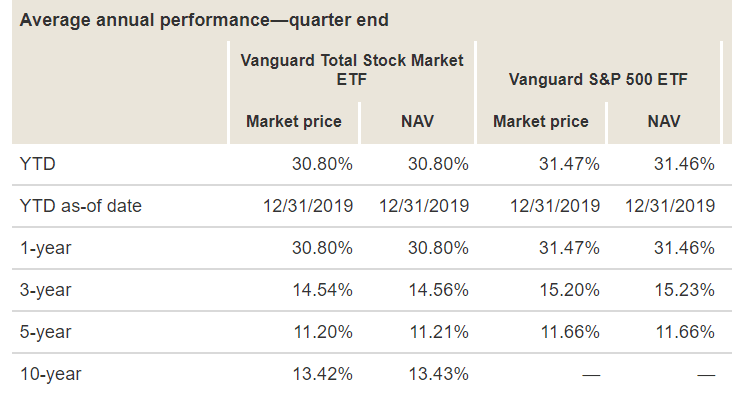
Image source: Vanguard.com (screenshot)
If you think 5-year or 10-year are not long enough time horizons to compare the two indices, the longer history also tells the same story. According to data from MarketWatch, the S&P 500 returned 7.8% annually between 1928 and 1974, compared to 7.3% for the Total Stock Market index. Between 1928 and 2018, the S&P 500 has compounded at 9.7% compared to the TSMI’s 9.5%. Pretty close.
The Sharpe ratio, which reflects the risk-adjusted returns – is also nearly identical for the two indices. The Total Stock Market index gives you a small exposure to mid-cap, small-cap, and micro-cap stocks. But in terms of risk-adjusted returns over the long ter, it’s not significantly better than the S&P 500 index.
Availability of the Index Funds
Investing in these types of assets commonly requires a stockbroker service; these can differ quite significantly in relation to the price and features they offer, as well as in their trading volume within an average 10 day period.
Indubitably, the last thing you want for yourself is to be stuck in a ‘toxic relationship’ with an ETF that has gone downhill.
Why Invest in the S&P 500
Investing in Exchange Traded Funds that follow the Standard & Poor’s 500 Index Fund can bring in a plethora of fiscal benefits for investors. These include: a) increased exposure to a wider range of stocks, b) lower expense industry ratios and c) tax-efficient returns (ETFs).
The S&P 500 is the “gold standard”
The original S&P Index Fund was made up of merely 90 stocks; nowadays that number has skyrocketed to 505. Despite this, the S&P 500 Index Fund has consistently held an average annual return of roughly 10% from the day of its origination (almost 100 years ago).
This has resulted in numerous industry analysts referring to the eminent fund as the ‘gold standard’ of the industry- a testament to its ideal rate of return (ROR) in relation to both: consistency and predictability.
Invest Directly Into a Small-Cap ETF
Investors can easily invest in the S&P 500 by buying an Exchange Traded Fund (ETF) which replicates the performance of the S&P 500 index. These are issued by: iShares, State Street Corporation and The Vanguard Group and work by acquiring the same stocks as the S&P 500 in the same exact quantities.
Why Invest in the Total Stock Market Index Fund
If you want a truly diversified portfolio and you have the risk appetite to invest in mid-cap and small-cap stocks, you can better capture the total stock market index fund by investing in a few index funds/ETFs that separately represent different market segments.
Diversification
For instance, you can invest in the S&P 500 for large-cap exposure, an S&P Midcap 400 fund for mid-cap exposure, and a Russell 2000 fund for small-cap exposure. Depending on your risk appetite, you can have a greater exposure to any of the three segments.
Slightly Higher Long-Term Returns
Data from MarketWatch shows that over the long-term, the small-cap value funds have significantly outperformed both the S&P 500 and the Total Stock Market index, but they also significantly greater risks; this is because their small nature makes it harder to ‘weather any future storms’ that may arise.
It’s important to select the right stock fund based on your risk appetite and needs. But equally important is to stick with your investments over the long-term. Switching funds every now and then could affect your returns.
FAQs
What percentage of total stock market is small cap?
Even though different stock trading companies provide different cut offs between what constitutes a small and large-cap company, the large-gap companies hold a much more prolific individual value in comparison to their small-gap counterparts. For example, the Wilshire 5000 index fund encapsulates over 1,730 small-cap stocks and only 747 large-cap ones, meaning the latter make up roughly 91% of the fund’s total market value.
What percentage of the total market is the S&P 500?
The S&P 500 encompass roughly 80% of the total U.S. stock market.
How many stocks are in the S&P Total Market Index Fund?
The CRSP U.S. Total Market fund consists of a little over 3,550 stocks- much higher than the 505 stocks covered by the S&P 500.
Which S&P 500 ETF is best?
Finding the best ETF for you will be dependent on your relevant capital, experience and stock market portfolio. Laying out a definite ‘best’, therefore, can be quite tricky as it will be dependent on each individual investor.
Quite notably, a variety of different Exchange Traded Funds can provide quite distinct advantages, and consequently before making a decisive choice any investor should ask themselves the following question: what am I looking for? Is it perhaps the highest possible annual returns and optimal asset allocation? Or, maybe, is it a fund with relatively low expenses or a non-existent total minimum investment amount?
Either way, investors undoubtedly have no shortage of options when it comes to S&P 500 ETFs.
Conclusion
We can therefore see that the S&P 500 Index Fund is only marginally less diverse than its Total Stock Market Index counterpart. As mentioned above, this is because both index fund’s values are predominantly made up of large-cap stocks, and consequently their stock market performance correlates significantly.
The post Total Stock Market Index Vs S&P 500: Which is better? appeared first on ValueWalk.
Source valuewalk