

"The near absence of bargains works as a reverse indicator for us. When we find there is little worth buying, we find there is probably much worth selling." --Seth A. Klarman

Budding Bursting Bubbles

BUDDING BURSTING BUBBLES (November 12, 2023): Investors are easily impressed by large percentage moves, while barely noticing important asset behavior. Therefore, since the total losses so far for major U.S. large-cap equity indices including the S 500, Nasdaq, and QQQ have been modest so far, most people aren't concerned about whether or not we are in a primary bear market. The total declines overall are generally less than 10% from their peaks in November 2021 or early January 2022. U.S. real estate overall also has mostly single-digit percentage declines. Therefore, the fact that most of the above and other indices have experienced numerous lower highs over the past two years isn't appreciated even with the bearish implications of this activity in prior decades. Small- and mid-cap U.S. equity indices and funds have almost all suffered larger percentage losses, but hardly anyone pays attention to the Russell 2000 and similar benchmarks.
Therefore, even though the U.S. equity bear market is roughly half over timewise, and is probably entering its most dangerous downside phases, most investors are blissfully complacent. This is evident from VIX closing at 14.17 on Friday, November 10, 2023, an astonishingly low level two years into a bear market. Hardly anyone thinks they need protection or hedging against potential upcoming losses. Boglehead myths are widely prevalent with many such investors convinced that they have a divine right to come out ahead in the long run no matter how overvalued the assets are which they own.
Investors can get 5.5% guaranteed by the U.S. government with zero state and local income taxes, making the U.S. stock market much more overpriced than it had been two years ago.
One plausible reason for U.S. equities reaching all-time record overvaluations in November 2021 was that the 26-week U.S. Treasury bill had been yielding less than 0.1%. Currently it is yielding just about exactly 5.5%. This means that investors can obtain this kind of annualized gain with zero risk. Especially with the spread between the 13-week and the 10-year U.S. Treasuries reaching an all-time record going back to 1789, this makes U.S. stocks even more dangerously overpriced relative to U.S. Treasury bills and with far greater downside risk. Investors are so concerned about "missing out" on potential upside that they're unaware of the likelihood of losing more than half of their money. No one can say how far any asset will decline during a bear market, but if QQQ declines as much in 2023-2025 as it had done from its March 10, 2000 zenith to its October 10, 2002 nadir then those who currently hold QQQ and similar assets will lose more than 80% of their current valuation. This includes reinvested dividends and is even without adjusting for inflation.
There are two major consequences of the longest-ever U.S. equity bull market.
The U.S. equity bull market which began in March 2009 lasted longer than any other bull market in U.S. history. Whenever anything persists for such a lengthy period of time, investors psychologically don't believe that anything which had happened in prior decades has any significance. It has been so long since we had suffered the previous severe bear market that hardly anyone can imagine a significant percentage decline. This is similar to how hardly anyone two years ago thought that inflation could reoccur, since it had been such a long time since we had experienced surging inflation. Paradoxically, if some investors think about selling and then prices climb even higher, they congratulate themselves for not selling "too soon" and become even less likely to sell the higher that prices are rising. Insiders are an important exception, demonstrating their highest-ever overall ratios of insider selling to insider buying since early 2021 and only behaving otherwise during the final four months of 2022.
Besides investors being emotionally far too distant from the previous two true bear markets of 2000-2002 and 2007-2009 to believe that a third such decline could be underway, the duration of any bear market tends to be proportional to the bull market which precedes it. In general, a bear market will last roughly one-third as long as its prior bull market. Since the U.S. equity bull market which started in March 6-9, 2009 lasted for almost thirteen years, the current U.S. equity bear market will probably last for roughly four years which means that it won't likely be completed until around the end of 2025. This relatively leisurely pace has fooled many investors into believing either that the bear market "is over" or that we might experience one more moderate correction, rather than the far greater likelihood of two upcoming crushing down years which overall become progressively more dramatic.
The biggest losses will generally be suffered by the best-known shares.
U.S. equity overvaluations are far more pronounced and out of line with corporate profit growth for the best-known and largest U.S. companies, especially those which had generated a high level of excitement from the AI bubble and excitement over other modern technology. Nearly all of the 2023 gains for major U.S. large-cap equity indices were achieved by a surprisingly small number of trendy stocks. A company with an annualized profit growth averaging about 10% cannot maintain a price-earnings ratio near 40 regardless of what is happening with the economy, how inverted the U.S. Treasury curve happens to be, or what is occurring with the U.S. dollar. Momentum can sometimes seem to prevail for awhile, but eventually a regression toward the mean and beyond to a nearly opposite extreme of undervaluation must happen sooner or later.
The strongest proof of the unsustainability of the current situation is the irrationality of investors' attitudes toward any given company.
Perhaps you are thinking to yourself: maybe it makes sense for a company like Microsoft to have a price-earnings ratio which is four times its profit growth, since AI will allegedly cause its profits to quadruple. You can believe in such foolish fantasies, but consider that the corporate bonds of the most popular large-cap companies have been among the biggest losers over the past few years while the stocks of the same companies have been among the biggest winners. If a particular company is really going to outperform with its fundamentals then its bonds should also be outperforming along with its stocks. What is really happening is that investors have been crowding more and more aggressively into the biggest percentage winners while piling out of the biggest percentage losers, regardless of their merit. This has caused closed-end bond funds including "boring" municipal bonds to experience some of their highest-ever historic discounts, while anything related to AI has enjoyed some of the biggest gains regardless of whether new technology will ever get around to increasing these companies' profitability.
The U.S. economy is behaving like a trip on the planet Mercury.
Unlike Earth, the planet Mercury doesn't rotate. It maintains the same side toward the sun at all times. This side is incredibly hot, while the dark side which faces away from the sun is incredibly cold. If you are on the planet and you decide to pass from the scorching to the frigid side, you will briefly pass through a region where the temperature is just about right for human habitation. This is similar to what is happening with the U.S. economy: it is going from an overheated state with very low unemployment and bloated inflation, just like 1929-1930, 1972-1973, 1999-2000, and 2007-2008, to a period of serious recession, high unemployment, sharply diminished inflation, and depressed asset prices. 2025 is going to be very similar to 1932, 1974, 2002, and 2008, with stocks bottoming during or shortly after each of those years and real estate following roughly one year later.
Real U.S. equity bear markets always end with sizable undervaluations, heavy net investor outflows, intense insider buying by top executives, and pervasive media gloom. We are nowhere near any of the above.
At the end of any bear market, whether for stocks or real estate, we usually have an average of a 20% discount to fair value for real estate and a 40% discount to fair value for the U.S. stock market. We will have a multi-decade high for insider buying, exaggerated ratios of insider buying relative to insider selling, all-time record net outflows by investors who are finally panicking after losing more than half of their money, and day after day of negative media commentary about the economy and the markets. Until all of the above actually happen we can be certain that much greater downside for the U.S. stock market lies ahead.
The excuses change through the ages but the results are identical.
During the 1800s investors said that because of progress, canals, or railroads, the old valuation rules were no longer relevant. In the 1900s industrialization, computers, and at the turn of the century the invention of the internet convinced many that price-earnings and price-to-book measures were no longer relevant in the "modern age." Today you hear a lot about how AI has "permanently" changed the situation or how the Fed will ensure that valuations remain far above average indefinitely.
It's not different this time.
I have been gradually adjusting my mix of assets as I always do in order to respond to changing circumstances and multi-decade extremes, and I have general plans for the next several months.
As TLT and the actual 20-year U.S. Treasury both fell to their lowest valuations since 2004, I had been gradually purchasing them into weakness through October 2023. Related assets including closed-end bond funds like PMM slid to even deeper average bargains which hadn't been experienced generally since 2000, so I had gradually bought them also. More recently I have been adding to my short position in QQQ and related shares as they complete additional lower highs and haven't dropped much overall from their respective peaks from November 2021. I had been selling short large-cap energy shares and their funds including XLE at each of their peaks since November 2022 including September 2023. The Japanese yen slid to its lowest point since July-August 1990 making FXY a worthwhile bargain.
During the next several months I expect to be covering some or all of my short positions whenever QQQ experiences dramatic weakness such as a loss of about half from its current price. The next major purchase I think will be likely will be buying gold mining and silver mining shares through funds including GDXJ, although the traders' commitments demonstrate clearly that it is still too early to be doing so. Most likely gold bullion will drop below 1800 U.S. dollars per troy ounce sooner or later to provide the next buying opportunity in this sector.
The following charts highlight recent multi-decade extremes:
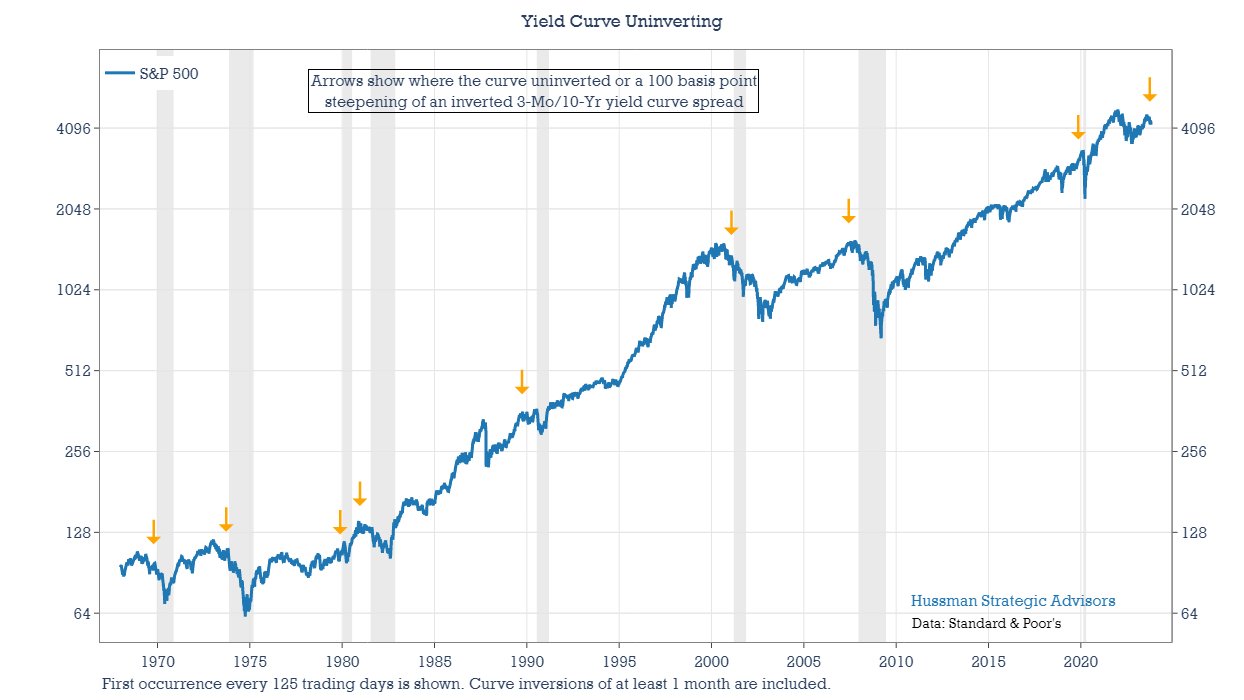


The bottom line: We have numerous nearly simultaneous multi-decade extremes in the global financial markets which sooner or later will all regress toward the mean and beyond to nearly opposite extremes within two or three years. This is likely to lead to an additional loss of 80% for QQQ and AI bubble stocks, roughly double the current valuations for TLT and the 20-year U.S. Treasury bond, much higher valuations for most closed-end government bond funds and the Japanese yen, and losses of about half on average for real estate around the world. The alternative is a simple one: put your money into U.S. Treasuries which mature within a couple of years and are paying up to 5.5% with both interest and principal guaranteed along with being exempt from state and local income taxes.
Disclosure of current holdings:
Below is my current asset allocation as of 4:00 p.m. on Friday, November 10, 2023. Each position is listed as its percentage of my total liquid net worth.
I computed the exact totals for each position and grouped these according to sector.
The order is as follows: 1) U.S. government bonds; 2) shorts; 3) bear funds; 4) gold/silver mining; 5) coins; 6) miscellaneous securities.
VMFXX/TIAA(Traditional)bank CDs/FZDXX/FZFXX/SPRXX/SPAXX/Savings/Checking long: 35.67%;
26-Week/17-Week/52-Week/13-Week/2-Year/8-Week/3-Year/5,10-Year TIPS/4-Week/42-Day long: 19.28%;
TLT long: 10.35%;
I Bonds long: 9.88%;
PMM long: 0.01%;
XLK short (all shorts once again unhedged): 26.54%;
QQQ short: 14.17%;
XLE short: 5.06%;
XLI short: 2.51%;
XLV short: 1.58%;
SMH short: 0.92%;
AAPL short: 0.02%;
SARK long: 1.22%;
PSQ long: 0.02%;
GDXJ long: 0.53% (fully hedged with out-of-the-money covered calls);
GDX long: 0.24%;
PALL long: 0.15%;
ASA long: 0.09%;
Gold/silver/platinum coins: 5.92%;
FXY long: 0.15%;
PAK long: 0.03%.
Steven Jon Kaplan runs True Contrarian where this article appeared first.
Source truecontrarian-sjk
Microsoft Corp. Stock
The stock is one of the favorites of our community with 100 Buy predictions and 2 Sell predictions.
With a target price of 406 € there is a slightly positive potential of 6.93% for Microsoft Corp. compared to the current price of 379.7 €.