

Gold: Lose A Battle To Win The War

Gold scored some victories over the past days, but it’s playing a risky game. One misstep and the yellow metal might lose the war.

Q1 2021 hedge fund letters, conferences and more
Sometimes, a good strategist needs to give up a few battles to eventually win the war. Or, at least, convince their enemy that they’re defeated while preparing a counterattack. Just the same, a chess player may need to sacrifice a piece in order to checkmate a king. Sun Tzu has spoken, and the Art of War translates well here.
In the world of trading, the same rules often apply. A good investor needs to give up a few unfavorable days to eventually score a final victory. Again, controlling one’s emotions and adhering to patience are key. These principles are important when waiting out gold’s temporary upswings in a medium-term downswing, and also when waiting for gold’s eventual ascent. Don’t let short-term intraday moves cloud your vision.
Yesterday (May 11), I wrote that the rally in gold and stocks might have just burnt itself out, and the markets didn’t wait long to agree with me.
Is it 100% certain that the top is in? Absolutely not, as there are no certainties in any market, and sound position management should be utilized at all times. But based on what happened yesterday, and what we saw in today’s pre-market trading, the odds that the corrective top is already in have greatly increased.
Let’s take a look at the charts for details, starting with the stock market .
The Influence of the Stock Market
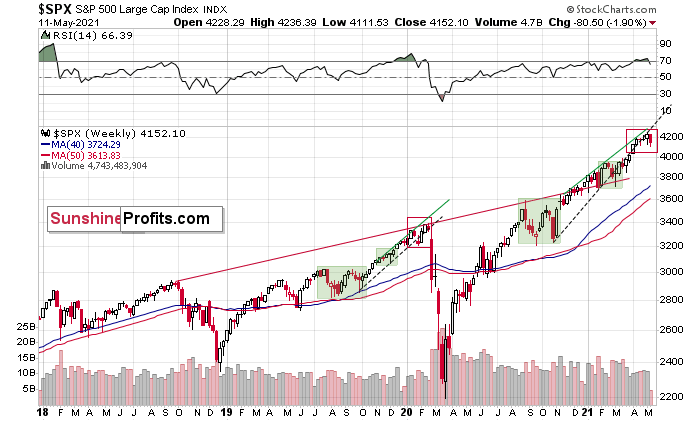
The markets are self-similar (which is another way of saying that they have a fractal nature), which generally means that while the history tends to rhyme, it also tends to rhyme in similar shapes of alike or various sizes.
For example, the rally from 2018–2020 seems very similar to the rally from 2020 to the present.
Both rallies started after a sharp decline, and the first notable correction took the form of back-and-forth trading around the previous high. I marked those situations with green rectangles.
Then the rally continued with relatively small week-to-week volatility. I created rising support lines based on the final low of the broad short-term consolidation and the first notable short-term bottom.
This line was broken, and some back-and-forth trading followed, but it was only about half of the previous correction in terms of price and time.
Then, we saw a sharp rally that then leveled off. And that was the top . The thing that confirmed the top was the visible breakdown below the rising support line right after stocks invalidated a tiny breakout to new highs. That’s what happened in February 2020, and that’s what happened this month.
Combining this with the recent underperformance of the NASDAQ (the previous leader which just moved to new monthly lows) suggests that this might have indeed been the top.
“But why didn’t the mining stocks or silver end yesterday’s session higher given the above, and the fact that stocks declined yesterday? Any tips on that?”
I see two likely reasons.
One is that the stock market reversed before the end of the day, so many investors and traders might have thought that the correction was already over, and they were eager to jump back into the market. This would explain why mining stocks (and GameStop) ended yesterday’s session higher.
The second reason is that miners don’t necessarily slide right after the top. Sometimes, they tend to move back and forth, testing the previous high (on lower volume).
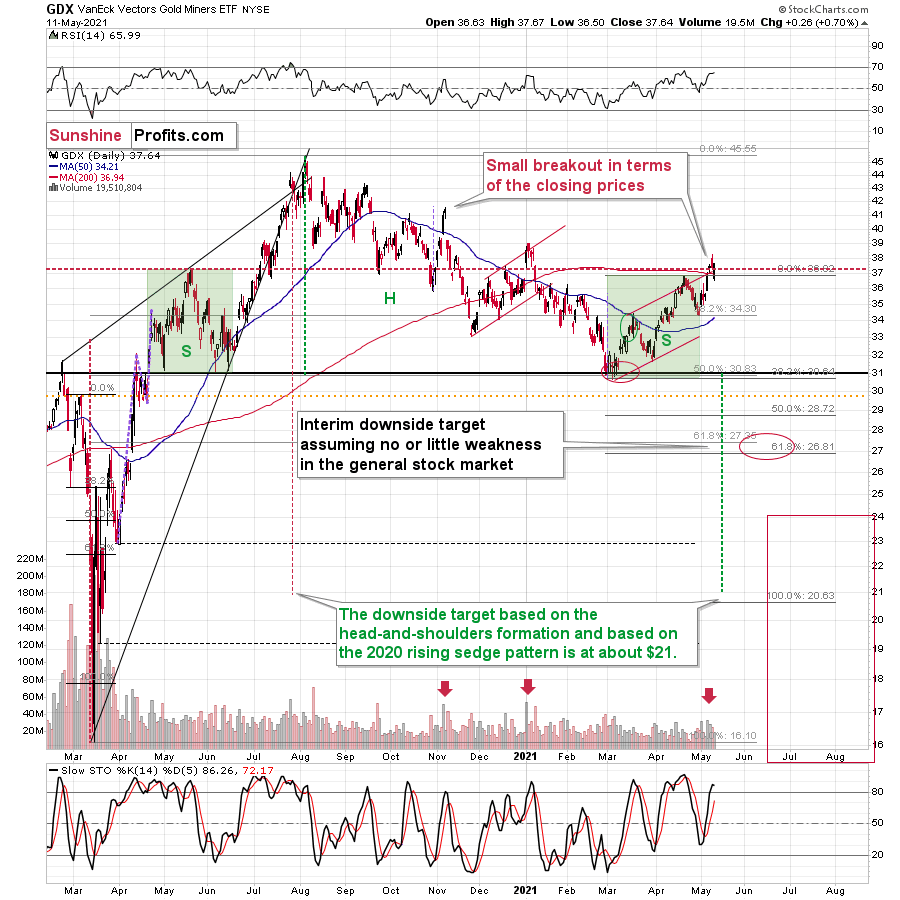
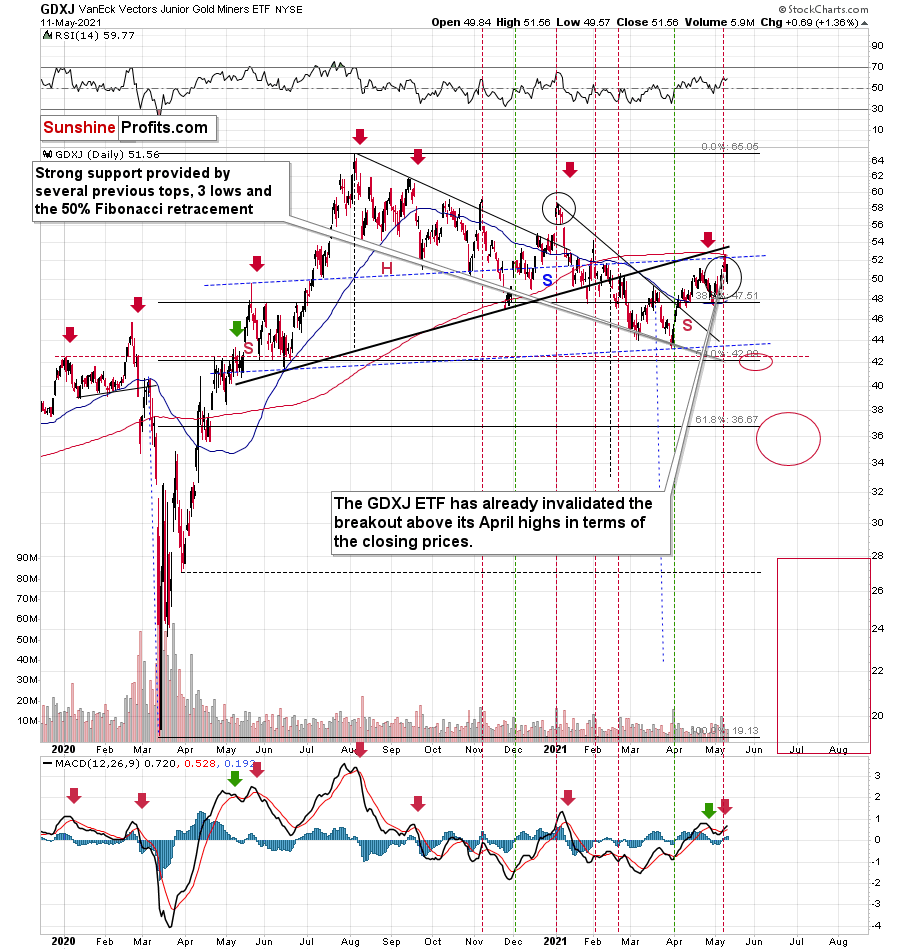
That’s what happened in early January 2021, and that’s what happened yesterday. Did it change anything with regard to the bearish implications of the current situation? Not at all. Besides, the most bearish thing about gold stocks is visible on the long-term HUI Index chart.
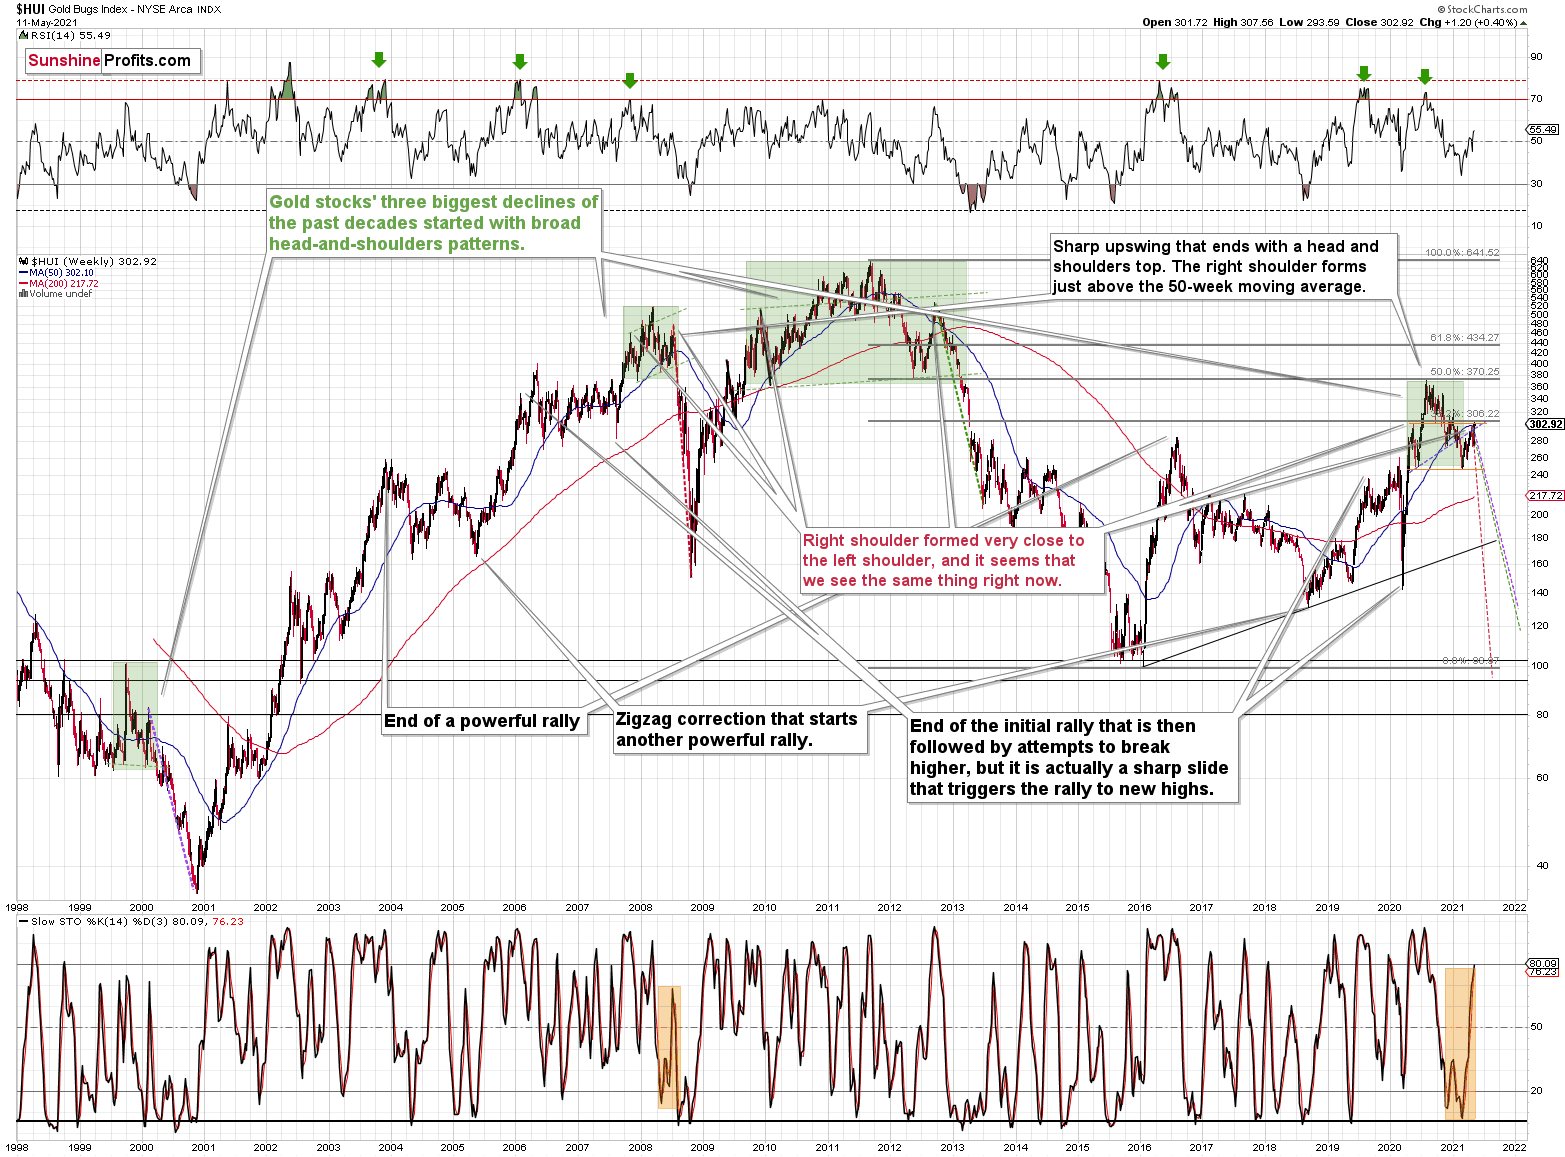
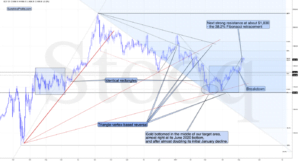
The HUI Index
While corrective short-term upswings within a medium-term downtrend can feel discouraging, it’s important to remember that similar instances occurred in 2008 and 2012. And to some extent also in early 2000.
The head and shoulders patterns from 2007 – 2008 and from 2009 – 2012 had the final tops – the right shoulders – very close to the price where the left shoulders topped. And in early 2020, the left shoulder topped at 303.02.
This week’s intraday high in the HUI Index was 307.56, and yesterday’s closing price (the highest closing price we saw recently) was 302.92. That’s one-tenth of an index point away from the left shoulder’s top; if the HUI slides from here – which seems likely – we’ll have a near-perfectly symmetrical H&S pattern with very bearish implications for the following weeks and months.
I previously wrote that “it wouldn’t be surprising to see a move to about 300 in the HUI Index”. And that’s exactly what we saw. To clarify, one head-and-shoulders pattern – with a rising neckline – was already completed, and one head-and-shoulders pattern – with a horizontal neckline – is being completed, but we’ll have the confirmation once miners break to new yearly lows.
Consequently, the recent rally is not a game-changer, but rather a part of a long-term pattern that’s not visible when one focuses on the short term only.
Let’s get back to the broader tops for a while.

Gold, Its Battles and the War
In August 2020 – at the top – gold’s peak was forming over approximately 4 trading days, and it plunged on the fifth day.
At the beginning of this year – at the yearly top – gold was peaking for 2-4 trading days (depending on how one treats the initial daily decline that was then followed by a small corrective upswing) and it plunged on the fifth day.
Today is the fourth day of what is likely to become a topping pattern (we will know for sure only after gold slides). Consequently, the fact that gold didn’t slide profoundly yesterday (except for the intraday decline) is not odd at all. Conversely, it’s in tune with the previous topping patterns.
Moreover, please note that since gold is repeating (to some extent) its 2011-2013 performance (actually, more of an average of gold’s trading performances from the above period and from 2008), it’s particularly normal for it to form a broader top here.
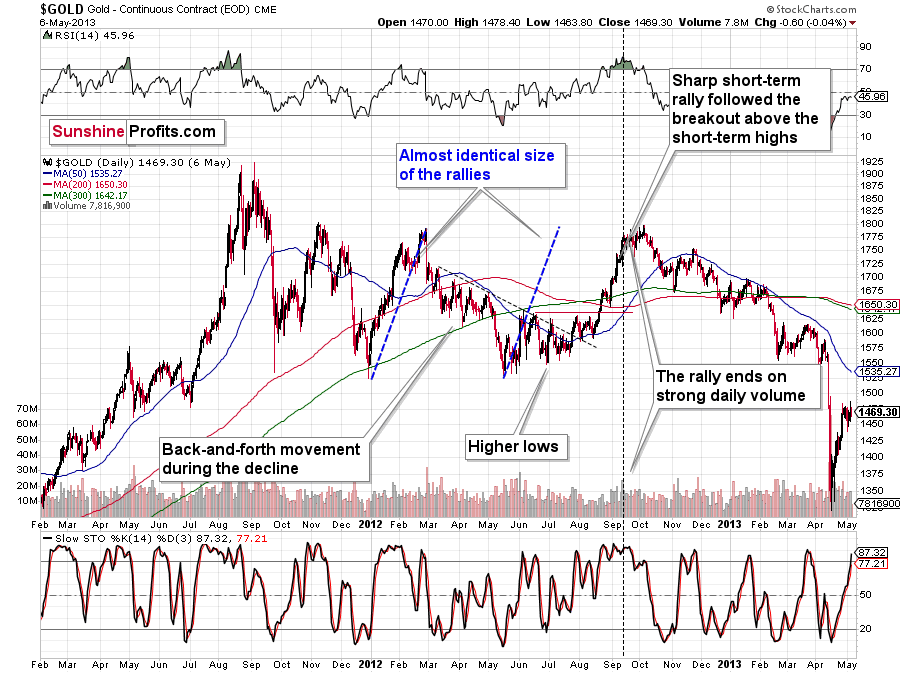
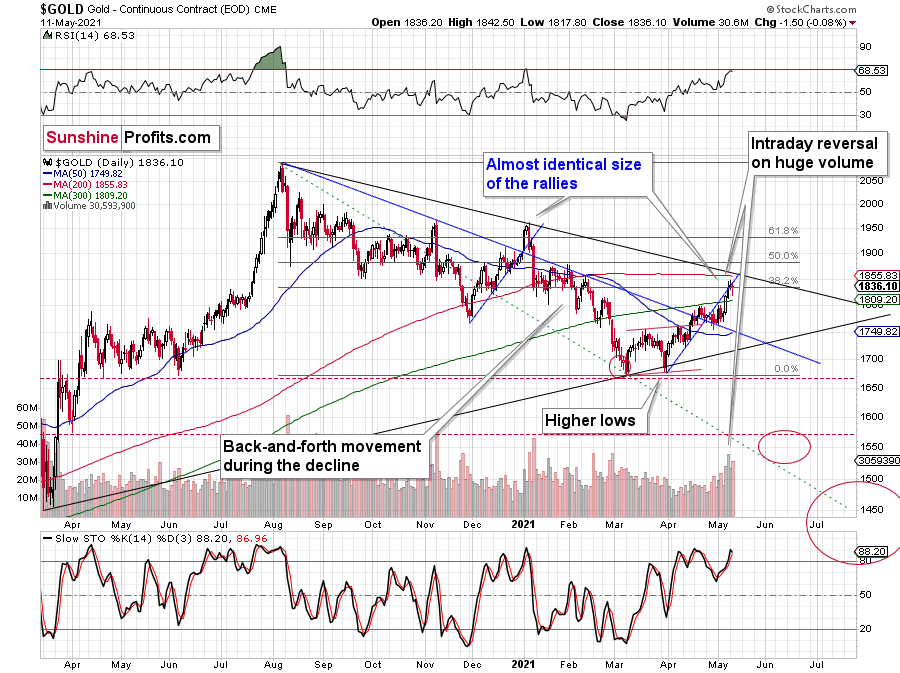
I previously wrote that the situation is similar to 2008 in a way and to 2012-2013 in a slightly different way. When I’m looking at it now, it’s quite normal that the gold market is mixing both previous performances. But it’s always easy to see things with the benefit of hindsight.
In 2008, before the final slide, we had clearly lower lows as well as lower highs. During the 2012-2013 consolidation we had a more or less horizontal pattern that was then followed by the final slide. Right now, we have something in between – we have lower highs and lower lows, but it’s not as clear as it was in 2008.
Back in 2008, it took gold 29 weeks to move from the initial (March 2008) top to the final (October 2008) top.
Back in 2011-2013, it took gold 55 weeks to move from the initial (September 2011) top to the final (October 2013) top.
The arithmetic average of the above is 42 weeks, and last week was the 39 th week after the August 2020 top. If gold stops here or shortly, it will be almost right in the middle of the similarity between both periods.
Consequently, the way gold and mining stocks are performing now is perfectly normal for a medium-term decline – it’s not a game-changer. The medium-term forecast for gold remains bearish.
What’s Going on With the Euro?
Let’s get back to the issue of head and shoulders patterns – this time in the context of the currency markets.
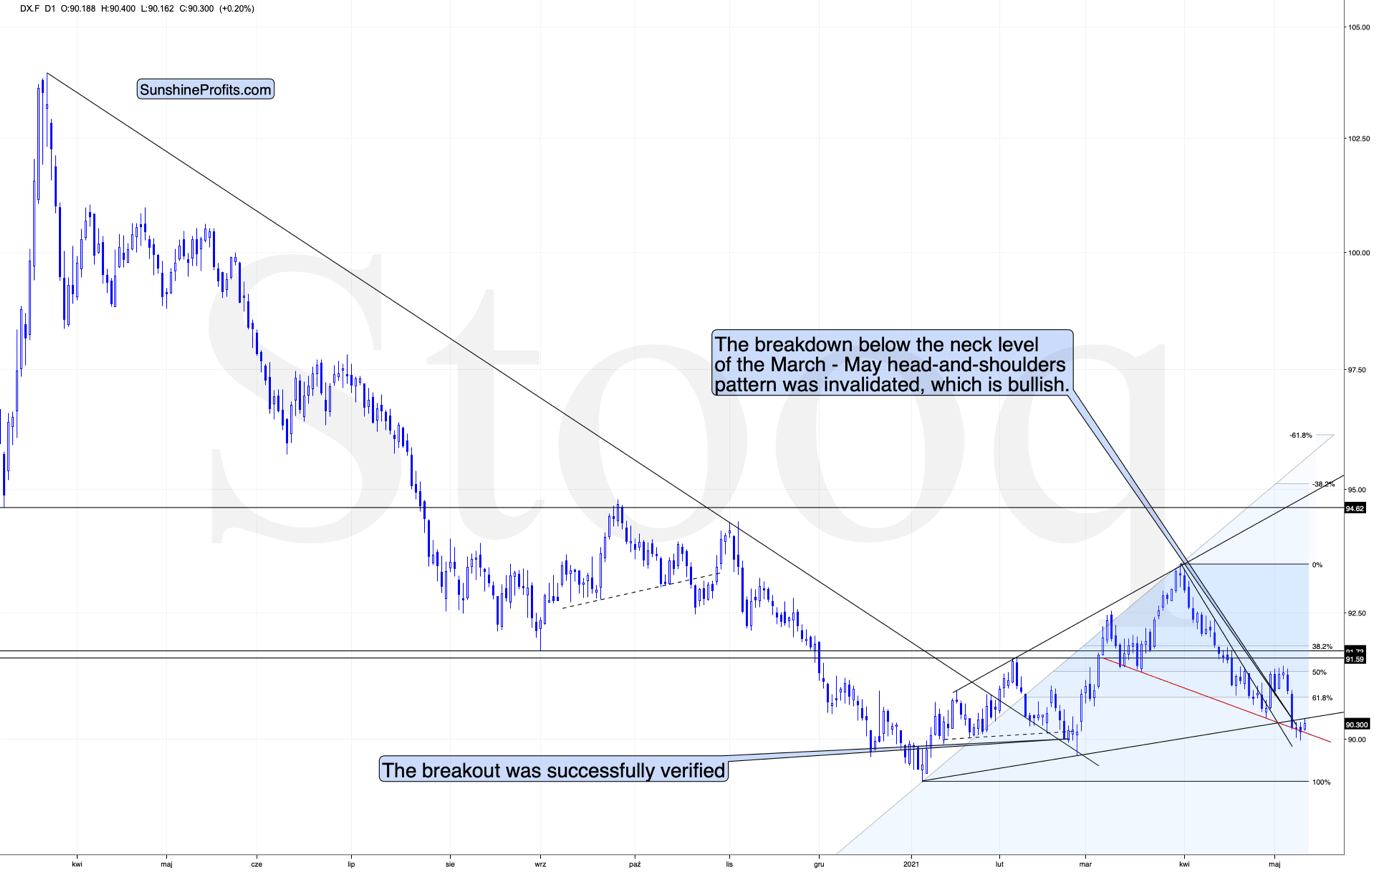
What one might not notice at first sight, but what is very important, the USD Index just invalidated a small breakdown below the head-and-shoulders pattern, and it rallied back above its neckline. This is a classic buy sign and a sign that the breakdown below the rising support line will be invalidated shortly.
There’s also a potential head and shoulders pattern present in the euro.
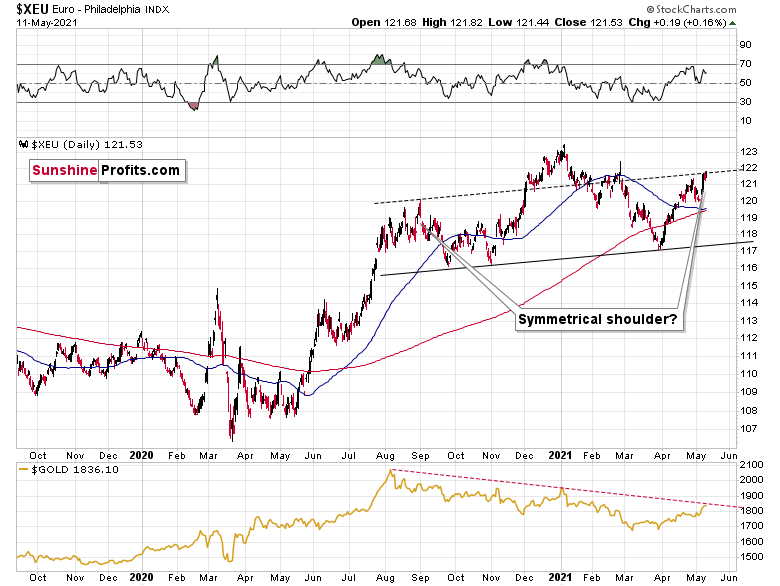
The European currency moved to the line that’s parallel to the rising neck level of the potential head and shoulders pattern. If it now declines and moves to new yearly lows, the situation will be extremely bearish – what is more, not only for the euro but also for the precious metals market, which tends to move in tune with the dollar competitor.
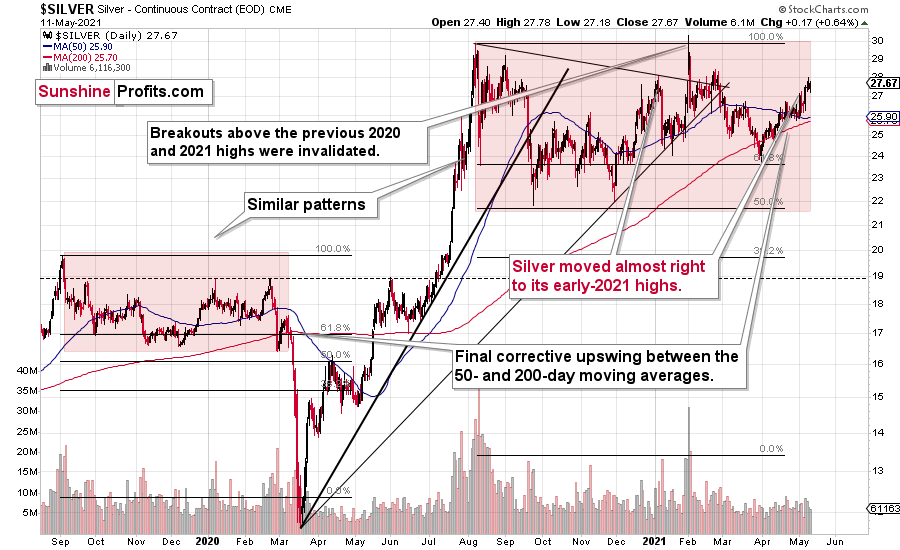
As far as silver is concerned, there’s not much new to report – my forecast for silver hasn’t become more bullish recently. The white metal continues to repeat its 2019-2020 performance, and it’s after a short-term period of outperformance relative to gold, which indicates major tops. Unlike gold or mining stocks, silver recently moved to its early-2021 high.
Interestingly, please note that silver is repeating more or less the same pattern from the past that the general stock market does. And we all know what happened to silver (and mining stocks) when the general stock market plunged in March 2020.
Thank you for reading our free analysis today. Please note that the above is just a small fraction of today’s all-encompassing Gold & Silver Trading Alert. The latter includes multiple premium details such as the targets for gold and mining stocks that could be reached in the next few weeks. If you’d like to read those premium details, we have good news for you. As soon as you sign up for our free gold newsletter, you’ll get a free 7-day no-obligation trial access to our premium Gold & Silver Trading Alerts. It’s really free – sign up today.
Przemyslaw Radomski, CFA
Founder, Editor-in-chief
Sunshine Profits: Effective Investment through Diligence & Care
All essays, research and information found above represent analyses and opinions of Przemyslaw Radomski, CFA and Sunshine Profits' associates only. As such, it may prove wrong and be subject to change without notice. Opinions and analyses are based on data available to authors of respective essays at the time of writing. Although the information provided above is based on careful research and sources that are deemed to be accurate, Przemyslaw Radomski, CFA and his associates do not guarantee the accuracy or thoroughness of the data or information reported. The opinions published above are neither an offer nor a recommendation to purchase or sell any securities. Mr. Radomski is not a Registered Securities Advisor. By reading Przemyslaw Radomski's, CFA reports you fully agree that he will not be held responsible or liable for any decisions you make regarding any information provided in these reports. Investing, trading and speculation in any financial markets may involve high risk of loss. Przemyslaw Radomski, CFA, Sunshine Profits' employees and affiliates as well as members of their families may have a short or long position in any securities, including those mentioned in any of the reports or essays, and may make additional purchases and/or sales of those securities without notice.
The post Gold: Lose A Battle To Win The War appeared first on ValueWalk.
Source valuewalk