

Federal Reserve’s Liquidity Circus And Gold
Fed pumped so much money into the financial system, that the latter started sending it back. How will this and Fed’s more hawkish tone impact gold?

Q1 2021 hedge fund letters, conferences and more
The Fed Remains On Autopilot
With Jerome Powell, Chairman of the U.S. Federal Reserve (FED), testifying before Congress on Jun. 22, his prepared remarks signaled that the FED remains on autopilot. Despite saying that “job gains should pick up in coming months as vaccinations rise,” he added that “we at the FED will do everything we can to support the economy for as long as it takes to complete the recovery.”
And while Powell supported our thesis by saying that “labor demand is remarkably strong and over time we will find ourselves with low unemployment and wages going up across the spectrum,” when asked if inflation is transitory, he responded:
“[Perhaps] all of the overshoot in inflation comes from categories such as rising used car and trucks, airplane tickets, hotel prices that have been affected by the reopening of the economy. [And while] these effects have turned out to be larger than we expected , the incoming data are consistent with the view that these factors will wane over time .” For context, of course inflationary pressures will “wane over time.” That’s not up for debate. However, “when” is the key question.
But in a bid to remove any doubt, he added:
"We will not raise interest rates preemptively because we fear the possible onset of inflation. We will wait for evidence of actual inflation or other imbalances."
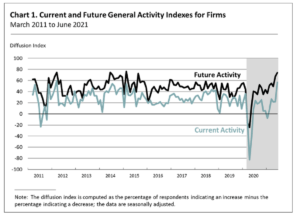
Thus, while investors clearly cheered the FED Chair’s dovish sentiment on Jun. 22, Powell (for better or worse) still remains out of touch with reality. Case in point: the Philadelphia FED released its Nonmanufacturing Business Outlook Survey on Jun. 22. And while “the full-time employment index fell 20 points to 4.3 in June after rising 17 points last month,” the report revealed that “both future activity indexes suggest that the respondents expect overall improvement in nonmanufacturing activity over the next six months.”
Please see below:
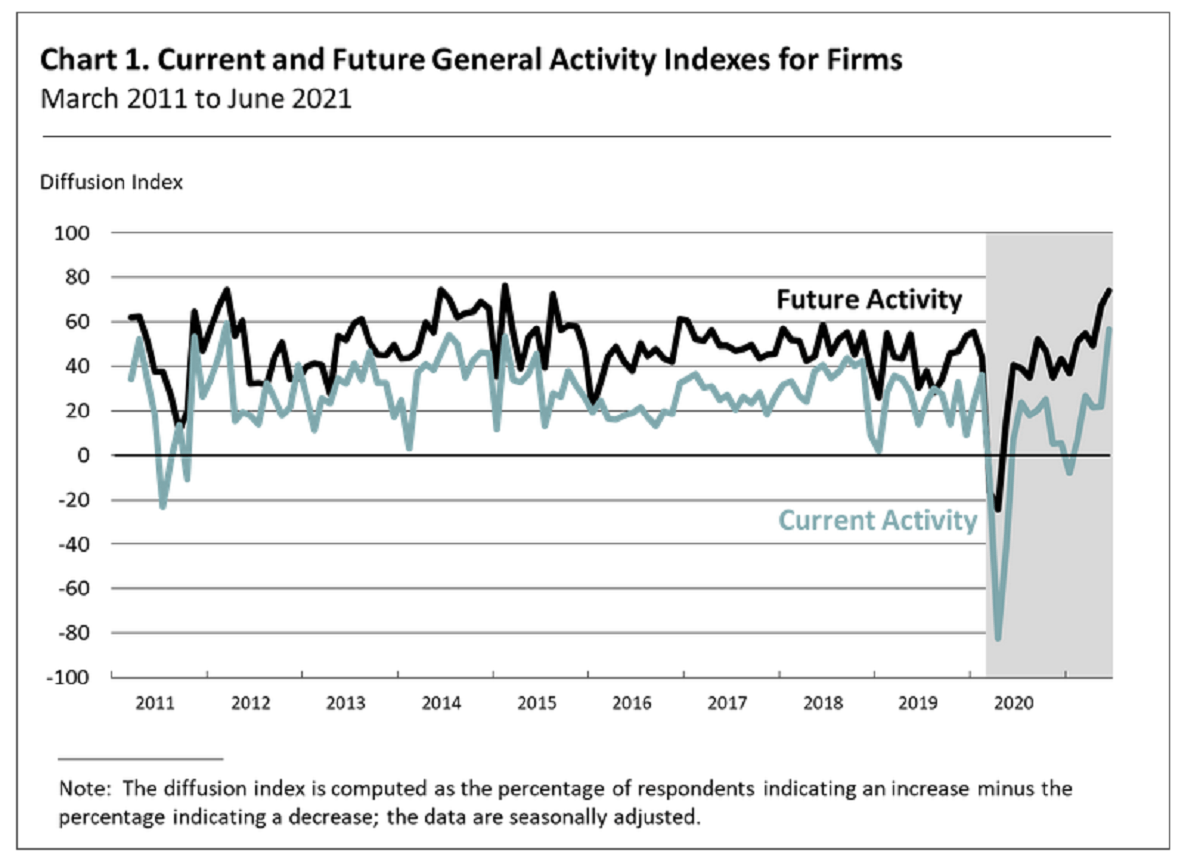
Source: Philadelphia FED
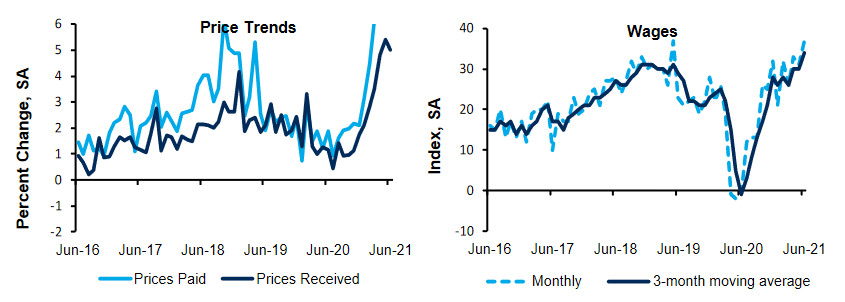
The Prices Paid Index Held Steady In June
More importantly, though, with the inflation drama still unfolding, the report showed more of the same:
“After reaching its all-time high in May, the prices paid index mostly held steady in June at 49.0 Forty-nine percent of the firms reported increases, none reported decreases , and 33 percent of the firms reported stable input prices. Regarding prices for the firms’ own goods and services, the prices received index rose 12 points to 28.9 in June, its highest reading since June 2018.”
Please see below:
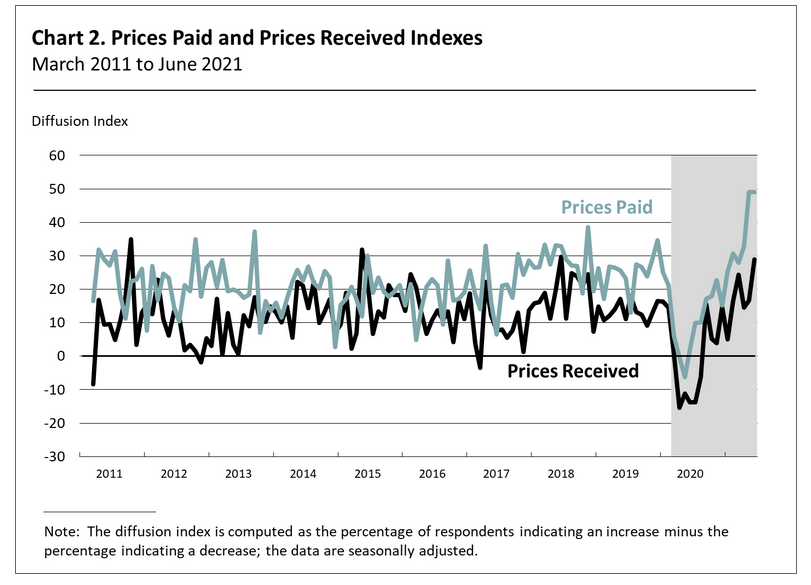
Source: Philadelphia FED
Similarly, the Richmond FED also released its Survey of Manufacturing Activity on Jun. 22. And while the report cited that “average growth rates of both prices paid and prices received by survey participants declined slightly but remained elevated in June,” employment was more optimistic, with the report revealing that “many manufacturers increased employment and wages in June and [expect] further increases in the next six months.”
Please see below:
Source: Richmond FED
The Economy Is Still A Ways Off
What’s more, while the FED admitted its inflation error on Jun. 16 – as evidenced by the increase in its forecast for the headline Personal Consumption Expenditures (PCE) Index – Powell is now pretending that growth doesn’t exist. For context, the FED increased its 2021 real GDP growth estimate from 6.5% to 7.0% on Jun. 16, so Powell’s assertion on Jun. 22 that the economy "is still a ways off" is quite the contradiction.
Moreover, absent a severe spread of the Delta variant – which White House chief medical advisor Dr. Anthony Fauci said was “the greatest threat in the U.S. to our attempt to eliminate COVID-19” – U.S. economic growth should easily outperform its developed-market peers.
For example, many deflationists cite the slowdown in loan activity as a sign of a weak U.S. economy. However, with U.S. commercial banks releasing their deposit figures on Jun. 22, the argument is much more semblance than substance.
Please see below:
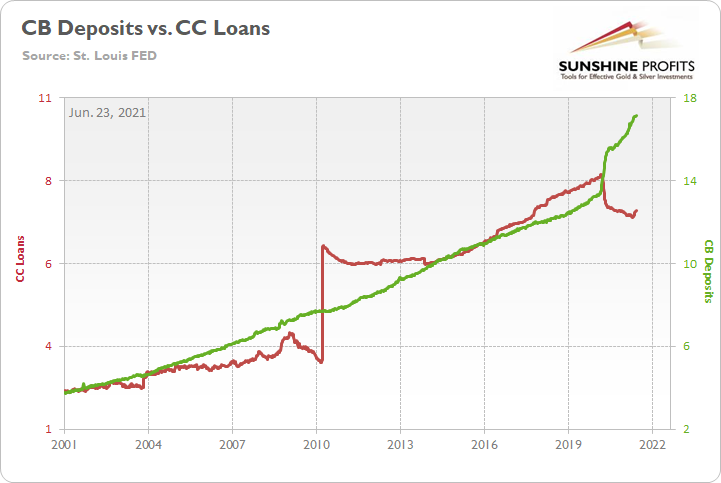
To explain, the green line above tracks deposits held by U.S. commercial banks, while the red line above tracks consumers’ revolving and credit card loans. If you analyze the right side of the chart, you can see that a material gap is present. However, with unprecedented fiscal policy (stimulus checks and enhanced unemployment benefits) flooding consumers’ bank accounts with dollars, why borrow money if you already have the cash to make the purchase?
To that point, if we compare U.S. commercial banks’ deposits to the U.S. federal debt, the connection is even clearer.
Please see below:
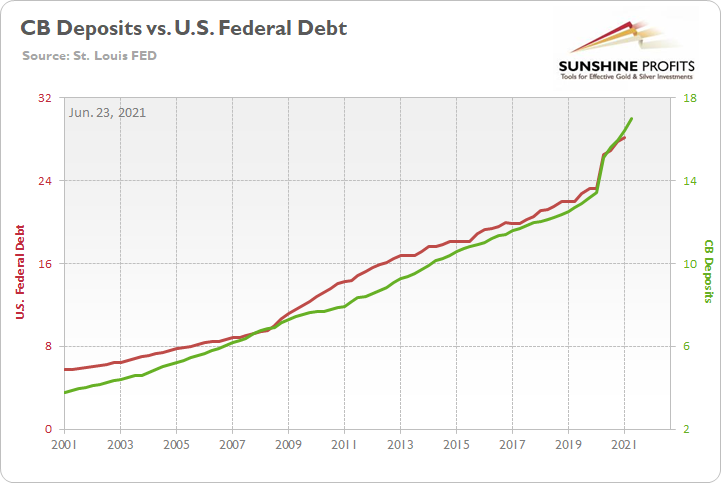
To explain, the green line above tracks deposits held in U.S. commercial banks, while the red line above tracks the U.S. federal debt. If you analyze the sharp move higher in 2020, it’s another sign that U.S. citizens don’t need to borrow money when the government is already writing the checks. For context, there is a slight lag because the U.S. federal debt references Q1 data and U.S. commercial banks’ deposits reference Q2 data.
The Rising U.S. Nonfarm Payrolls
Likewise, while rising U.S. nonfarm payrolls remain the key piece to solving the FED’s puzzle, the idea that monetary support is helping the real economy lacks credibility. To explain, the FED sold a record $792 billion worth of reverse repurchase agreements on Jun. 22. Moreover, when the FED buys $120 billion worth of bonds per month, the cash filters throughout the U.S. banking system and then financial institutions exchange that cash for Treasury securities on a daily basis, is QE really helping anyone?
Please see below:
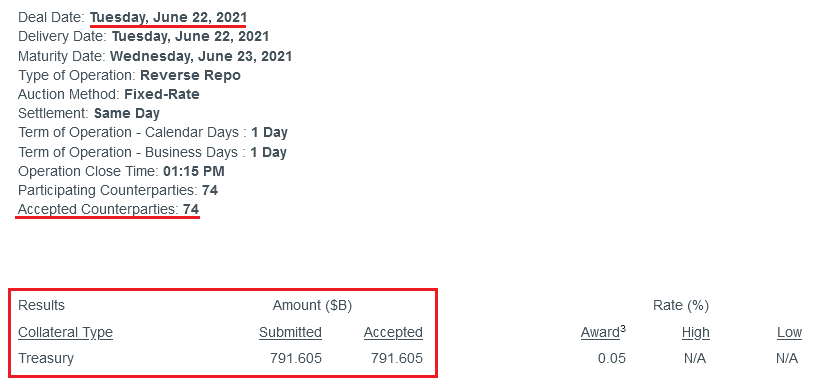
Source: NY FED
For context, I wrote previously:
A reverse repurchase agreement (repo) occurs when an institution offloads cash to the FED in exchange for a Treasury security (on an overnight or short-term basis). And with U.S. financial institutions currently flooded with excess liquidity, they’re shipping cash to the FED at an alarming rate.
More importantly, though, after the $400 billion level was breached in December 2015, the FED’s rate-hike cycle began. On top of that, the liquidity drain is at extreme odds with the FED’s QE program. For example, the FED aims to purchase a combined $120 billion worth of Treasuries and mortgage-backed securities per month. However, with daily reverse repurchase agreements averaging $520 billion since May 21, the FED has essentially negated 4.33 months’ worth of QE in the last month alone.
To that point, the flood of reverse repurchase agreements signals that financial institutions have no use for the FED’s handouts. Think about it: if commercial banks could generate higher returns by originating loans for consumers and businesses, wouldn’t they? And with 74 counterparties participating on Jun. 22 – up from 46 on Jun. 7 – the FED’s liquidity circus is now on display every night.
Gold vs U.S. 10-Year Real Yield
If that wasn’t enough, I’ve highlighted on several occasions that gold exhibits a strong negative correlation with the U.S. 10-Year real yield (inflation-adjusted). And unsurprisingly, when the latter peaked in late 2018 and began its descent, it was off to the races for gold.
Please see below:
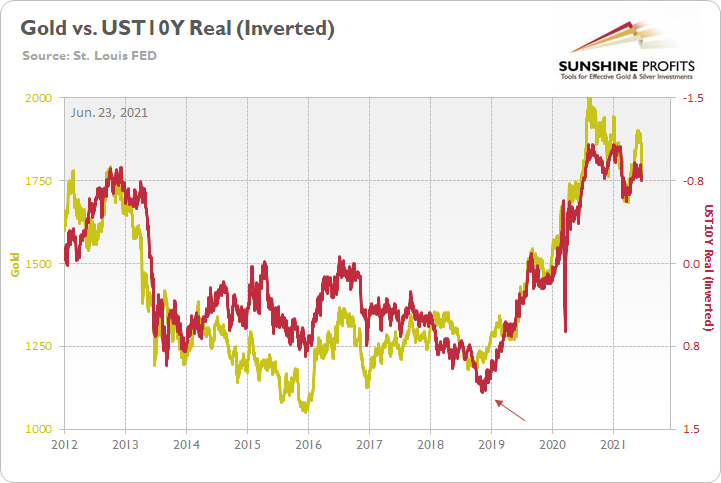
To explain, the gold line above tracks the London Bullion Market Association (LBMA) Gold Price , while the red line above tracks the inverted U.S. 10-Year real yield. For context, inverted means that the latter’s scale is flipped upside down and that a rising red line represents a falling U.S. 10-Year real yield, while a falling red line represents a rising U.S. 10-Year real yield.
More importantly, though, if you analyze the relationship, you can see that before the U.S. 10-Year real yield plunged, gold was trading below $1,250 (follow the arrow). Conversely, once the U.S. 10-Year real yield hit an all-time low of – 1.08% in 2020, gold was trading above $2,000.
Thus, what emotional gold investors fail to appreciate is that the yellow metal benefited from abnormally low interest rates. And with further strength dependent on another all-time low, the FED’s tightening cycle (which is already subtly underway) paints an ominous portrait of gold’s medium-term future.
Peak Fed
To that point, with Morgan Stanley telling its clients that “ We are past “Peak Fed” for the cycle and the market knows it ,” overzealous gold investors ignore the difficult realities that lie ahead.
Please see below:
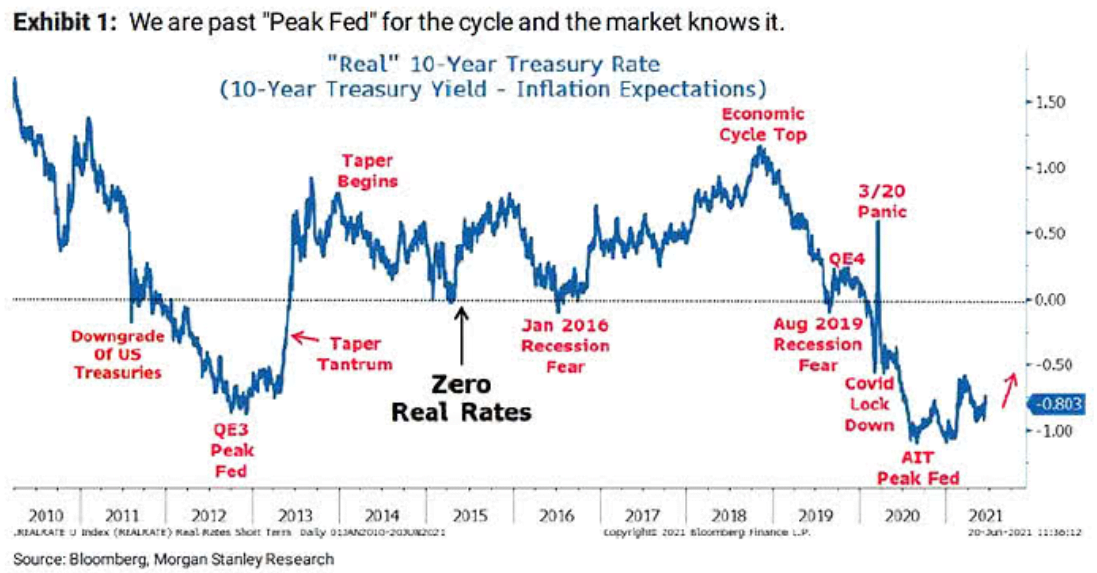
To explain, the blue line above tracks the U.S. 10-Year real yield and important fundamental developments are marked in red. If you analyze the “Peak Fed” labels near 2012 and 2020 and compare them with gold’s behavior on the first chart above, you can see how abnormally low U.S. 10-Year real yields coincided with abnormally high gold prices. As a result, with the former poised to move higher in the coming months, the yellow metal will likely head in the opposite direction.
What’s more, not only are the PMs dodging bullets from the bond market, but the USD Index has barely made its presence felt. For example, while the FED’s hawkish shift (even if Powell won’t admit it) is extremely bullish for the greenback, market participants – who are willing to give the FED the benefit of the doubt – still remain skeptical of the recent rally.
Please see below:
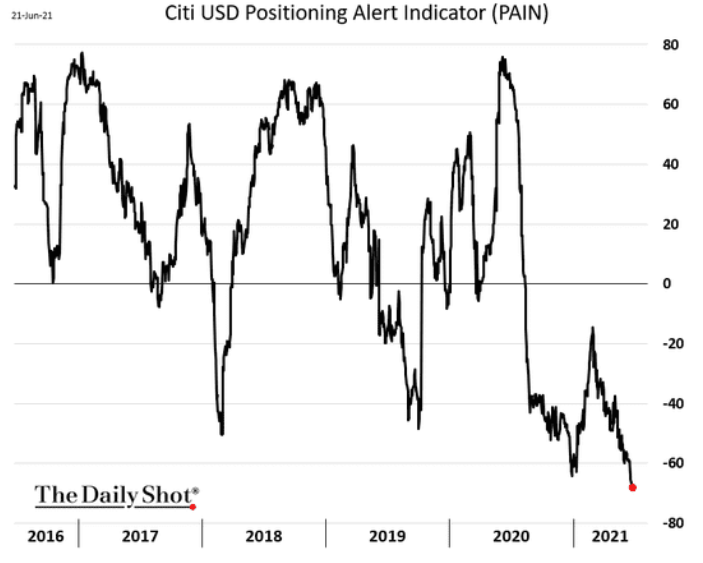
To explain, the black line above tracks Citigroup’s USD Positioning Alert Indicator (PAIN). For context, the index gauges whether or not positioning is crowded in the currency market. If you analyze the right side of the chart, you can see that U.S. dollar sentiment has fallen off of a cliff. However, with all signs pointing to a September taper, a violent short-covering rally could catch many investors off guard.
As further evidence, when the FED delivered its taper announcement in December 2013, the USD Index recorded (with a delay) one of its sharpest rallies ever.
Please see below:
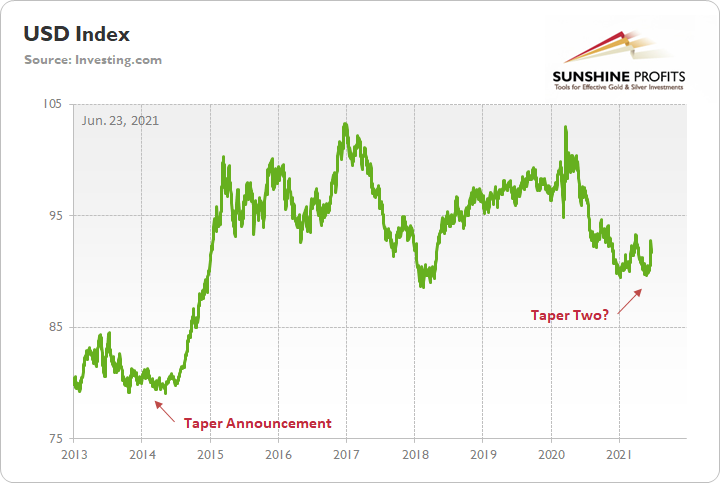
To explain, the green line above tracks the USD Index. If you analyze the left side of the chart, you can see that after the FED revealed its hand, the USD Index found a bottom and surged roughly six months later. Thus, with a similar announcement likely in the fall, the PMs could be confronted with even more negativity.
And no, Basel 3 is not likely to be a game-changer for the gold market in the near term – I discussed that on June 2 .
In conclusion, while the gold, silver, and mining stocks remain ripe for a short-term rally (no market moves in a straight line and PMs are no exception), their medium-term outlook remains extremely treacherous. And though Powell calmed investors’ nerves on Jun. 22 and market participants remain loyal followers, it’s important to remember that he is far from omniscient. After a significant about-face regarding the future trajectory of the headline PCE Index – a forecast that he made only three months ago – his confidence game is all about sentiment. Thus, while investors will give him the benefit of the doubt until the bitter end, the recent behavior of the bond market, the USD Index and the precious metals signal that the winds of change have already begun to blow.
Thank you for reading our free analysis today. Please note that the above is just a small fraction of today’s all-encompassing Gold & Silver Trading Alert. The latter includes multiple premium details such as the targets for gold and mining stocks that could be reached in the next few weeks. If you’d like to read those premium details, we have good news for you. As soon as you sign up for our free gold newsletter, you’ll get a free 7-day no-obligation trial access to our premium Gold & Silver Trading Alerts. It’s really free – sign up today.
Przemyslaw Radomski, CFA
Founder, Editor-in-chief
Sunshine Profits: Effective Investment through Diligence & Care
All essays, research and information found above represent analyses and opinions of Przemyslaw Radomski, CFA and Sunshine Profits' associates only. As such, it may prove wrong and be subject to change without notice. Opinions and analyses are based on data available to authors of respective essays at the time of writing. Although the information provided above is based on careful research and sources that are deemed to be accurate, Przemyslaw Radomski, CFA and his associates do not guarantee the accuracy or thoroughness of the data or information reported. The opinions published above are neither an offer nor a recommendation to purchase or sell any securities. Mr. Radomski is not a Registered Securities Advisor. By reading Przemyslaw Radomski's, CFA reports you fully agree that he will not be held responsible or liable for any decisions you make regarding any information provided in these reports. Investing, trading and speculation in any financial markets may involve high risk of loss. Przemyslaw Radomski, CFA, Sunshine Profits' employees and affiliates as well as members of their families may have a short or long position in any securities, including those mentioned in any of the reports or essays, and may make additional purchases and/or sales of those securities without notice.
The post Federal Reserve’s Liquidity Circus And Gold appeared first on ValueWalk.
Source valuewalk