

Energy sector: assessing breakout potential and key players


As the overall market continues to ramp up and trade near all-time highs, one sector has quietly consolidated. The energy sector remains close to flat this year despite the recent melt-up experienced in the rest of the market.
As you are most likely aware, the energy sector and its many publicly traded companies can endure periods of lull and extreme volatility. It's mainly at the hands of oil prices, geopolitical tensions, and OPEC. So perhaps it comes as a surprise that with the war in Ukraine and the Middle East, the Energy Select SPDR Fund (NYSE: XLE) is close to flat on the year and trading in the middle of its 52-week range.
However, as the range further tightens and the potential for geopolitical-breaking developments increases, this sector ETF might be nearing a breakout in either direction.
As such, now might be a good time to get familiar with the ETF, critical levels on the chart, and its key industry players.
The energy sector ETF
The Energy Select Sector SPDR Fund (NYSE: XLE) is an ETF that seeks to provide investment results that generally correspond to the price and yield performance of the Energy Select Sector Index (the Index). The Index includes companies from the following industries: oil, gas, and consumable fuels, as well as energy equipment and services.
The ETF has a 3.87% dividend yield, net expense ratio of 0.10%, and a market capitalization of $34.64 billion.
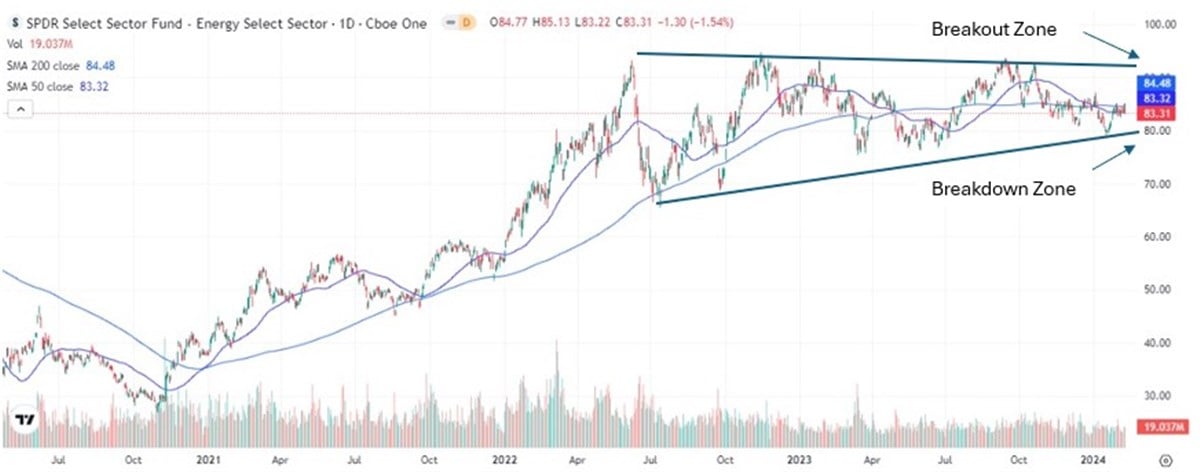
The sector ETF is trading in a tight channel right at two key Simple Moving Averages (SMA), its 200-day and 50-day SMA. The multi-month consolidation and declining volume, range, and converging SMAs signal that a breakout in either direction could likely occur in the following weeks or months.
The key level to look out for as the chart further develops and time passes on is the critical support zone of $80, acting as the potential breakdown level. Conversely, $90 - $93 will serve as significant resistance, potential inflection level, and breakout zone to the upside.
Three key players within the sector to watch
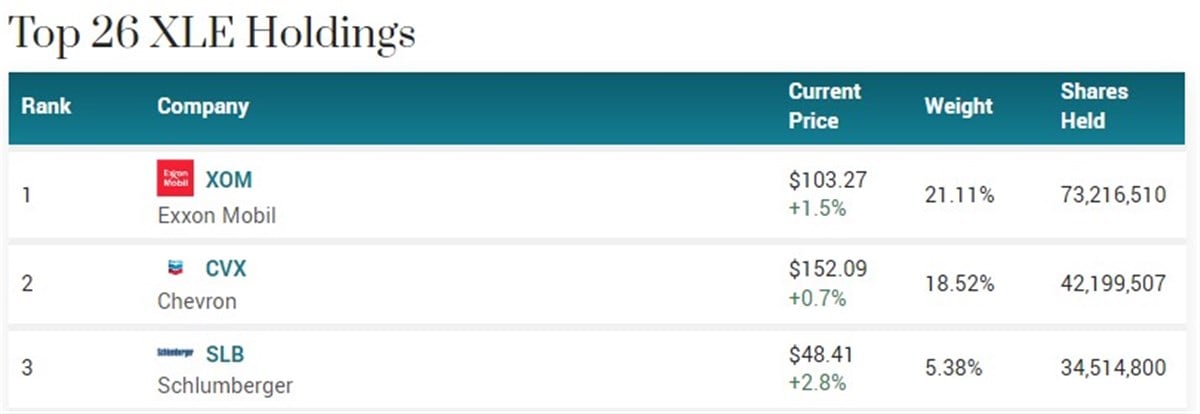
With a market cap of over $400 billion, Exxon Mobil is one of the world's largest oil companies. XOM is the largest holding of the sector ETF, with a 21.11% weighting, and as such, making it a key player in the sector and one that holds directional influence. XOM currently has a P/E of 11.45 and an RSI of 50.28, indicating that it may be in value territory. The oil giant has a Moderate Buy rating and price target forecasting over 25% upside.
Chevron is the second largest holding of the XLE ETF, weighing 18.52%. The stock has strong dividend growth and an attractive dividend yield of 4.02%. CVX currently has a P/E of 13.23 and an RSI of 52.67, indicating that the stock might be in value territory.
A move over short-term resistance at $155, which would also serve as a reclaim of the 200-day SMA, could serve as confirmation and signal a momentum shift.
SLB is the third largest holding of the XLE ETF, with a current weighting of 5.38%. The stock has a dividend yield of 2.12% and a P/E of 16.18.
Shares of SLB have underperformed the broader sector in recent months, with the stock declining almost 13% in the previous three months. Notably, shares are now trading near a higher time frame critical level of support, the stock's uptrend, near the current price. Should shares begin to pull lower, a significant momentum shift could occur. Conversely, analysts see a substantial upside for the stock, with the consensus price target forecasting an almost 50% upside.
Source MarketBeat
Chevron Corp. Stock
With 26 Buy predictions and not a single Sell prediction Chevron Corp. is an absolute favorite of our community.
With a target price of 179 € there is a positive potential of 20.3% for Chevron Corp. compared to the current price of 148.8 €.