


Updated on November 29th, 2019 by Eli Inkrot
The Dividend Aristocrats are a group of 57 companies in the S&P 500 Index, with 25+ consecutive years of dividend increases.
There are currently 57 Dividend Aristocrats. You can download an Excel spreadsheet of all 57 (with metrics that matter) by clicking the link below:
In addition to the downloadable spreadsheet, you can see a preview of the Dividend Aristocrats list in the table below:
| 3M Co. | 170.61 | 3.3 | 98,109 | 19.9 | 66.4 | 1.08 |
| A. O. Smith Corp. | 48.74 | 1.8 | 6,680 | 20.1 | 36.3 | 0.91 |
| Abbott Laboratories | 85.42 | 1.5 | 150,971 | 46.0 | 68.9 | 1.04 |
| AbbVie, Inc. | 88.33 | 4.8 | 130,624 | 40.5 | 196.3 | 0.89 |
| Aflac, Inc. | 54.82 | 2.0 | 40,238 | 13.5 | 26.3 | 0.72 |
| Air Products & Chemicals, Inc. | 236.04 | 1.9 | 52,012 | 29.6 | 57.4 | 0.81 |
| Archer-Daniels-Midland Co. | 42.94 | 3.2 | 23,904 | 20.3 | 65.5 | 0.83 |
| AT&T, Inc. | 37.66 | 5.4 | 275,106 | 16.8 | 91.0 | 0.61 |
| Automatic Data Processing, Inc. | 171.48 | 1.8 | 74,199 | 31.4 | 57.8 | 1.01 |
| Becton, Dickinson & Co. | 260.40 | 1.2 | 70,296 | 65.8 | 77.8 | 1.00 |
| Brown-Forman Corp. | 68.72 | 1.0 | 32,816 | 40.0 | 38.2 | 0.71 |
| Cardinal Health, Inc. | 55.22 | 3.5 | 16,151 | -3.9 | -13.6 | 0.93 |
| Caterpillar, Inc. | 145.69 | 2.5 | 80,516 | 13.7 | 34.0 | 1.37 |
| Chubb Ltd. | 152.08 | 1.9 | 68,922 | 19.1 | 37.2 | 0.62 |
| Chevron Corp. | 118.07 | 4.0 | 223,255 | 16.8 | 66.8 | 0.84 |
| Cincinnati Financial Corp. | 107.40 | 2.1 | 17,546 | 19.1 | 39.3 | 0.71 |
| Cintas Corp. | 260.32 | 1.0 | 26,943 | 29.9 | 29.3 | 1.01 |
| The Clorox Co. | 148.95 | 2.7 | 18,693 | 23.3 | 63.2 | 0.46 |
| The Coca-Cola Co. | 53.95 | 2.9 | 231,148 | 29.8 | 87.9 | 0.44 |
| Colgate-Palmolive Co. | 67.68 | 2.5 | 58,004 | 25.1 | 62.9 | 0.56 |
| Consolidated Edison, Inc. | 86.73 | 3.4 | 28,831 | 20.4 | 69.0 | 0.24 |
| Dover Corp. | 112.10 | 1.7 | 16,284 | 25.0 | 43.1 | 1.11 |
| Ecolab, Inc. | 186.95 | 1.0 | 53,887 | 35.3 | 34.8 | 0.80 |
| Emerson Electric Co. | 74.44 | 2.6 | 45,345 | 19.9 | 52.3 | 1.18 |
| Exxon Mobil Corp. | 68.70 | 4.9 | 290,677 | 20.0 | 98.5 | 0.91 |
| Federal Realty Investment Trust | 132.40 | 3.1 | 10,082 | 39.3 | 122.1 | 0.53 |
| Franklin Resources, Inc. | 27.88 | 3.7 | 13,886 | 11.8 | 44.1 | 1.13 |
| General Dynamics Corp. | 182.35 | 2.2 | 52,754 | 15.6 | 34.2 | 0.91 |
| Genuine Parts Co. | 105.21 | 2.9 | 15,286 | 19.2 | 55.0 | 0.77 |
| Hormel Foods Corp. | 44.88 | 1.9 | 23,964 | 24.5 | 45.9 | 0.51 |
| Illinois Tool Works, Inc. | 175.11 | 2.3 | 56,281 | 23.0 | 53.3 | 1.22 |
| Johnson & Johnson | 137.75 | 2.7 | 362,540 | 26.0 | 69.7 | 0.60 |
| Kimberly-Clark Corp. | 136.26 | 3.0 | 46,710 | 23.2 | 69.7 | 0.48 |
| Leggett & Platt, Inc. | 52.62 | 3.0 | 6,924 | 23.6 | 70.0 | 1.09 |
| Linde Plc | 206.00 | 1.7 | 110,658 | 21.1 | 35.3 | 0.78 |
| Lowe's Cos., Inc. | 118.46 | 1.7 | 90,977 | 31.3 | 54.4 | 1.04 |
| McCormick & Co., Inc. | 169.43 | 1.3 | 22,519 | 31.9 | 41.9 | 0.40 |
| McDonald's Corp. | 196.30 | 2.4 | 147,832 | 25.5 | 60.3 | 0.42 |
| Medtronic Plc | 112.47 | 1.8 | 150,752 | 32.3 | 59.7 | 0.66 |
| Nucor Corp. | 56.40 | 2.8 | 17,101 | 9.6 | 27.3 | 1.17 |
| People's United Financial, Inc. | 16.47 | 4.3 | 7,314 | 12.5 | 53.6 | 0.96 |
| Pentair Plc | 44.34 | 1.6 | 7,453 | 21.5 | 34.7 | 1.21 |
| PepsiCo, Inc. | 135.91 | 2.8 | 189,516 | 15.4 | 42.7 | 0.53 |
| PPG Industries, Inc. | 129.19 | 1.5 | 30,548 | 25.4 | 38.3 | 0.92 |
| Procter & Gamble Co. | 121.76 | 2.4 | 303,646 | 75.6 | 181.8 | 0.55 |
| Roper Technologies, Inc. | 362.80 | 0.5 | 37,752 | 32.6 | 16.6 | 1.04 |
| S&P Global, Inc. | 265.50 | 0.8 | 64,888 | 31.3 | 26.0 | 0.98 |
| The Sherwin-Williams Co. | 584.86 | 0.7 | 53,987 | 38.6 | 28.0 | 0.88 |
| Stanley Black & Decker, Inc. | 158.80 | 1.7 | 24,139 | 34.1 | 57.3 | 1.55 |
| Sysco Corp. | 81.06 | 1.9 | 41,359 | 24.5 | 47.2 | 0.51 |
| T. Rowe Price Group, Inc. | 123.71 | 2.4 | 28,908 | 15.5 | 37.3 | 1.22 |
| Target Corp. | 125.90 | 2.1 | 63,790 | 20.0 | 41.2 | 0.85 |
| United Technologies Corp. | 148.82 | 2.0 | 128,446 | 24.9 | 49.2 | 1.13 |
| VF Corp. | 89.05 | 2.2 | 35,564 | 27.4 | 60.3 | 1.16 |
| W.W. Grainger, Inc. | 319.24 | 1.8 | 17,196 | 18.5 | 32.5 | 1.06 |
| Walmart, Inc. | 118.76 | 1.8 | 337,786 | 23.6 | 41.9 | 0.61 |
| Walgreens Boots Alliance, Inc. | 60.11 | 3.0 | 53,650 | 13.9 | 41.2 | 1.04 |
| Name | Price | Dividend Yield | Market Cap ($M) | Forward P/E Ratio | Payout Ratio | Beta |
In order to become a Dividend Aristocrat, a company must possess a profitable business model and durable competitive advantages, along with the ability to raise dividends even during recessions. Alcoholic beverage manufacturers such as Brown-Forman (BF-B) have all the necessary qualities of a Dividend Aristocrat.
Brown-Forman has paid a dividend for 74 years, and it has increased its dividend for 36 years in a row, with a 5% increase announced in November 2019. It has maintained its dividend growth streak thanks to a very strong brand portfolio.
Brown-Forman is one of a group of companies commonly referred to as ‘sin’ stocks. These are companies in the alcohol, tobacco, and gaming industries. This article will discuss Brown-Forman’s business model, growth prospects and valuation.
Business Overview
Jack Daniel’s Tennessee Whiskey got its start all the way back in 1865, when Jack Daniel purchased Cave Spring Hollow. The following year, he registered the Jack Daniel Distillery, which stands today as America’s oldest registered distillery.
Brown-Forman has a large product portfolio, which is focused on whiskey, vodka, and tequila. Its most famous brand is its flagship Jack Daniel’s whiskey. Other popular brands include Herradura and el Jimador tequila, and Finlandia vodka.
Brown-Forman has focused its strategies on 10 core brands:
Source: Investor Day Presentation
Brown-Forman reported its first quarter (fiscal 2020) earnings results on August 28th, 2019. The company announced that it generated revenue of $766 million, which was in line with the revenue it produced during the previous year’s quarter. Underlying net sales growth rate would have been even higher, as adverse currency rate movements took off several hundred basis points from Brown-Forman’s organic sales growth rate for both emerging markets as well as for developed international markets. Brown-Forman’s earnings-per-share totaled $0.39 during the first quarter, which was slightly ahead of the consensus analyst estimate.
Brown-Forman reiterated its guidance for revenue growth of 5% to 7% during fiscal 2020 on an organic basis. Brown-Forman also forecasts that its operating profits will rise by 3% to 5% during the current year. The company forecasts that its earnings-per-share should come in between $1.75 to $1.85 this year.
Currently, tariffs and an ongoing trade war pose a short-term headwind for the company. But over the long-term, Brown-Forman should continue to benefit from its leading brand portfolio, with growth in new products and geographic markets.
Growth Prospects
Brown-Forman has a strong growth track record; the company was even able to increase its earnings-per-share during the last financial crisis, as demand for alcohol is not especially cyclical. During the 2010 to 2019 timeframe, Brown-Forman grew its earnings-per-share by a 6.9% average compound rate. Earnings-per-share were driven by a combination of several factors, including revenue growth, rising margins, and the impact of a declining share count.
Underlying sales growth has been solid in recent quarters. Due to currency headwinds – the strong dollar results in lower reported sales when sales in other currencies are translated back to U.S. dollars – the reported revenue growth rate was not as strong. Thanks to the fact that Brown-Forman owns strong brands and is active in the super and ultra- premium alcoholic beverages markets, which see consistent market growth, Brown-Forman should be able to keep its revenue growing going forward.
This has been an important growth factor for Brown-Forman in the past. Brown-Forman’s Jack Daniels brand, as well as its American super-premium whiskeys, continue to grow around the globe, although tariffs are a short-term headwind.
International operations were the main growth driver for currency-adjusted sales during the last couple of quarters and will likely remain an important growth factor going forward.
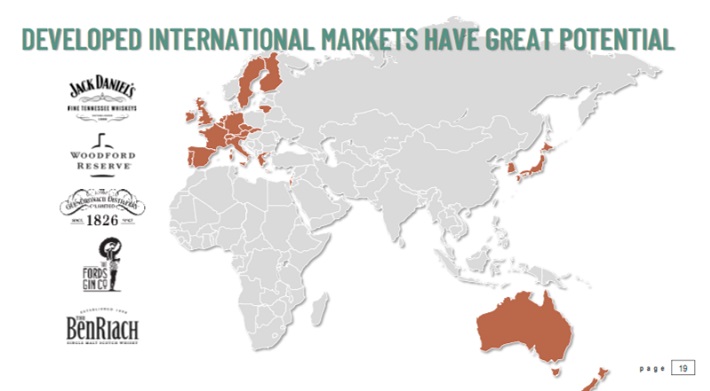
Source: Annual Stockholders’ Meeting
Higher overall sales allow for margin increases due to better economies of scale, which makes the company more efficient overall, and positively impacts its net earnings growth rate.
In addition, Brown-Forman has bought back about 13% of its outstanding shares since 2010, which adds some additional growth to its bottom line. Going forward, there is plenty of growth potential left, as the company further expands its product line, both inside and outside of its flagship Jack Daniels brand. We are forecasting nearly 9% annual earnings-per-share growth over the next five years.
Competitive Advantages & Recession Performance
Brown-Forman has many competitive advantages. Its popular brands yield significant pricing power. And, it has a highly profitable business, with low manufacturing and distribution costs because of its global scale. These qualities help Brown-Forman generate consistently high returns on invested capital. Return on capital exceeded 15% each year since 2008.
Brown-Forman is also very resistant to recessions. This is typical among ‘sin’ stocks, as their products tend to be consumed in greater volume when economic times are tough. One could argue that alcohol manufacturers actually perform well during recessions.
Brown-Forman’s earnings-per-share through the Great Recession are shown below:
- 2007 earnings-per-share of $0.76
- 2008 earnings-per-share of $0.77 (1.3% increase)
- 2009 earnings-per-share of $0.82 (6.5% increase)
- 2010 earnings-per-share of $0.95 (15.9% increase)
As you can see, the company grew its earnings-per-share every year through the Great Recession. This is a rare accomplishment that demonstrates the company’s defensive business model. Put simply, spirits manufacturers such as Brown-Forman are among the most recession-resistant businesses.
Valuation & Expected Returns
Based on the midpoint of management’s guidance – $1.80 in earnings-per-share this year – and a current share price near $69, shares of Brown-Forman are currently trading at P/E ratio of 38.1.
This is a very high multiple, even taking into consideration a well above business. Over the past decade, shares of Brown-Forman have traded hands with an average P/E ratio in the mid-20’s. We are being slightly conservative with our assumed fair value multiple, taking into consideration some short-term headwinds that have come up as of late and the general pricing of similar quality businesses.
If shares were to revert to 22 times earnings, this implies the potential for a -10%+ valuation headwind over the next five years. On this basis, the valuation appears especially stretched, even by Brown-Forman’s lofty standards.
A strong growth rate (9%) and dividend yield (1.0%) will help, but a reduction in the security’s valuation to a more “normalized” level would effectively wipe out any intermediate-term total return potential.
Investors should note that Brown-Forman pays a special dividend on occasion. For example, Brown-Forman paid a special dividend of $1.00 per share in 2018. Previous special dividends from Brown-Forman were paid in 2012 and 2010, so it is not something the company does every year.
Final Thoughts
Brown-Forman has a dominant position in its core product categories. Its flagship Jack Daniel’s brand should continue to lead the whiskey industry, with high growth from its smaller whiskey brands and tequila. The emerging markets are also an appealing growth catalyst and of course the dividend growth streak is enviable.
Brown-Forman is a good example of a great business trading at an exceptionally high valuation. If shares were to continue trading at 30+ times earnings, total return potential would be average. However, that is a speculation that we are not comfortable making at this juncture. As such, despite a solid dividend and very strong business, shares do not look particularly compelling for purchase right now.