

Boyar Value Group 2Q21 Commentary

Boyar Value Group commentary for the second quarter ended June 30, 2021.

Q2 2021 hedge fund letters, conferences and more
“The fact that a security carries high valuation metrics doesn’t mean it’s overpriced, and the fact that another has low valuation metrics doesn’t mean it’s a bargain.” - Howard Marks
Compared with the first quarter of 2021, when the Georgia Senate runoff elections secured Democratic control of Congress (via the vice-presidential tiebreaker), protestors descended on the Capitol Building, and Archegos Capital imploded, the second quarter of 2021 was tranquil. This calmness was reflected in the stock market, with the VIX (a measure of stock market volatility) ending the first half of 2021 at 15.8. (In March 2020, at the height of the pandemic, that level reached 82.7.)
Will the calm in the markets continue? Not necessarily, according to Nicholas Colas, cofounder of DataTrek Research, who notes that during the summer months, when trading desks are thinly staffed, any surprising developments “hit the market harder than they otherwise might . . . and since volatility and returns have a negative correlation, this dynamic can make for difficult investment environments.” History bears this out, says Akane Otani, writing in the Wall Street Journal: July delivers average gains of 1.6%, but according to the Stock Traders Almanac, historical August returns have been so poor that “August’s a good month to go on vacation: trading stocks will lead to frustration.”
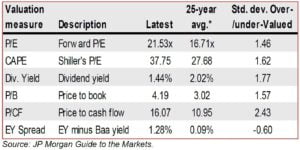
The S&P 500 finished the second quarter of 2021 selling for 21.5x earnings (fwd.) versus 19.2x at the February 19, 2020, pre-COVID peak and 13.3x at the March 23, 2020, pandemic low. Since the March 23 nadir, the S&P 500 has gained well over 90%. By most traditional valuation measures (price to earnings, price to book, price to free cash flow, etc.) the S&P 500 is historically overvalued.
Investors don’t seem concerned, though, with Investment Company Institute data recording a net $10 billion invested into U.S. stock mutual and exchange-traded funds in the second quarter of 2021. VandaTrack reports that retail investors were especially aggressive in June, purchasing $28 billion of individual stock and exchange-traded funds—the highest monthly total since at least 2014. Reminiscent of the speculative excesses of the dot-com era, more than 10 million new brokerage accounts were established in the first half of 2021, says JMP Securities—roughly the same as in all of 2020! Individual investors have an uncanny ability to pile into the market at its peaks, so we view their newfound enthusiasm for equities as good reason for caution.
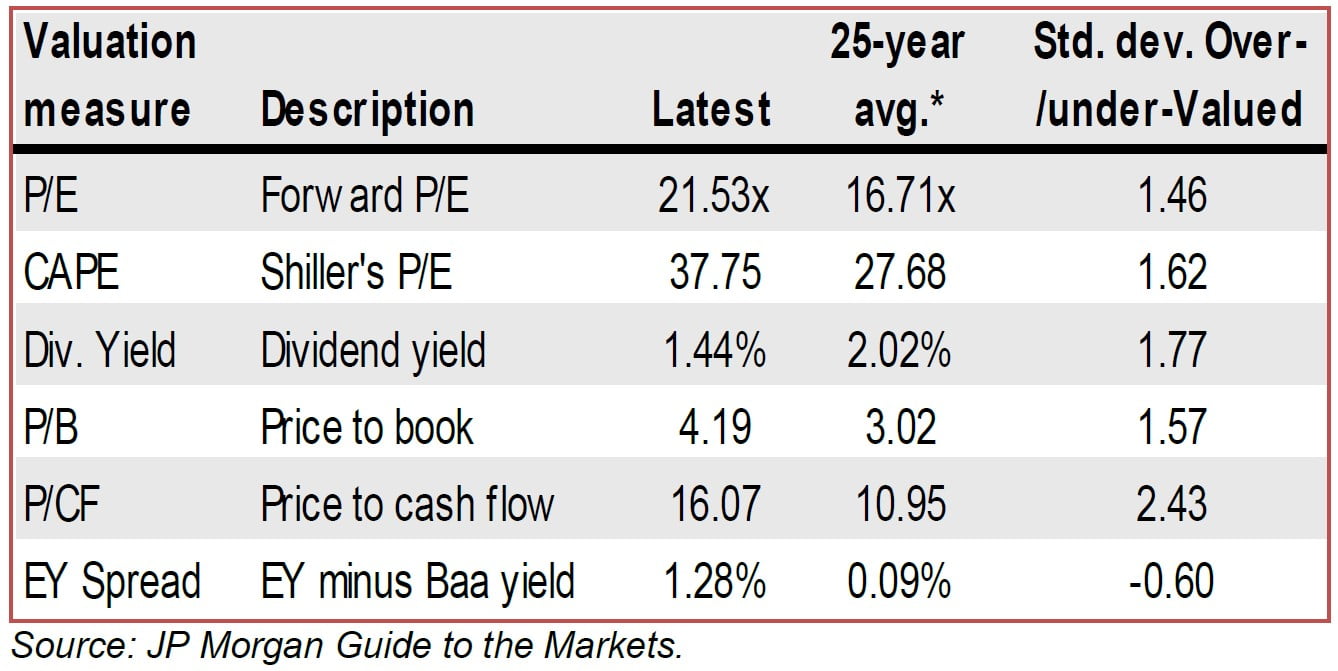
Overvaluation against historical averages does not mean investors should avoid equities, because extraordinarily low interest rates make prior valuation comparisons less meaningful. More important, we don’t buy “the market”; we purchase businesses that sell far below our estimate of their worth. It may be especially hard uncovering bargains right now, but we’ve identified quite a few businesses selling at attractive levels even so.
What’s Been Driving Share Price Returns in 2021?
Stocks kept rising during the quarter, with the S&P 500 advancing by 8.5%. By far the bestperforming sectors for 2Q were real estate (up 13.1%), energy (up 11.3%), and technology (up 11.6%). The only sector that fell into the red for the quarter was utilities (down 0.4%). For the first half of the year, no sector was in negative territory and by far the best-performing sector was energy (up 45.6% as of June 30). However, energy’s low weighting in the S&P 500 (2.9%) gave it little effect on the index’s return, and its fantastic rise should be viewed in context, following a loss of 37.3% in 2020. Interestingly, according to JP Morgan, since the market bottomed in March 2020, the S&P 500 had advanced ~96% as of June 30, 2021— leaving us “only” ~29% above its February 2020 peak.
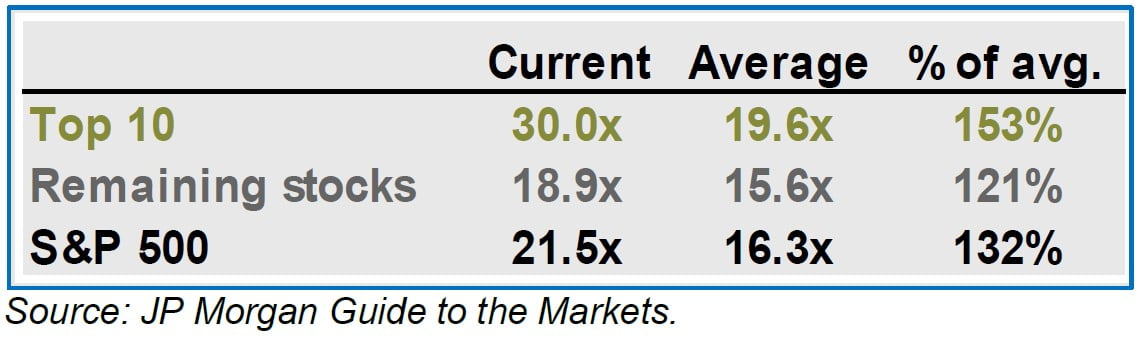
As we’ve noted before, the S&P 500 is being driven by a handful of mega-cap stocks (because the index is weighted by market capitalization, companies with a higher market capitalization have a greater impact on its performance). But things haven’t always been this lopsided, says JP Morgan: as of June 30, 2021, the top 10 companies in the market-cap-weighted S&P 500 accounted for 28.6% of the index (versus 27.4% at the end of the first quarter of 2021 and ~17% back in 1996) and boasted an average forward multiple of 30.0x (versus an average of 19.6x since 1996 and virtually unchanged from the end of the prior quarter). The other stocks in the index are selling at 18.9x, well above their average valuation of 15.6x since 1996 but far less than the top 10 companies and down from 19.6x at the end of the first quarter of 2021.
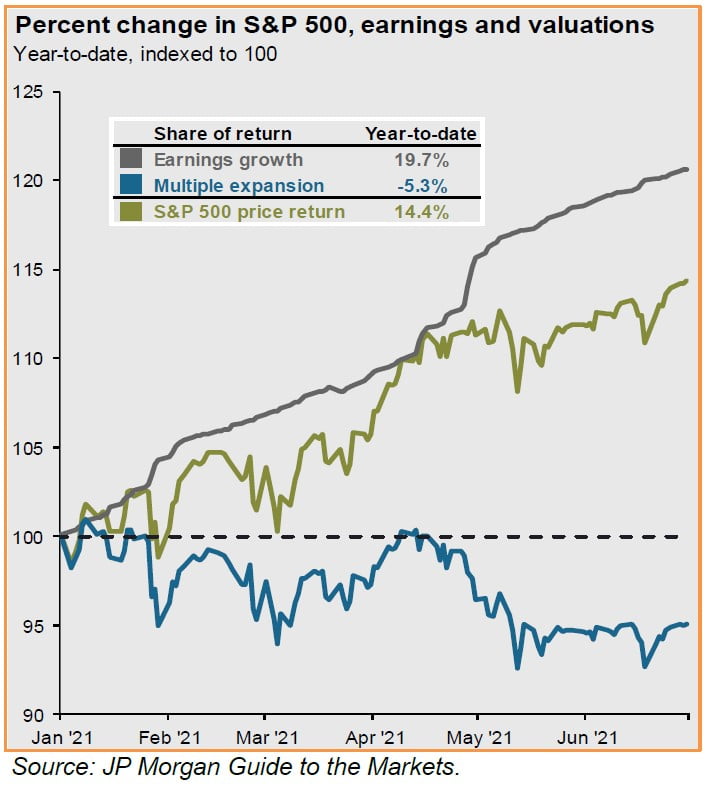
To oversimplify slightly, two main factors influence share price movement: a company’s earnings (or for an index, the earnings of the companies it includes) and its multiple (the price investors will pay to capture its future earnings). Midway through 2021, the S&P 500 had advanced 14.4% (not including dividends). Interestingly, this year’s gains have been driven solely by earnings, with earnings growth of 19.7% YTD but the multiple dropping by 5.3%.
A Relatively Cheap Corner of the U.S. Stock Market
Small-caps were the place to be these past 9 months. We’ve always been attracted to this area of the market, because Wall Street analysts tend not to follow smaller companies, which depresses their valuations and gives diligent investors an advantage. That’s why a few years ago we started a strategy largely focused on investing in micro- and small-cap stocks. The Russell 2000 (an index of smaller company stocks with an average market capitalization of $3.4 billion) ended June with 9 consecutive months of gains, its longest monthly winning streak since at least December 1986. Small-cap stocks have advanced ~49% since September 2020, versus a ~30% return for the S&P 500. Halfway through the year, small-cap stocks are up ~15%, roughly in line with the S&P 500 (though they’ve been lagging recently). What’s more, small-cap stocks are more attractively valued than larger companies, with Bank of America Research reporting that at the end of June, the Russell 2000 traded at 17.7x (fwd.) earnings, versus 21.5x for the Russell 1000 large-cap index.
Value Investing
What a difference a couple months can make in terms of stock market sentiment! This May, the financial press was heralding the return of value investing and predicting a new economic expansion that could last for years. As recently as May 11, Bloomberg’s Justina Lee was calling value investing “a winner”:
“Renewed value leadership at the factor level and the broader risk-on rebound suggest the economic cycle is continuing rather than peaking.”
“All this means quant investors who stuck with value during its historic pounding in the pandemic are getting their mojo back, while traders crowding into speculative tech-heavy corners of the market including Cathie Wood’s ARK funds are on the back foot.”
“The positive value returns in 2021, so far, have done little to shrink the extreme value spreads created by the previous negative returns.”
“Portfolios are still majorly composed of long duration growth assets and hence would be prone to losses if macro/inflation dynamics continue to improve. Cheap, economically sensitive, and an inflation hedge, value seems like the natural place to position a portfolio.”
But fast-forward a month or so, with the Federal Reserve signaling an earlier rise in rates, the financial press stopped predicting a renaissance in value investing. On June 21, Bloomberg’s Katie Greifeld and Viladana Hajric described the Fed’s actions as a “blow to value investors’ dreams”:
“You’re getting a bit of a gut check for the value trade. You have these sectors that have really outperformed, it was an area of the market that got crowded and you saw that the tech became underloved.”
That shifting appetite is evident in exchange-traded fund flows as well. The $170 billion Invesco QQQ Trust Series 1 ETF absorbed $3.9 billion through Thursday, on pace for its best week of inflows since September. Meanwhile, the $82 billion Vanguard Value ETF (ticker VTV) suffered its biggest one-day outflow since January in the wake of the Fed meeting.
“Investors are once again questioning the outlook for inflation and growth given the Fed’s expedited timeline for rate hikes, with performance leadership rotating from cyclical-value.”
But one well-respected market strategist isn’t changing his tune in terms of a return to value investing. In our last letter, we quoted JPMorgan Chase’s chief global strategist Marko Kolanovic as saying, “[W]e think this recovery can last longer and be more profound and have more of an impact on investor styles and flows than people appreciate.” Even after the Russell 1000 Value Index trailed its growth counterpart by roughly 8% in June (the most since 2000), Kolanovic said, “the current market positioning is not justified” and predicted “a move higher in bond yields, value and cyclical stocks” (emphasis added).
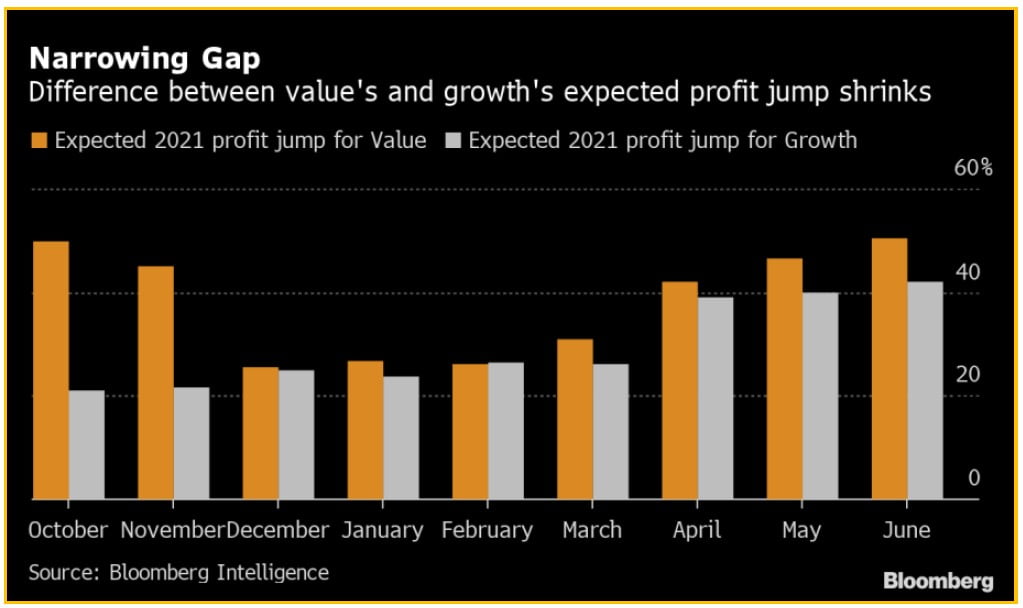
So why value shares’ reversal of fortune? Many pundits point to fears about rising interest rates and the COVID delta variant, but others point to muted earnings growth: value’s earnings were expected to rise 2.5x faster than growth shares this year, but halfway through the year, they’re roughly equal. In our opinion, pinpointing an exact reason for the change in investment sentiment is a fool’s errand. However, we are in Mr. Kolanovic’s camp in believing that the rotation back into value has not ended.
Inflation
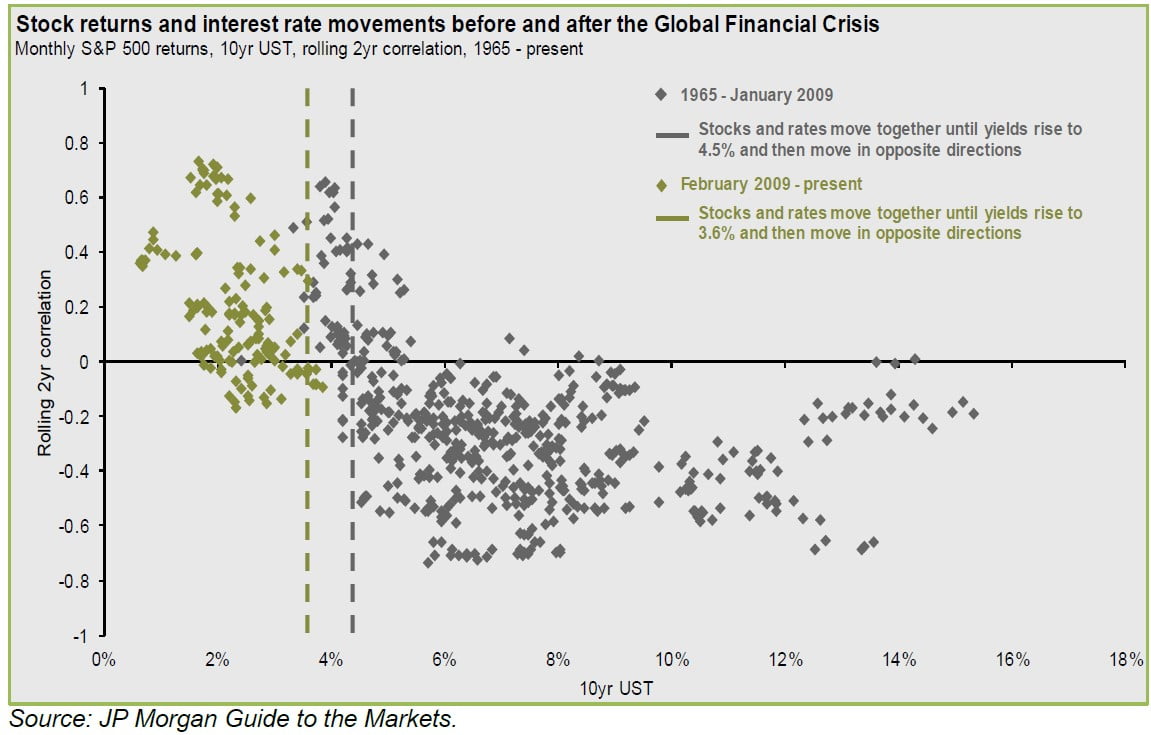
The financial media and Wall Street pundits have been fixating on when the Federal Reserve will raise rates—and the effect on future stock market returns. Interestingly, says JP Morgan, from 1965 to 2009 stocks and interest rates moved in tandem until yields reached 4.5%, then moved in opposite directions. Since 2009, however, the inflection point has been only 3.6%. Even in these unprecedented times, investors should focus less on where rates are headed (which seems impossible to predict) and more on the valuations and future prospects of the companies they own or would like to own—a much better recipe for long-term investment success.
Measures of inflation rose virtually unabated during the second quarter in the largest surge since 2008, with the Wall Street Journal’s Gwynn Guilford reporting 5% higher consumer prices for May than the year before—when you strip out volatile food and energy prices, it was the largest increase since June 1992. Gus Faucher, chief economist at PNC Financial Services Group, noted that the sharpest rises came in used cars, airfare, and hotel stays, the economic sectors most impacted by the pandemic: “[T]hat suggests that this is part of the dislocation from the reopening, and I would expect that . . . inflation will settle down later this year.” The trend continued in June as the government reported the fastest monthly rise in consumer prices in 13 years, at an increase of 5.4% (or 4.5% when setting aside food and energy prices—the highest such figure in 30 years).
Companies such as General Mills, Inc. (NYSE:GIS), Campbell Soup Company (NYSE:CPB), and Unilever N.V. (NYSE:UL) have begun raising prices on consumer goods, with the National Federation of Independent Business reporting that some 54% of small businesses followed suit by raising their average selling prices in June. And inflation is hitting the housing market particularly hard, says the National Association of Realtors: median home prices topped $350,000 for the first time in May, reflecting low interest rates as well as a shortage of homes on the market. The Wall Street Journal’s Nicole Friedman noted that the median existing home price has risen 23.6% from last year, yet homes are selling quickly. (The typical home sold in May spent a mere 17 days on the market.)
In June, however, some commodity prices began to reverse. By June 27, 2021, the prices of corn and soybeans were down from their May highs by 13% and 19%, respectively. Hogs, likewise, lost 17% in June. The fall in lumber prices was particularly noteworthy as July futures closed on July 14 at $521.40 per thousand board feet, down almost 70% from the $1,711.20 high hit in May. September futures settled at $612, down $27 from their pre-pandemic high. This could have positive implications for homebuilders, as both KB Home and Lennar have indicated that they will not be passing the recent savings on to consumers and will instead improve their margins. Home Depot, however, has lowered lumber prices in certain stores, in some instances by as much as 31% in three weeks!
The cost of shipping goods from overseas has skyrocketed in response to supply chain disruptions worsened by businesses’ rush to restock inventories coming out of the pandemic. The Feightos Baltic Index indicates that the average price of shipping a container from China to California is now $6,043, up 43% for the year—and up 344% since the start of 2020. Likewise, the price of shipping a container from Asia to Europe has increased 130% since the start of the year. And not only is shipping more expensive, says research group Sea Intelligence, but it’s frequently late: ~700 ships were a week or more late in the first 5 months of 2021, versus 1,500 for the entire period of 2012–2020.
Debt
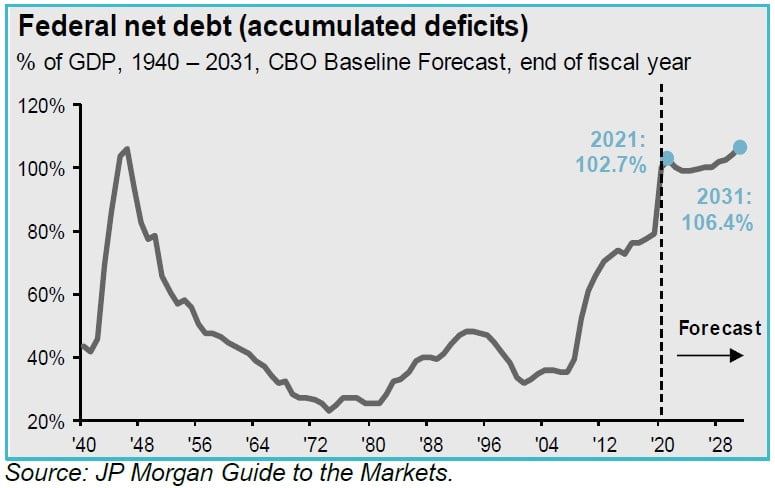
One of our biggest long-term concerns is the ballooning federal deficit. Before the pandemic, deficit as a percentage of GDP was uncomfortably high. The aggressive fiscal and monetary response to the economic effects of the pandemic kept the economy running and averted a depression, but it raised debt-to- GDP levels to multidecade highs, and more elevated deficit spending seems to be on its way. The U.S. is far from alone in this, however, with the Institute of International Finance reporting that many countries’ debt levels are elevated by historical standards: government debt increased to 105% of GDP in 2020, up from 88% pre-pandemic. In an extreme example, Japan’s public debt is over 250% of GDP, yet in the current low-interest-rate environment, its interest payments are basically the same as in the mid-1980s, when public debt was ~2/3 of GDP.
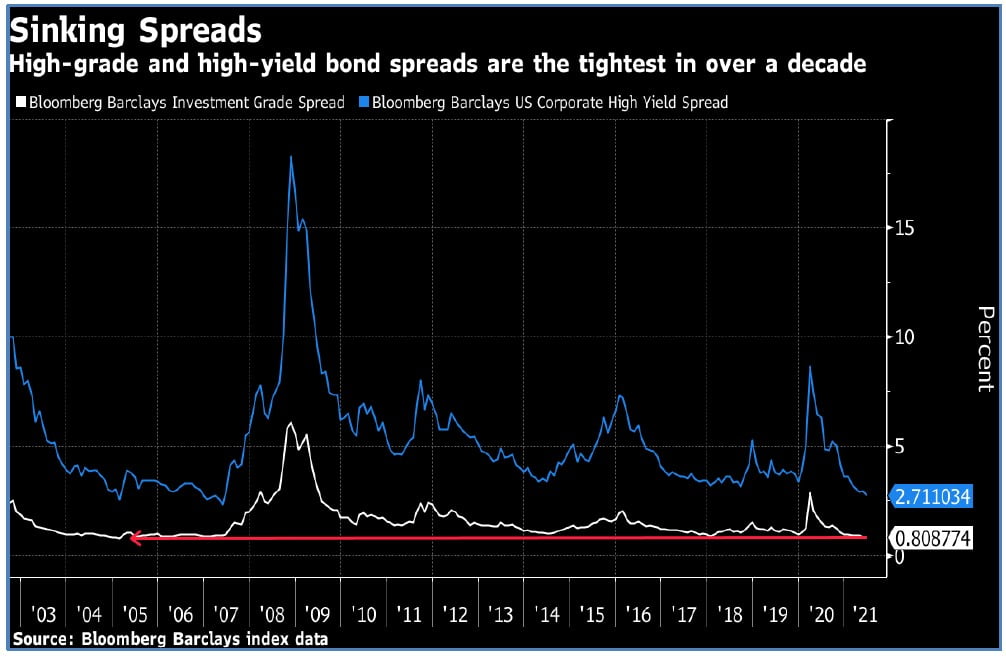
In the U.S. private sector, U.S. nonfinancial companies have taken on staggering levels of debt amid correspondingly low interest rates, with the Federal Reserve reporting that by the end of March, total debt for nonfinancial companies was $11.2 trillion—about half the size of the U.S. economy. The Wall Street Journal’s Sam Goldfarb reports that at the beginning of 2020, investment-grade corporate bonds yielded 2.84%, a figure that reached 4.6% at the height of the pandemic but fell to 1.74% by the end of 2020. By the end of the second quarter, spreads on investment-grade bonds had narrowed to an average of 81 basis points over Treasuries, the lowest level since 2005.
High-quality businesses have taken advantage of this by refinancing higher-cost debt, and struggling companies like Carnival Cruise have seized the lifeline by issuing debt to avert immediate bankruptcy amid lockdowns: Carnival, for example, had $33 billion of debt as of this past February, roughly triple its figure at the end of 2019.
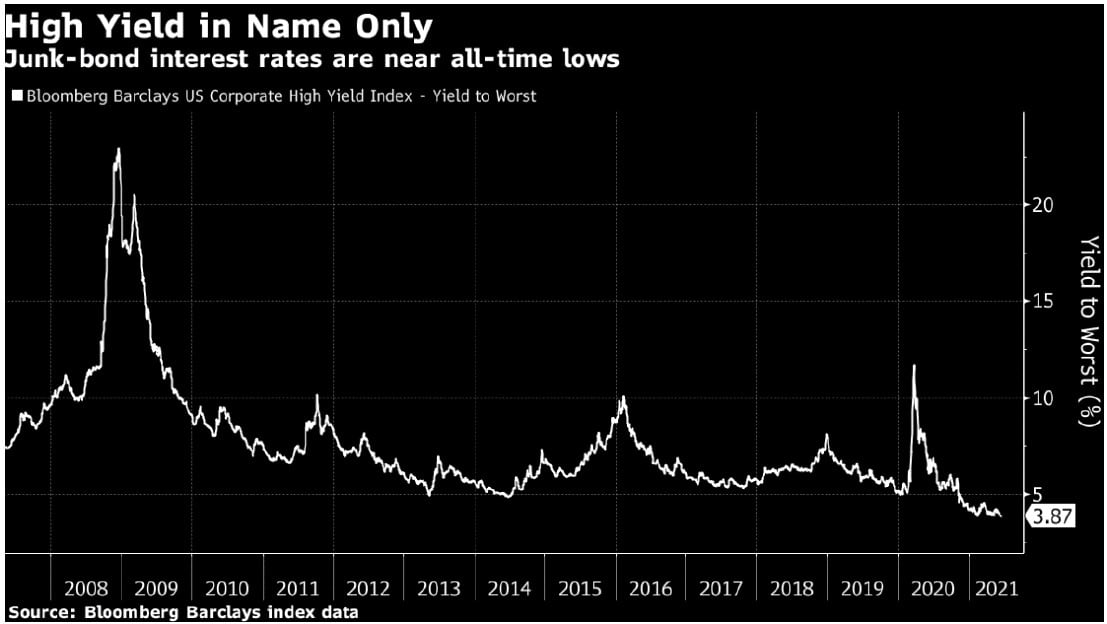
Perhaps “high-yield” isn’t such a descriptive name for junk bonds anymore. This June, Centene Corporation sold $1.8 billion in junk bonds with a yield of 2.45%—a record low. Average junk bond yields stand at ~3.89%— ~5 basis points from their all-time low yield and by certain measures do not even keep up with the rate of inflation. Indebted companies have taken advantage of the environment to issue more debt: according to S&P Global Market Intelligence, triple-C bond issuance is running 35% above the previous record, and Bank of America forecasts that junk bond issuance will hit a record $500 billion this year. Some may argue that investors are not receiving enough compensation to account for the risk they are taking. The average extra yield, or the spread investors demanded to hold junk bonds instead of U.S. Treasuries, was 2.62% as of July 6, 2021, according to Bloomberg Barclays data. In March 2020 that spread was more than 10%! In our opinion, certain equities that currently yield 3%-4% (with the capability of increasing their dividends over time) are much better investments for income-oriented investors than “high-yield” bonds are at current levels.
Where Do We Go from Here?
As Ben Levinson of Barron’s discusses in his July 5 trader column, the S&P 500 has risen for five quarters in a row, representing the second-best first-half gain since 1998. The quarterly gains are particularly noteworthy due to their strength, as the S&P 500 has gained more than 5% for five quarters in a row. These impressive gains may cause some investors to believe that a correction is imminent, so that now is the time to book profits. History, however, does not necessarily support such a course of action. The last time the S&P 500 gained 5% for five quarters in a row, it quickly lost 6% but subsequently recovered and gained 26% over the next 12 months. While investors should never invest more than they can afford to lose, cashing out simply because the market has advanced has historically not been a winning strategy. While they might not see a straight line up, investors with a portfolio of attractively priced high-quality stocks should probably just stay the course.
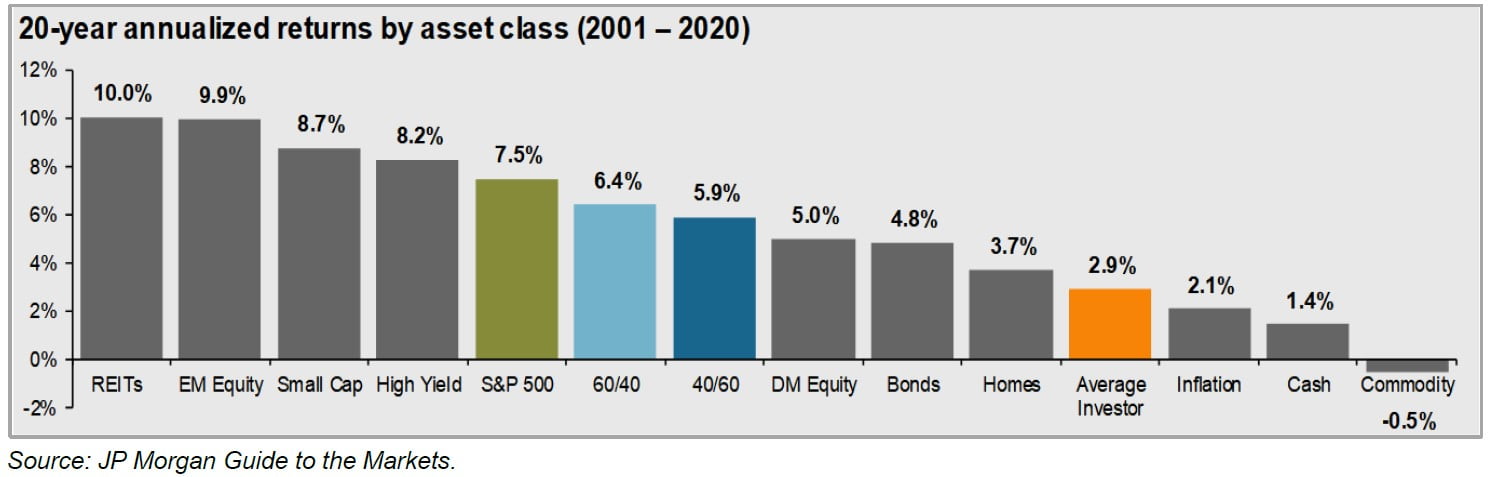
We’ve said it before and we’ll say it again: staying the course and taking a long-term view is one of individual investors’ best ways of putting the odds of investment success in their favor. According to Dalbar, over the past 20 years the S&P 500 has advanced 7.5%, yet the average investor has gained a mere 2.9% (barely beating the 2.1% inflation over the period). Why this underperformance? Partly because investors let their emotions get the best of them and chase the latest investment fad—or sell for nonfundamental reasons, such as simply because a company’s share price (or an index) has increased in value.
By contrast, taking a multiyear view tilts the odds of success in investors’ favor. Since 1950, the range of stock market returns measured by the S&P 500 (using data supplied by JP Morgan) in any given year has been from +47% to -39%. For any given 5-year period, however, that range is +28% to -3%—and for any given 20-year period, it is +17% to +6%. In short, since 1950, there has never been a 20-year period when investors did not make at least 6% per year in the stock market. Although past performance is certainly no guarantee of future returns, history shows that the longer the time frame you give yourself, the better your chances of earning a satisfactory return.
As always, we’re available to answer any questions you might have. If you’d like to discuss these issues further, please reach out to us at [email protected] or 212-995-8300.
Best Regards,
Mark A. Boyar
Jonathan I. Boyar
The post Boyar Value Group 2Q21 Commentary appeared first on ValueWalk.
Source valuewalk