

Bonhoeffer Fund 4Q20 Commentary: Case Study – At Home


Bonhoeffer Fund commentary for the fourth quarter ended December 2020, providing a case study of At Home Group Inc (NYSE:HOME).

Q4 2020 hedge fund letters, conferences and more
Dear Partner,
The Bonhoeffer Fund returned 20.0% net of fees in the fourth quarter of 2020 compared to up 15.9% for the MSCI World ex-US, a broad-based index. Our year-to-date performance is up 1.8% net of fees, compared to the DFA International Small Cap Value Fund, which is up 0.8%. As of December 31, 2020, our securities have an average earnings/free cash flow yield of 17.8% and an average EV/EBITDA of 4.5. The DFA International Small Cap Value Fund had an average earnings yield of 9.0%. The difference between the portfolio’s market valuation and my estimate of intrinsic value is still large (greater than 100%). I remain confident that the gap will close over time and the portfolio quality will continue increasing as we replace slower-growing firms with no corporate action with faster-growing firms.
Bonhoeffer Fund Portfolio Overview
There have been modest changes within the portfolio in the last quarter. As a reminder, our annual portfolio turnover rate has been low—less than 15% since inception. Our investment universe has been expanded to include growth-oriented firms using a value framework. So, for example, we sold securities that have low-single-digit growth rates and sell for single-digit earnings multiples for firms with mid-teens growth rates and low-teens earnings multiples. Therefore, as more growth-oriented companies have become available at reasonable prices, we have advantageously pursued these opportunities. We sold a Korean preferred holding, tendered our Philippine bottler, and purchased a home décor retailer, a telecom firm that is rolling out a fiber optic network, and a Korean preferred holding company (HoldCo) special situation. Our largest country exposures include: South Korea, Italy, South Africa, United Kingdom, Hong Kong, and the United States. The largest industry exposures include: distribution, telecom/media, real estate/infrastructure, and consumer products.
We’ve seen great success in our Korean special situations. The greatest challenges have been in Hong Kong, Latin America and South African securities. A key to the challenges has been sum-of-the-parts (SOTP) theses that have not approached fair value to date. SOTP theses are dependent upon growth, spin-offs, sales, and/or better governance to reduce the discount. The effects of COVID on these developing country economies have been stifling to growth. However, given the success of the COVID vaccines trials, I am optimistic about recovery in these regions in 2021. Governance is good and improving in our South African and Latin American holdings and, in my opinion, the current pricing more than reflects the governance situation in Hong Kong. Since my last letter, we have added a position in a home décor retailer and a US automobile dealership.
Compound Mispricings (55% of Portfolio; Quarterly Average Performance +21%)
These securities include the Korean preferred stocks, the nonvoting share of Buzzi, Telecom Italia, and Wilh. Wilhelmsen, and some HoldCos. The thesis for the closing of the voting, nonvoting, and holding company gap is better governance and liquidity, and corporate actions like spin-offs, sales, or holding company transactions and overall growth.
We have reviewed our compound mispricings and will look to sell where the discount is small and have no ongoing actions to unlock value. For those we retain, we will examine the potential share price increase due to the reduction in the discount over the next five years in comparison to the potential share price increase five years from now in faster-growing investments that I continue to monitor.
An example of one of our compound mispricings which has current corporate actions is Net1 UEPS. Net1 UEPS is undergoing change, as the original private-equity owners of Net1 UEPS before it went IPO (Brait/Anthony Ball) now have a large investment (16%) and sit on the board of directors after an eight-year absence. The changes include selling non-core assets like Bank Frick, KSNET, Cell-C, and the shutdown of Asian processing. The firm will focus on African fintech (EasyPay network and accounts, Carbon and Finbond) and fintech firms that can use Net1 UEPS’s technology (MobiKwik in India). The EasyPay network has started to grow again (net gain of 44,000 accounts) after a large decline when Net1 UEPS lost its SASSA contract in 2018. By September 2021, EasyPay is expected to have 1.4 million accounts resulting in breakeven cash flow. EasyPay network revenue grew by 6% over the past year. Once the network reaches breakeven, there is significant operating leverage.
The Korean preferred discounts in our portfolio are still large (20% to 37%). The trends of better governance and liquidity have reduced the discount in names like Samsung Electronics, and more preferred names trade at a premium to common shares. We purchased another preferred stock in a Korean HoldCo transaction where we have seen nice upside in three previous transactions in the past (see below for more details) and have sold our Daesang Holdings preferred stock because it did not have a known or anticipated catalyst.
Public LBOs (32% of Portfolio; Quarterly Average Performance +25%)
This includes our broadcast TV franchises, leasing and roll-on/roll-off (RORO) shipping, and our natural gas pipeline firm. One trend in these levered firms is the increasing spread between bond yields and the firms’ free cash flow yield.
An example is Antero Midstream, whose FCF yield was 15% as of December 31, 2020, with a debt yield of 6% with the bond/equity FCF spread of 9%. This is a large spread given that Antero Midstream has completed its backbone infrastructure and gathering investment and capital expenditures should be small going forward. With natural gas prices rebounding, Antero Midstream cash flows become more secured as Antero Resources has more cash flow cushion in making payments to Antero Midstream. The recovery in natural gas prices is expected to continue as the economy opens up and low oil prices have shut down Permian oil wells that were generating almost-free associated natural gas. Antero Midstream’s FCF yield of 15% is also higher than similarly secured Antero subordinated debt with a yield of 7.8%.
Distribution Theme (32% of Portfolio; Quarterly Performance +26%)
This includes our holdings in car and branded capital equipment dealerships, online shopping, and capital equipment leasing firms. One of the main KPIs for dealerships and shopping is velocity. We own some of the highest-velocity dealerships in markets around the world. There have been challenges in some markets hit by COVID, like South Africa and Latin America; however, there should be recovery once a vaccine is approved and distributed.
One firm in this theme is GS Home Shopping (whose focus in online fashion, living, and health retail) which is in the process of merging with GS Retail (whose focus is traditional convenience store and grocery store retail). This merger will create an omnichannel retailer that can utilize customer data to customize and cross-sell products and services, as well as create better customer experiences and delivery options. Combined, both firms have 32 million customers. Since there is little customer overlap between GS Home Shopping and GS Retail, cross-selling should drive revenue growth. The merger will also create cost synergies from sourcing economies of scale, home delivery, and nationwide cold storage. These changes are projected to generate 10% revenue growth over the next five years (versus 2.5% annual revenue growth over the past five years), with a higher operating margin due to cost synergies and economies of scale. The merger will also allow GS Retail/Home Shopping to more effectively compete with Coupang, Naver, and Gmarket (owned by eBay). If the higher growth materializes, GS Retail/Home Shopping should re-rate from a current free cash flow multiple of 7 times for the combined entity to a multiple closer to the online retailers Naver and Coupang. The Coupang IPO should also provide focus on the Korean e-commerce segment. There is also a dispute about the GS Home Shopping/Retail exchange being too low. If activists can increase this ratio, there will be additional upside for our GS Home Shopping position.
Telecom/Transaction Processing Theme (33% of Portfolio; Quarterly Performance +25%)
This includes our transaction processing and telecom firms. Despite continued expected performance, these firms have continued to lag in the rebound. The increasing use of transaction processing in our firms’ markets and the rollout of 5G will provide growth opportunities. Given that most of these firms are holding companies and have multiple components of value (including real estate), the timeline for realization may be longer than for other firms.
Consumer Product Theme (18% of Portfolio; Quarterly Performance +17%)
This includes our holdings in consumer product, tire, and beverage firms. The defensive nature of these firms has led to better-than-average performance.
Real Estate/Construction Theme (23% of Portfolio; Quarterly Performance +13%)
This includes our holdings in real estate, residential construction, and cement firms. Holdings in Hong Kong/China real estate have been rocked by both the coronavirus and the actions of the Chinese Communist Party in Hong Kong. In my opinion, the pricing of our real estate holdings has been impacted by both a recession and the communist takeover in Hong Kong. The current cement and construction holdings (in US/Europe via Buzzi Unicem and in Korea via Asia Cement) should do well as the world recovers from COVID shutdowns and governments start infrastructure programs.
Korean Special Situations
One area, since inception, where value has been realized is Korean special situations. This is an area where our rates of return have been very high (100%+ IRRs), and we will continue to pursue opportunities going forward. The first experience was the Lotte holding company transaction in 2017 where we made over 100% by purchasing Lotte Chilsung preferreds before the transaction and selling the Lotte Holdings preferreds after we received them. Our second experience was buying Taeyoung Engineering & Construction in 2018. When the share appreciated by 100%, we sold. The third experience was the holding company transaction in Teayoung Engineering & Construction in 2020 where we realized over 100% return by selling Taeyoung Engineering & Construction preferreds before the transaction was closed. We are now involved in another holding company transaction involving preferred shares.
Franchise Firms
As a result of the pandemic and its impact on markets, we have incorporated a growth framework into our valuation process for selecting investments. This is an additional tool in combination with our three existing frameworks (compound mispricings, mischaracterized firms, and public LBOs) which will undoubtedly enhance our investing process. This framework relies on quantitative and qualitative metrics that have been historically tested and results in end points that utilize the framework of buying for less than a firm can be worth in the midterm time frame (five years). With this forward-looking framework, investment alternatives can be examined by how much future upside can be obtained through growth.
For long-term investing, investing in firms that have competitive advantages and are growing (franchise firms) purchased at reasonable multiples is the best of both worlds. Bruce Greenwald provides a framework of key qualities for franchise firms1 in the latest edition of “Value Investing,” namely:
- have high returns on capital/equity, higher than 15% per year;
- some have exclusive franchises, like US car dealers, waste collection, or telecom/cable firms;
- have cost advantages such as economies of scale or scope (this can be measured by increasing profitability over time);
- have revenue advantages such as customer lock-in or network effects like software firms (this can be measured by high and increasing customer recurring revenue rates); and
- are in slowly changing industries with slowly changing market shares like telecom and specialty retail (this can be slow due to large CapEx required to compete or lack of disruption).
We have some of these firms in our portfolio and all new firms being added are being assessed with this framework. Using this framework, earnings or free cash are estimated five years forward by looking at the revenue and cash flow drivers of each firm.
Examples of this have been Ashtead and our case study this quarter—At Home. In the case of Ashtead, the ability to grow has been enhanced by a fragmented equipment leasing market and adjacent markets that Ashtead can lease and sell products into (such as cleaning equipment) using the same infrastructure in leasing equipment (thus gaining local economies of scale). Ashtead can grow its cash flow at a rate of 15% per year (as discussed in previous letters) and is currently selling for 15x free cash flow. In five years, 15% growth will generate 2x the free cash flows and, if this can be maintained for another seven years, then the multiple should be about 35 times. So, in this case, you can get a 2x via cash flow growth, a 2.3x via increased multiple, for a combined upside of 4.6x. The key to these upside values is sustainable growth with margin expansion. These can be found in firms with growing franchises. The following table provides some of the growth valuation tradeoffs.
Fragmented Markets
One area we have been investigating is franchise firms in fragmented markets. Fragmented markets allow firms to use economies of scale and scope and network effects to generate above market and growth rates of return for long periods of time. If you look at many of the historic multi-baggers, they have been in consolidating fragmented markets like distribution. The internet has been a disruptive force that has fragmented some traditional markets into online, offline, and omnichannel markets. In these markets, if the incumbent can adopt the innovation (in this case, the internet), then the disruptors will be at a disadvantage, as they will need to acquire customers from the incumbent.
We have been replacing slower-growing value securities with growing firms that have the characteristics of growth and sell for reasonable prices based upon a simplification of a growth stock formula popularized by Ben Graham, discussed in previous letters and used in the case study below. When looked at in this light, the discount to value can be quite significant.
Conclusion
As always, if you would like to discuss any of the philosophies or investments in deeper detail, then please do not hesitate to reach out. Until next quarter, thank you for your confidence in our work and have a safe and fruitful 2021.
Warm Regards,
Keith D. Smith, CFA
Case Study: At Home (HOME)
At Home (HOME) is a home décor retailer. At Home provides home accessories (rugs, housewares, furniture, wall hangings, etc.) in a self-service format similar to Costco. The company has 219 stores in 40 states across the United States. The average size of an At Home store is 105,000 square feet offering over 50,000 SKUs. This is larger than other home décor retailer whose average store size is about 25,000 square feet. They also lease second-generation real estate resulting in a lower lease cost (average $6/ft2) than competitors. In Rochester, At Home is an old grocery location (the number two grocer in Rochester) which they have upgraded to remove the “grungy” grocer appearance.
The company’s value proposition is to provide a wide selection of goods at a low price point ($15 per item and less than $70 per basket). The stores have limited staff to support the self-service environment. In visits to local stores, At Home focuses on areas like carpets, barstools/seats, and wall decor of which other retailers have limited selections. Over 70% of the At Home merchandise is exclusive to At Home; so At Home can make both the retail and branded product margins for these products.
At Home is not the largest competitor in the home décor market. Much of home décor is sold by generalists such as Walmart, Target, Home Depot, Amazon, and Lowe’s. These firms have 35% of the home décor market. At Home is a home décor specialty store like HomeGoods (owned by TJ Maxx), Williams Sonoma, and Bed Bath & Beyond. The market is quite competitive and players who have not been able to generate profitability have gone bankrupt, including Pier 1, with 1,500 stores nationwide. At Home has also pivoted to provide “buy online, pick up in store” (BOPIS) during COVID to ensure sales continue despite the pandemic.
Why Do Customers Keep Coming Back?
Retailers who do not have recurring revenue can create recurring revenue by ensuring customers have a reason to return to the store or website. This brings to mind a local store in Rochester, Wegmans, that makes the shopping experience pleasurable and provides a wide selection of grocery items. The wide selection brings folks in, and the experience keeps them coming back.
At Home is similar in that the selection and price (similar to Costco) bring customers in and the experience keeps them coming back. The experience is envisioning how the home décor items you’re looking at will fit into your home combined with a treasure hunt from the wide selection of specific types of merchandise (like rugs) not found at more general retailers like Walmart and Target. The envisioning experience is difficult to do online and easier to do in person. If we invert this, we can ask, “As a consumer, when will you not return?” if you have a bad experience in a store, like if the store is dirty or you receive poor customer service, when you can buy a known item online and have it delivered to you at home. At Home has primarily exclusive items which are in a category where the in-person experience is important in product selection. The At Home retail concept to date has been successful in providing above market growth rates and profitability as described in detail below.
Business and Service Analysis (The Power of Operational Efficiency)
Despite At Home’s smaller size, they have generated margins on par with HomeGoods (3x size) and Williams Sonoma (3x size). One of the reasons is the operational efficiency of At Home’s stores and logistics network. The stores are designed to minimize employee touches and maximize floor space, with a truckload-sized back room. The larger stores provide for more sales per store ($8 million) and less real estate cost per dollar of sales. Local economies of scale should also occur as the store footprint is filled in. Another reason is the high mix of store brand/exclusives (70%) which yield both retailer and product margins.
The efficient store concept leads to high return on capital for new stores, with 40% to 150% IRRs and a two-year average payback period. The store-level EBITDA margins have also been high at 25%.
With such high IRRs, At Home has been opening new stores, with 18% sales growth and 10% unit growth over the past five years. Currently, the unit growth rate is 10% per year. Same store growth is 1% currently, with 3% to 5% potential from omnichannel sales. So the current run rate growth is 11%, with a potential of 13% to 15% growth per year.
At Home’s current store count is 219, with a potential of 600 stores (or a 37% penetration rate). At Home is still in the early growth stage of expansion, with revenue growth of 17% per year. Other concepts at this level of market penetration include Five Below and Ollie’s Bargain Outlet. Comparable firm HomeGoods, a more mature growth firm, currently has 841 stores (or a penetration rate of 61%). The current revenue growth rate of HomeGoods is 10%. Michaels, a mature firm, has 1,275 stores (or a penetration rate of 85%), with a revenue growth rate closer to the market growth rate of 1.5%.
COVID has modified At Home’s business, incorporating BOPIS as a method to sustain sales despite the COVID lockdowns. This low-cost method of delivery has made At Home cost competitive with online-only competitors in the SKUs it stocks. Many of the items are bulky, and the ratio of shipping cost to item cost is high. In addition, for home décor, many customers like to browse in stores and physical locations provide a valuable delivery location close to target customers.
The company has a goal of increasing inventory turns from two to three times. Returning customer cohorts spend 10% upon each return trip to the store.
Home Decor Retail Market
The home décor retail business in the US is a fragmented market, with large portions of the market controlled by retail generalists, like Walmart, Target, Home Depot, and Lowe’s. The largest six providers have a 35% market share with the next four having 11%. The US is a $169 billion addressable market. The overall home décor market growth rate is 3% per year and is expected to grow by 3.6% over the next five years. The current store penetration rate into its addressable market is estimated to be 37% according to management. The current opportunity for organic growth is high, thus the firm has reinvested cash flows into growing the store base.
More at-home time and excess cash—due to low travel/entertainment spending due to COVID—has increased demand for home décor items. Across retail in general, the value segment has been taking share from more full-priced retailers. The value segment includes retailers like Five Below, Ollie’s Bargain Outlet, Ulta Beauty, HomeGoods, Ross, and TJX, which all have above market growth rates in their respective segments.
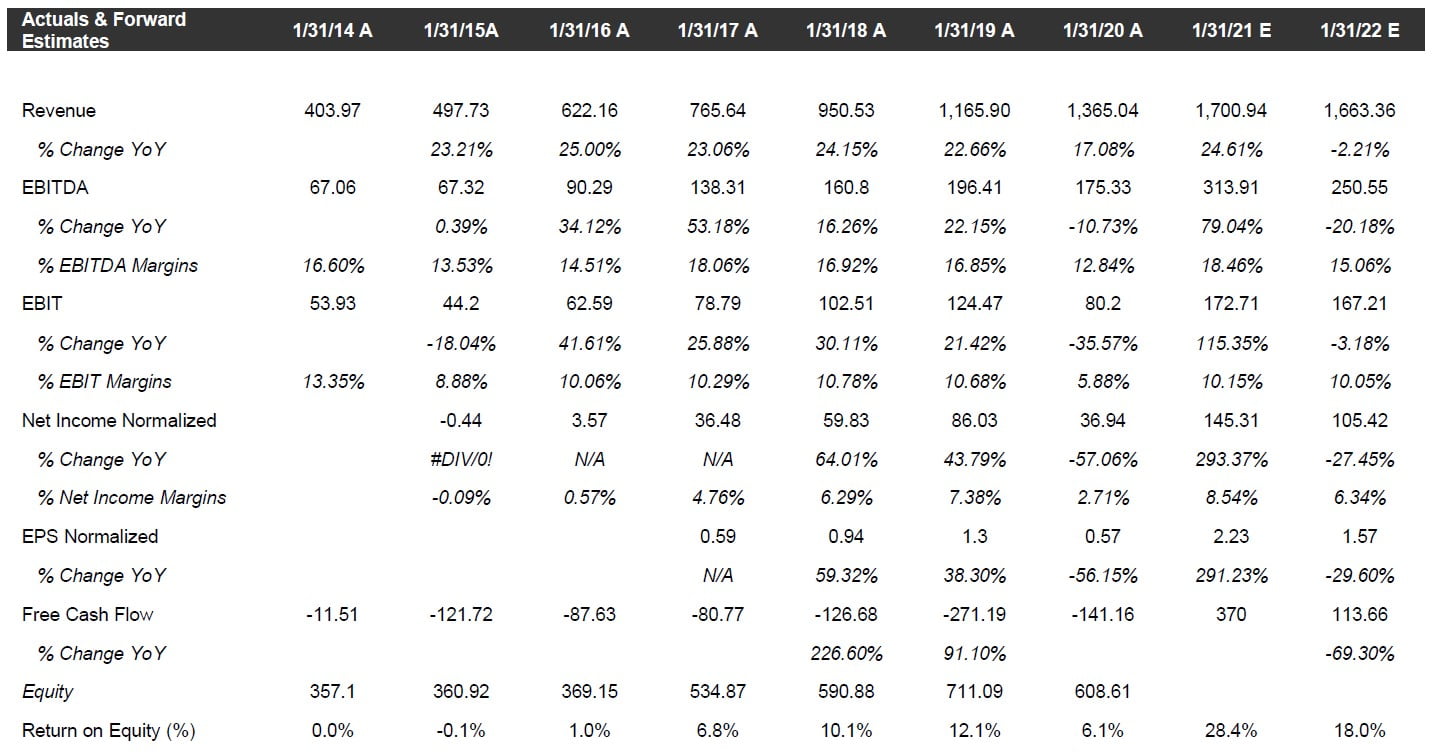
ROI can be decomposed into two components—EBITA margins generated from selling merchandise and how many times the inventory is sold per year. Over the past three years, At Home’s EBITA margin has increased from 10.8% to 11.7% (higher than Bed Bath & Beyond and in line with HomeGoods and Williams Sonoma) and the inventory turns have increased from 2.5 to 3.7 (a larger increase than any of the competitors).
At Home also has the highest sales and earnings growth rates at 36%, and the high return on equity is in line with Michaels and Williams Sonoma. This is, in part, due to the consolidating market and the cluster strategy described above. Other comparable firms in the US (Michaels and Williams Sonoma) also have strong ROE numbers from high margins.
In the US market, At Home has less than a 1% market share, which is up 175% since 2015. Walmart is the largest firm, with an 11% market share, followed by TJX/Marshalls and HomeGoods with a 7%, Target with a 7% market share, Amazon with a 5% market share, Lowe’s/Home Depot with a 5% market share, Bed Bath & Beyond with a 5% market share, and Wayfair with a 3% market share.
If At Home’s penetration approaches Michaels’s over the next ten years (9% unit growth), and the market grows at GDP levels of 3.6% per year, then a sustainable 12-13% revenue growth is attainable in the US market. Given the economies of scale of the larger players and the addition of additional adjacent products, it’s possible to pick up some additional 2-3% growth per year resulting in a conservative ten-year growth rate of 15%.
If we look at more penetrated markets (such as Michaels), the growth rates are more dependent upon market growth versus gains in market share. Even in more penetrated markets (like Michaels), double-digit ROEs are currently being achieved.
Downside Protection
At Home has modest leverage that has been paid down to 0.9 debt/EBITDA over the last nine months. The coverage ratio is also high at 5.7x. At Home’s growth also provides some downside protection, as the coverage ratio is increasing as the EBITDA is increasing.
Although At Home is in a competitive business, it has defensive characteristics. These include a low-cost structure and the increasing returns to scale described above.
Management and Incentives
In 2019, management compensation was 23% base salary and 73% incentive based, of which 53% is equity based and 20% is cash based. The 2020 cash bonus compensation was 75% based upon an EBITDA target (whose target was 10% higher than 2019) and 25% based upon a same-store growth target of 3.5%. In 2020, management was granted options grants with a strike price of $7.58. The CEO’s special bonus of out-of-the-money options was cancelled. At Home’s management has incentives vesting stock units tied to same-store sales growth and net income growth for the management team. Overall, 1.67 million shares were granted in 2020 (about 2.6% of shares outstanding per year).
No bonus was earned or paid in 2020. Management also reduced their base salaries by 30% while workers were furloughed due to COVID, and the CEO took no base pay. The management team owns 6.3% of At Home common stock.
Lewis Bird is the current CEO and chairman of At Home. His background is in private equity and, at one time, he was the CEO of The Gores Group. The management team owns a material amount of common stock directly, which ranges from 3x to 65x their salaries. The current CEO directly holds 2.624 million shares (value of $64.6 million). The original private equity firms that brought At Home public in 2017 own 23% of the firm.
Valuation
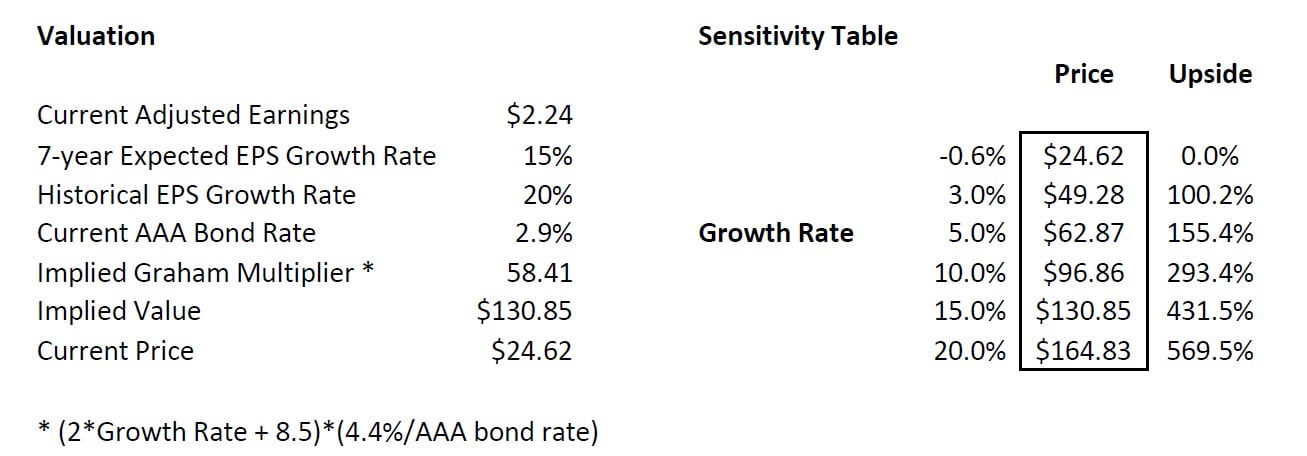
The valuation of At Home is an interesting exercise because of the fact that is has higher growth and margins than most of its competitors due to its efficiency described above. The implied growth using the Graham formula adjusted to today’s interest rates ((8.5 + 2g)*(4.4/AAA bond rate)) and the current P/E is -0.6%, clearly implying a mispriced security. Some historic benchmarks for growth are the historic sales growth rates of 20% per year and EBITDA growth rates of 16% per year.
The question is whether this growth rate is sustainable over the next five to seven years. If a 10% unit growth rate is resumed, based upon management’s plan, then with SSS growth of 3% and operational leverage, this should result in mid-teens growth rates. If 15% is used in the Graham formula for seven years of future EPS growth, then the resulting P/E is 58.4x. If we reduce the growth rate to 12%, then we get a multiple of 42.7x. Now, if we reduce the growth to the market revenue growth rate of 3.6%, then we get 23.8x, more than double from the current price. Three firms that have similar historical growth as At Home are Ollie’s, Ulta Beauty, and Five Below. Ollie’s trades at a multiple of 30x, Ulta Beauty trades at a multiple of 30x, and Five Below trades at a multiple of 50x. So a conservative 20x multiple on $2.24 EPS yields a value of $44 per share, which I believe is a reasonable 12-month target. If, over the next five years, a 15% EPS growth is attained, then the earnings will be $4.50. Applying a 23.8x multiple to these earnings (implying a 4% growth rate over the subsequent seven years) then a value of $107.1 per share is obtained. This results in a five-year IRR of about 35%.
Comparables
The following are comparables in the home décor and high-growth retailer markets. The high-growth retailers are opening new stores and still have a considerable runway. Ollie’s has 345 stores, Five Below has 900 stores, and Ulta Beauty has 1,254 (At Home has 219 stores).
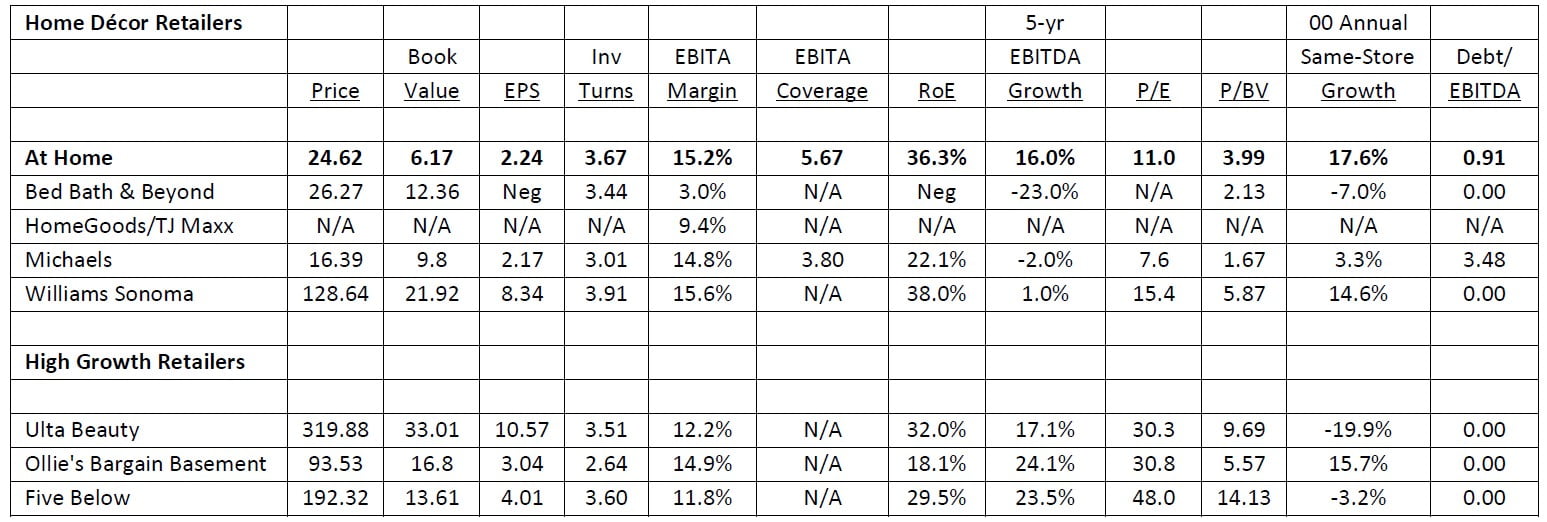
Benchmarking
In comparison to other home décor firms, At Home has some of the highest ROEs, inventory turns, and EBITA margin, and same-store sales growth rates. At Home has ROEs, inventory turns, and EBITDA growth margins compatible to the high-growth firms. At Home has the highest SSS growth of both home décor and high-growth retailers. With these favorable operational metrics, At Home has one of the lowest P/E ratios of either group.
Risks
The primary risks to achieving a target valuation of $107 per share for At Home include:
- a double-dip downturn due to COVID; and
- a decline in the future growth via either slower store openings or declining SSS growth.
Potential Upside/Catalysts
The primary upsides/catalysts include:
- continued growth beyond the COVID home improvement “bump;”
- operational leverage due to economies of scale; and
- re-rating to reflect higher growth.
Timeline/Investment Horizon
The short-term target is $46, which is almost double today’s price. I think the investment thesis can play out over the next three to five years. By that time, At Home’s net income and earnings should have appreciated by at least two times, and the fair multiple could double with a 5% increased growth rate. If that is the case then, At Home will attain a 4.0x return to $107 over five years. This is similar to a “Davis double,” where both underlying earnings increase along with the fair value multiple.
The post Bonhoeffer Fund 4Q20 Commentary: Case Study – At Home appeared first on ValueWalk.
Source valuewalk