



Looking For an Excuse



Suddenly, everyone is blaming the Turkish Lira for Friday’s (Aug. 10/18) 0.67% pull-back in the S&P 500. Human behavior never changes. We are always looking for “meaning” in everything that happens in life. If we cannot find any meaning, then we substitute meaning with “cause”; the market goes up or down (it is all the same), and since there is no meaning in it, we desperately search for a cause. An entire industry is devoted to assigning cause to movements in the market, after-the-fact. What value does that have and how does that help us profit from the market? For us, the answer to the former is, “none”, and the answer to the latter is, “it doesn’t”.
Even if the Lira falling was, in fact, the reason why the market dropped on Friday (which it’s not), what good would that do for us as investors? Up until Friday, the Lira had already fallen 25% since March of this year, yet the S&P 500 rose 7% during the same period. So, which is it; Lira weakness causes the market to go up, or Lira weakness causes the market to go down? The entire approach is ridiculous.
The market went down because of its technical position; the S&P 500 was bumping up against its all-time high and the upper trend-line. The falling Lira and Trump’s tariff-tantrums were a convenient excuses to let-off some pressure. Good technical analysis tries to measure the effect of human emotional behavior on the price of the market. Since human emotion — of which fear is the most important — does not change over time, the market tends to repeat the same behavior over time. The “causes”, on-the-other-hand, are always different.
No two markets are exactly alike, but if you know what to look for, all markets are similar.
Equities
Sentiment
The bullish sentiment in the AAII weekly survey moved slightly in the bullish direction, but as we pointed out in the update on Thursday we are still very far from any level that might be considered overly-bullish.

{This section is for paid subscribers only}
The put-to-call ratio has a strong negative-correlation with the SPX; down-spikes in the 8-week MA indicate local market tops, while up-spikes indicate local bottoms. A down-spike formed in early June, marking the local high in the SPX, after which, the market dropped until the final week of June. Since then, the 8-week MA has been on the rise, which normally correlates with a decreasing SPX. This time, however, the SPX has been rallying along with the Put-to-call ratio which has caused a positive correlation. The last couple of times it has done this (September and December 2017), the SPX continued to rally after the put-to-call ratio spiked without forming a local bottom (blue ovals). This implies further strength in the SPX.

{This section is for paid subscribers only}
The volatility index (VIX) by itself has a strong inverse correlation with the S&P 500; down-spikes in the VIX correlate with market highs. As we have been stating for a couple of weeks now, the current VIX pattern has some potential to move up (SPX down) without changing the over-all bullish pattern. The VIX did climb on the week, and the SPX has started to pull back (chart below).

{This section is for paid subscribers only}
Technical
There are still no warning flags in the long-term technical situation:
- The 8-month MA remains above the 12-month MA.
- The RSI is rising.
- The S&P 500 has bounced off the 8-month MA.
- The MACD continues to diverge away from a bear cross-over.
- The ADX +DI has started to turn back up, and the -DI has started to turn back down.
- The stochastic has turned up.
This pattern is similar to what happened during the 1998–2000 trading period (pink rectangles on the chart below). The only worry we have is that the ADX trend strength (black curve) has reached the down-sloping trend-line (dashed blue-line) which has acted as a turning point for the trend strength in the past. This indicator can, however, continue to rise above the blue dashed-line like it did in 1998 (chart below).

{This section is for paid subscribers only}
Fundamentals
The 10-year minus the 2-year Treasury rate differential decreased this week, but its overall slope continues unchanged. At this pace, inversion would happen the end of this year, or early in 2019. Inversions lead recessions by between 6-and-18-months, making the Spring of 2019 as the earliest likely start date for a bear market (chart below).

{This section is for paid subscribers only}
Corporate profits continue to increase. No warning flags here.

SHOP
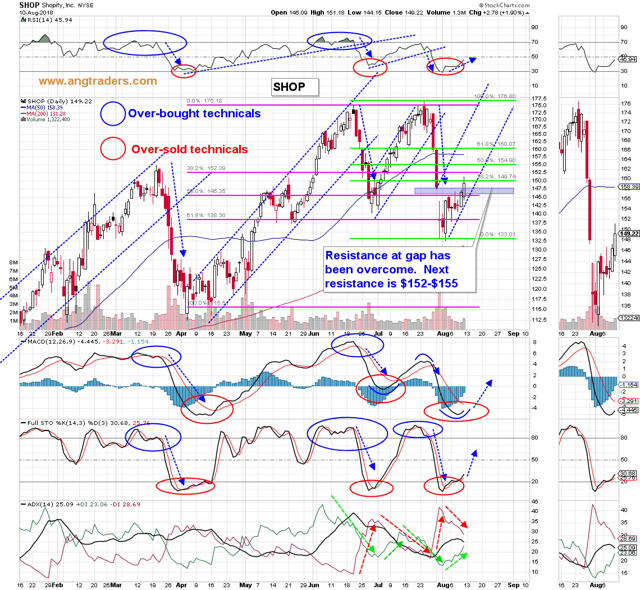
SHOP is coming off of over-sold technical conditions. Resistance at the gap has been overcome, but there is resistance at $152-$155. We may add to our long position above $155.
OLED
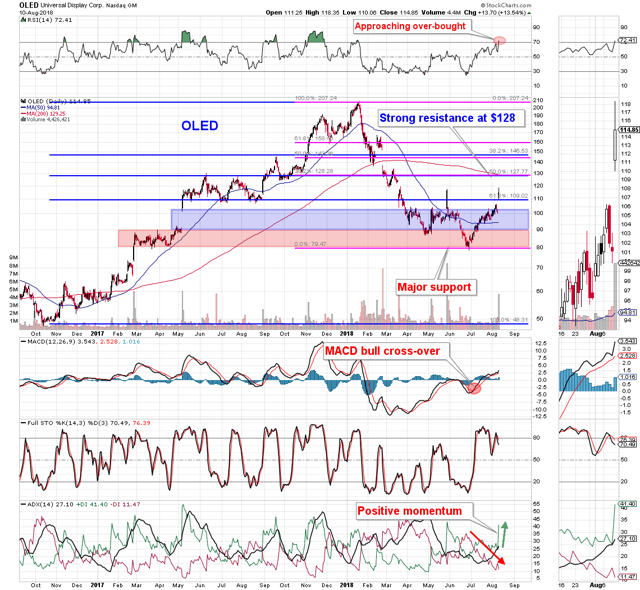
OLED jumped above resistance at $110 following results on Friday. Technically, it remains bullish, but there is significant resistance at around $130. We will continue to hold.
QRTH, as expected, did not react to the Q2 earnings on Thursday. The main focus continues to be the WiLAN division’s $145 million jury-imposed settlement with Apple. As of this writing, there has been no news regarding the results of the court-imposed mediation. Apple (being Apple) intended to appeal, but there is a chance that the mediation may change that. This could have a significant impact on the share price of QRTH which is our largest holding (10%).
Gold
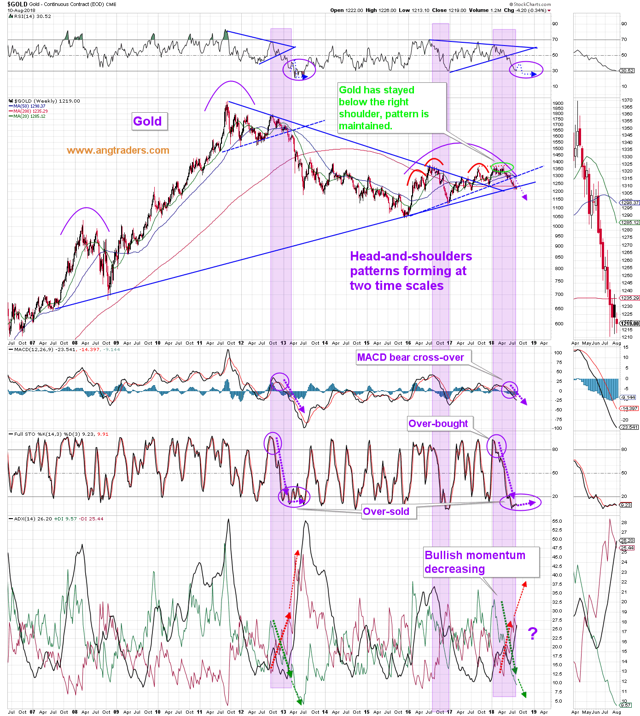
On a long-term weekly time-scale, the situation remains the same as last week; the current pattern is very similar to 2013:
- The RSI has dropped below the rising trend-line and is almost over-sold.
- The 20-week MA has crossed under the 50-week MA.
- The gold price remains below its 200-week MA.
- The MACD has completed a bear cross-over and continues dropping.
- The stochastic remains at over-sold levels.
- The ADX -DI is increasing, as is its momentum, while the +DI is decreasing.
In addition to the 2013 similarities, today’s pattern has some unique features: the head-and-shoulders pattern has been maintained, the 200-week MA has been breached, and the long-term upward-sloping trend-line has also been breached
If the pattern similarity continues, then further weakness in the gold price is to be expected in the medium-term (chart below).
{This section is for paid subscribers only}
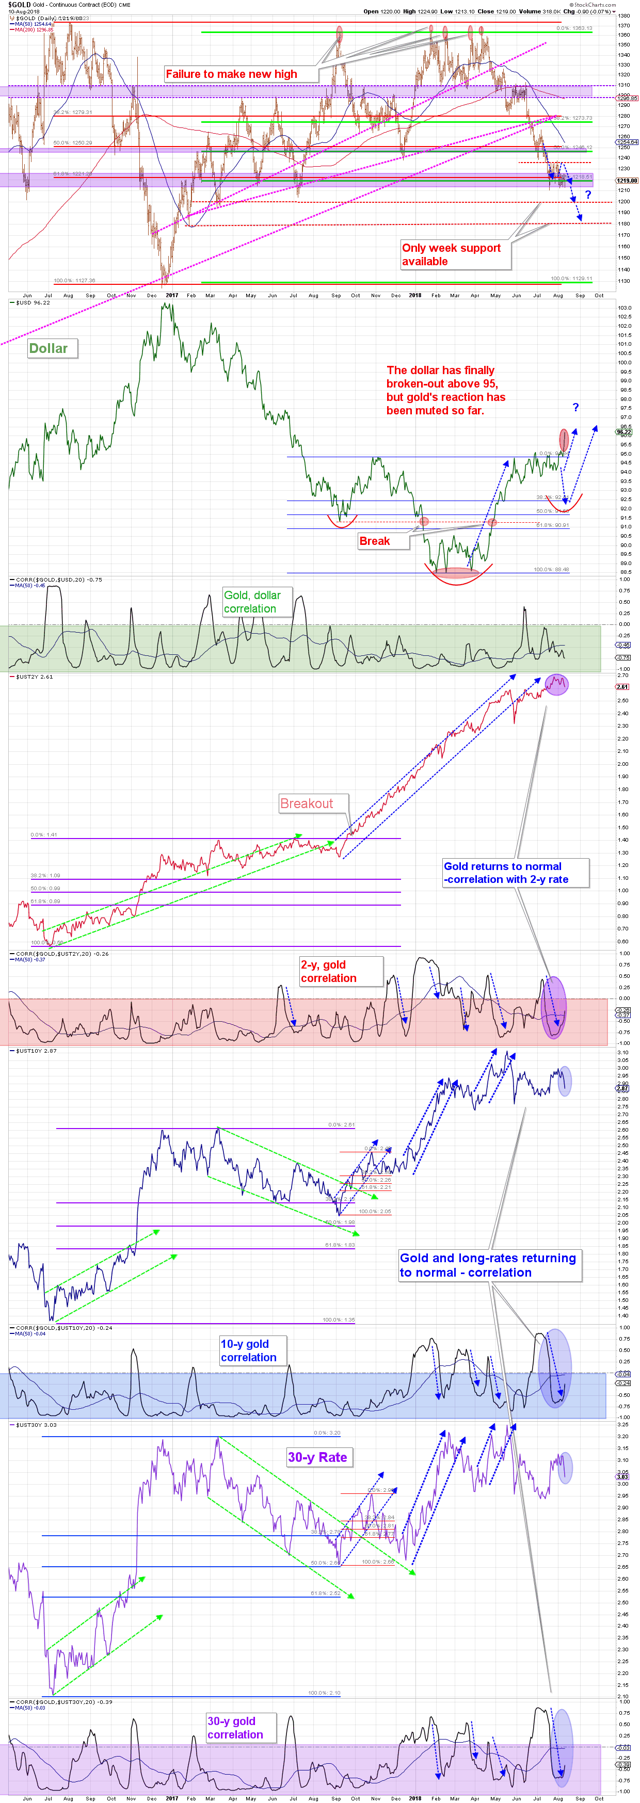
The dollar has finally broken above 95, but gold’s reaction was muted. Interest rates dropped slightly which may have influenced the muted response in gold.
{This section is for paid subscribers only}
We wish our subscribers a profitable week ahead.
ANG Traders
Join us at www.angtraders.com and profit from our 40-years of market experience.
Source: Nicholas Gomez


