



First a Dip, Then a Melt-Up


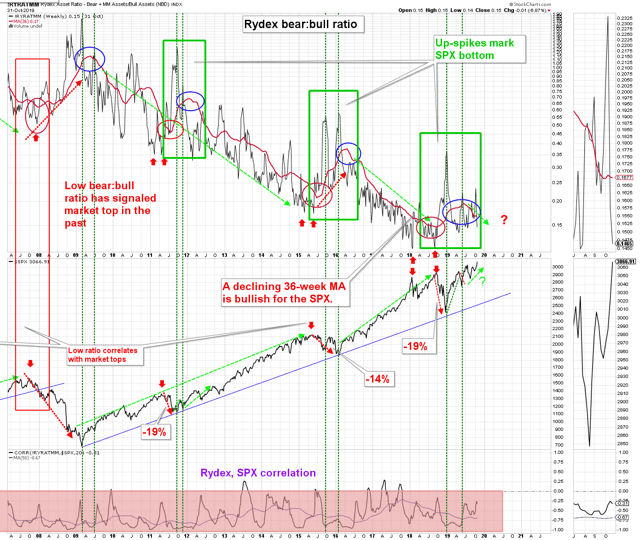
The Rydex bear:bull fund asset allocation ratio correlates inversely with the SPX. The 36-week MA of the ratio rises during pullbacks in the SPX, and drops during rallies. The blue ovals on the chart below, highlight when the SPX has bottomed and is starting to rally. The green rectangles, outline the pattern of “twin peaks” or up-spikes in the nominal weekly ratio. Notice that, similar to 2011 and 2015–16, the nominal ratio has made two up-spikes and the 36-wk MA is rolling-over (blue ovals). This implies we are close to the start of another major up-leg in the market (chart below).
Taking a closer look, we notice that short-term minor lows in the nominal bear:bull ratio (red ovals) correspond to short-term highs in the SPX. This increases the probability of a pullback in the SPX over the next 5–10 trading-days (chart below).
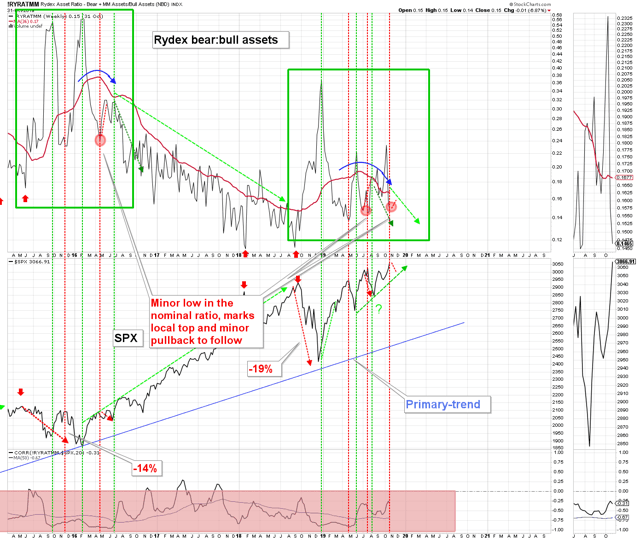
We are expecting a pause/dip, followed by a major move higher.
ANG Traders
Join us at www.angtraders.com for as little as $13.30/month, and benefit from our 40-years of market experience.
Source Nicholas Gomez


