


Updated on September 17th, 2019 by Nate Parsh
The Aerospace & Defense ETF (ITA) has returned more than 31% year-to-date and more than 105% over the past five years. Over this same period of time, The S&P 500 has increased 20% and 50%, respectively. Investing in companies in this sector has been a winner for shareholders.
With this in mind, we created a downloadable spreadsheet that focuses on defense stocks. The list was derived from two major defense industry-focused exchange traded funds, iShares Dow Jones U.S. Aerospace & Defense (ITA) and SPDR S&P Aerospace & Defense ETF (XAR).
You can download an Excel spreadsheet of all Defense stocks (with metrics that matter) by clicking the link below:
You can see a preview of the spreadsheet in the table below:
| MRCY | Mercury Systems, Inc. | 81.23 | 0.0 | 4,505 | 83.2 | 0.0 | 1.26 |
| AJRD | Aerojet Rocketdyne Holdings, Inc. | 51.06 | 0.0 | 4,017 | 23.2 | 0.0 | 0.89 |
| TDY | Teledyne Technologies, Inc. | 314.76 | 0.0 | 11,450 | 31.4 | 0.0 | 0.98 |
| BWXT | BWX Technologies, Inc. | 59.80 | 1.1 | 5,692 | 27.9 | 30.8 | 0.85 |
| NOC | Northrop Grumman Corp. | 363.68 | 1.4 | 61,533 | 17.7 | 23.9 | 0.81 |
| ARNC | Arconic, Inc. | 27.09 | 0.7 | 11,924 | 30.0 | 22.1 | 1.15 |
| GD | General Dynamics Corp. | 189.96 | 2.1 | 54,868 | 16.7 | 34.3 | 0.94 |
| LHX | L3Harris Technologies, Inc. | 207.45 | 1.3 | 46,173 | 25.8 | 34.1 | 0.63 |
| CW | Curtiss-Wright Corp. | 132.48 | 0.5 | 5,660 | 19.5 | 9.1 | 1.03 |
| TDG | TransDigm Group, Inc. | 519.82 | 0.0 | 27,745 | 38.9 | 0.0 | 1.24 |
| LMT | Lockheed Martin Corp. | 384.86 | 2.2 | 108,683 | 18.6 | 41.6 | 0.77 |
| HXL | Hexcel Corp. | 81.78 | 0.7 | 6,958 | 23.4 | 17.2 | 0.96 |
| UTX | United Technologies Corp. | 138.06 | 2.1 | 119,134 | 22.3 | 46.9 | 1.06 |
| RTN | Raytheon Co. | 198.72 | 1.8 | 55,342 | 18.3 | 33.3 | 0.79 |
| SPR | Spirit AeroSystems Holdings, Inc. | 84.57 | 0.6 | 8,733 | 13.0 | 7.4 | 0.99 |
| HEI | HEICO Corp. | 125.64 | 0.1 | 16,854 | 54.1 | 5.6 | 0.95 |
| BA | The Boeing Co. | 379.76 | 2.0 | 213,694 | 43.7 | 86.7 | 1.15 |
| HII | Huntington Ingalls Industries, Inc. | 218.31 | 1.5 | 9,023 | 13.5 | 20.4 | 0.98 |
| TXT | Textron, Inc. | 51.40 | 0.2 | 11,828 | 10.3 | 1.6 | 1.25 |
| AAXN | Axon Enterprise, Inc. | 65.11 | 0.0 | 3,858 | 255.4 | 0.0 | 1.26 |
| KTOS | Kratos Defense & Security Solutions, Inc. | 20.69 | 0.0 | 2,168 | 161.8 | 0.0 | 1.30 |
| CUB | Cubic Corp. | 71.46 | 0.4 | 2,234 | 76.1 | 28.7 | 1.04 |
| AVAV | AeroVironment, Inc. | 60.88 | 0.0 | 1,459 | 38.4 | 0.0 | 1.16 |
| TGI | Triumph Group, Inc. | 25.16 | 0.6 | 1,267 | -5.5 | -3.5 | 1.42 |
| AIR | AAR Corp. | 45.42 | 0.7 | 1,592 | 225.5 | 149.0 | 1.13 |
| MOG.A | Moog, Inc. | 88.20 | 1.1 | 3,095 | 17.7 | 20.0 | 1.29 |
| NPK | National Presto Industries, Inc. | 95.61 | 6.3 | 668 | 19.2 | 120.3 | 0.71 |
| WAIR | Wesco Aircraft Holdings, Inc. | 10.99 | 0.0 | 1,092 | 26.1 | 0.0 | 1.01 |
| ATRO | Astronics Corp. | 31.10 | 0.0 | 1,016 | 8.7 | 0.0 | 1.32 |
| HEIA | HEICO Corporation | 98.02 | 0.0 | 6,616 | 0.00 | ||
| ROLL | RBC Bearings, Inc. | 165.17 | 0.0 | 4,165 | 37.3 | 0.0 | 1.18 |
| MOGA | Moog Inc. | 88.59 | 0.0 | 0 | 0.00 | ||
| RGR | Sturm, Ruger & Co., Inc. | 44.25 | 2.5 | 770 | 18.9 | 48.1 | 0.60 |
| Ticker | Name | Price | Dividend Yield | Market Cap ($M) | P/E Ratio | Payout Ratio | Beta |
Is there more room for these stocks to run going forward? This article will look at the top 8 stocks in the aerospace and defense sector.
We rank these 8 companies by our expected total annual return estimate over the next five years, which is a combination of future earnings-per-share growth, current dividend yield , and the impact of multiple expansion or contraction.
Table of Contents
- United Technologies (UTX)
- Huntington Ingalls Industries Inc. (HII)
- Raytheon Company (RTN)
- General Dynamics (GD)
- L3Harris Technologies (LHX)
- Northrop Grumman (NOC)
- Lockheed Martin (LMT)
- Textron, Inc (TXT)
Defense Stock #8: United Technologies
- Estimated Total Annual Return through 2024: 2.7%
United Technologies is a commercial aerospace and defense company. This is a period of great change for United Technologies–it expects to spin-off its Otis and Climate, Controls and Security businesses into two separate independent companies sometime in 2020. And, United Technologies also closed on its $30 billion purchase of Rockwell Collins on 11/26/2018.
After the announced spin-offs are completed, the company will be composed of two segments: Pratt & Whitney, which manufactures and services engines for commercial and military customers, and Collins Aerospace Systems, which creates aerospace and industrial products. United Technologies was founded in 1934 and has a market capitalization of $119 billion today. The company generated $66.5 billion in sales last year.
It was announced on 6/9/2019 that the remaining United Technologies businesses would merge with fellow aerospace and defense company Raytheon Company. The deal is expected to close after the Otis and CCS spin-offs in the first half of 2020.
The combined company will be named Raytheon Technologies Corporation and will exclude United Technologies’ upcoming spin offs of Otis and Carrier. The merger of Raytheon and United Technologies is expected to take place following these previously announced spin offs in the first half of 2020.
Under the merger agreement, legacy Raytheon shareholders will receive 2.3348 shares in the combined company. Investors holding shares of United Technologies will own approximately 57% of the combined company while legacy Raytheon shareholders will own approximately 43% of the combined company.
The two companies are projected to generate $74 billion in sales in 2019 and will capture more than $1 billion in gross annual run-rate cost synergies by year four after closing. The new company also expects to return $18 billion to $20 billion of capital to shareholders within the first three years following the transaction’s close. The combined company will have net debt of $26 billion, with the legacy United Technologies business contributing approximately $24 billion.
Following the merger, Raytheon Technologies Corporation will be the third largest commercial company and the second largest provider of defense products in the world. Pro forma sales for 2019 are expected to be ~$74 billion.
United Technologies reported second quarter earnings results on 7/23/2019. The company earned $2.20 per share, topping estimates by $0.15 and growing nearly 11.7% from the prior year’s second quarter. Revenue grew 17.5% to $19.6 billion, which was $51 million more than expected. Organic sales grew 6% for the quarter.
The Otis segment had 4% organic sales growth. Service sales improved 5%, but new equipment orders were down 6%.
Following second quarter results, United Technologies issued updated guidance.

Source: Second Quarter Results Presentation, slide 1.
The company now expects earnings-per-share of $7.90 to $8.05 for 2019, up from $7.80 to $8.00 previously. The low end for organic sales growth was also increased.
United Technologies has seen earnings-per-share grow at a rate of 6.3% from 2009 through 2018. Earnings declined during the last recession and it took the company until 2011 to make a new high. We anticipate 3% annual growth through 2024.
Following a 5% dividend increase for the payment made 12/10/2018, United Technologies has now increased its dividend for the past 25 years, the second longest dividend growth streak on this list. This qualifies the company as a Dividend Aristocrat. Dividend Aristocrats are a group of 57 stocks in the S&P 500 Index, with 25+ consecutive years of dividend growth. You can view all 57 Dividend Aristocrats here.
The company has increased its dividend at an annual average of 6.2% over the last 10 years. Shares yield 2.1% at the moment. The annualized dividend of $2.94 represents a payout ratio of 37% of expected earnings for 2018.
Using the current share price of $138 and expected earnings-per-share of $7.98, the stock trades with a P/E ratio of 17.3. Reverting to our target P/E ratio of 15.3 by 2024 would reduce returns by 2.4% each year over this period of time.
Expected total annual returns would consist of the following:
- 3.0% earnings growth
- 2.1% dividend yield
- 2.4% multiple reversion
In total, United Technologies is forecasted to return just 2.7% per year through 2024. While the stock has one of the highest dividend yields on this list, it also has one of the lowest earnings growth rates. We feel that investors are better off investing elsewhere in the defense sector and rate shares of the company as a sell.
Defense Stock #7: Huntington Ingalls Industries Inc.
- Estimated Total Annual Return through 2024: 5.2%
Up until 2011, Huntington Ingalls Industries was a division within Northrop Grumman. The company was spun off in March of that year.
Huntington Ingalls builds nuclear and non-nuclear ships for the U.S. Department of Defense. Huntington Ingalls is composed of three segments: Newport News Shipbuilding – which builds nuclear powered aircraft carriers and submarines, Ingalls Shipbuilding – which produces surface combat ships, amphibious assault ships and Coast Guard cutters, and Technical Solutions – which provides fleet maintenance, modernization, IT support, nuclear management and operations, and oil and gas engineering.
Huntington Ingalls had $8.1 billion in sales last year. The company has a current market capitalization of $9 billion today.
Huntington Ingalls released second quarter earnings results on 8/1/2019.
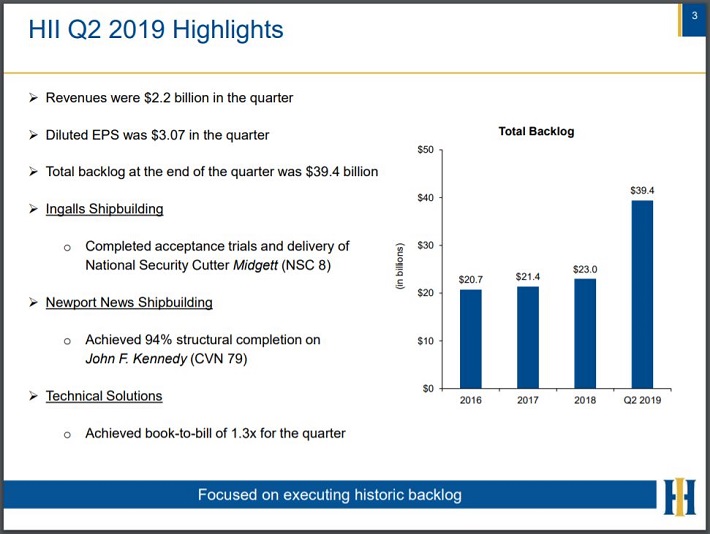
Source: Second Quarter Results Presentation, slide 3.
The company earned $3.07 per share, which was $0.48 below estimates and a 43% drop from the prior year. Revenue improved 8.3% to $2.2 billion. This was $54 million above estimates.
The decline in earnings was due to lower segment operating income and an unfavorable change in a non-operating retirement benefit. A higher effective income tax rate compared to the second quarter of 2018 also factored in the EPS decline.
Ingalls Shipbuilding had a 1.1% drop in revenues and a 14% decline in operating income. Lower revenues in the Legend-class cutter program and amphibious assault ships were the reasons for this weakness.
Newport News Shipbuilding had revenue growth of 7.1%, but suffered a 23% decrease in operating income. This segment saw higher revenues due to increased volumes for aircraft carriers and naval nuclear support services which were offset by lower submarine revenues. Operating income was down due to lower volumes in the Virginia class submarine program.
Huntington Ingalls is expected to earn $14.52 per share in 2019. The company has been profitable every year except for 2011. Growth since then has been somewhat erratic, but this is due to Huntington Ingalls’ “big-ticket” products. We anticipate earnings growth of 5% annually through 2024.
Huntington Ingalls has increased its dividend every year since 2012. Increases have been very aggressive; the dividend has compounded at an annual rate of almost 25% over the past five years. The stock offers a 1.6% yield as of the most recent trading session. Huntington Ingalls’ annualized dividend is $3.44. Based on of expected earnings-per-share for 2019, the payout ratio is less than 24%.
Much like its former parent company, Huntington Ingalls has made repurchasing shares a priority. The share count was 41.7 million at the end of the most recent quarter, down from 49.4 million shares in 2011.
Huntington Ingalls has a stock price of $218. Based on of our estimates for earnings-per-share of $14.52 for this year, the stock has a P/E ratio of 15. The average P/E since 2012 is slightly more than 14. If the stock were to revert to this average by 2024, the corresponding multiple contraction would be a 1.4% headwind to total annual returns.
Returns for Huntington Ingalls over the next five years would consist of the following:
- 5.0% earnings growth
- 1.6% dividend yield
- 1.4% multiple reversion
We forecast that Huntington Ingalls can offer a total annual return of 5.2% over the next five years. Unlike many of the larger defense contractors on this list, Huntington Ingalls focuses entirely on aquatic military products. This has helped the company to carve out a niche business for itself. That being said, shares are pricey at the moment and we rate the stock as a hold.
Defense Stock #6: Raytheon Company
- Estimated Total Annual Return through 2024: 5.2%
As mentioned previously, Raytheon and United Technologies have entered a merger agreement. But the deal is not yet official and still needs final regulatory approval. There is at least a chance that the deal will not be completed, and therefore we are including the stock in this list in the event the merger does not go through.
Raytheon Company is composed of five business units: Integrated Defense Systems, which manufactures missile defense products; Intelligence & Information Systems, which provide services, training, engineering and logistics; Missile Systems, which produces munitions and missiles; Space & Airborne Systems, which provides airborne radars and sensors; and Forcepoint, a cyber security business.
Raytheon has a market capitalization of $55 billion and generated $27 billion in sales in 2018. Raytheon reported second quarter results on 7/25/2019.
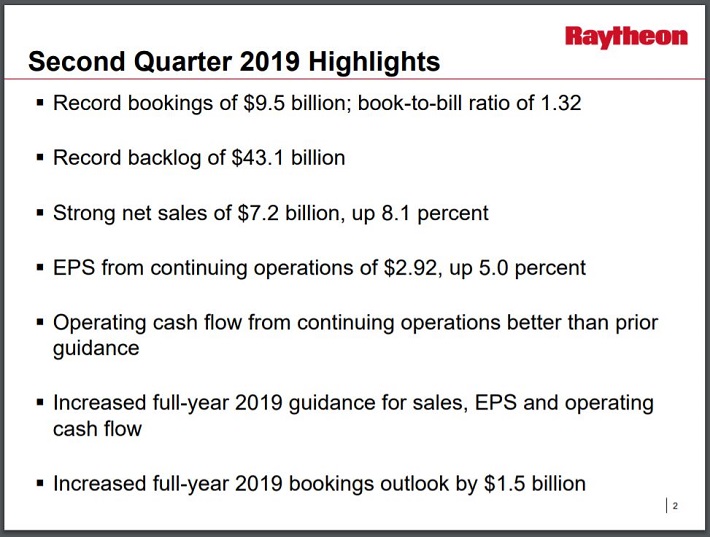
Source: Second Quarter Results Presentation, slide 2.
The company earned $2.92 per share, which beat estimates by $0.26 and increased 19% from the previous year. Revenue grew 8.1% to $7.2 billion, topping estimates by $140 million.
Integrated Defense Systems had sales growth of 8% for the quarter. Higher net sales for the international Patriot program was the primary driver of growth.
Meanwhile, Intelligence, Information & Services saw a 5% increase in sales, mostly due to higher volumes of classified programs in the areas of cyber and space. Missile Systems revenue increased 8%, and Space & Airborne Systems grew 13% due to improvements in demand for classified, infrared and radar programs.
On the strength of second quarter results, Raytheon now expects earnings-per-share to range from $11.50 to $11.70 for 2019, up from earlier guidance of $11.40 to $11.60. The company increased earnings at a rate of 7.6% over the last 10 years. We feel a growth rate of 6% is more likely going forward as earnings growth really accelerated in recent years. We feel that growth is likely to moderate going forward.
Raytheon, after increasing its dividend 8.7% for the 5/9/2019 payment, has now increased its dividend for 15 years in a row. Over the last decade, the dividend has climbed at an annual rate of 10.6%. The stock has a current yield of 1.9% and the annualized dividend of $3.77 would consume just 33% of expected earnings for the year.
Based on the current share price of $199 and the revised midpoint for earnings-per-share guidance for the year, Raytheon trades with a multiple of 17.2x earnings. We feel a P/E ratio of 15, slightly higher than the decade long average, is appropriate given the strength of the company’s business. If the stock were to trade with this multiple by 2024 then valuation will be a 2.7% headwind to annual returns over this time.
Raytheon’s expected total annual returns would be made up of the following:
- 6.0% earnings growth
- 1.9% dividend yield
- 2.7% multiple reversion
If the RTN-UTX merger does not succeed, we believe Raytheon as an independent stock would return 5.2% per year over the next five years. The company’s products continue to perform well, but we feel that the expected return isn’t enough to justify a buy recommendation at this time.
Defense Stock #5: General Dynamics
- Estimated Total Annual Return through 2024: 5.6%
General Dynamics operates four business divisions: Aerospace, which produces the high-end Gulf Stream private jet; Combat Systems, which makes combat vehicles like the Abrams battle tank; Information Systems & Technology, which provides fire-control systems for ships as well as programs for cyber security; Marine Systems, which manufacturers ships and submarines for the Navy; and Mission Systems, which produces programs used in Space, Intelligence and Cyber Systems.
General Dynamics has a current market cap of $55 billion and produced more than $36 billion in sales last year
General Dynamics reported second quarter earnings results on 7/24/2019.
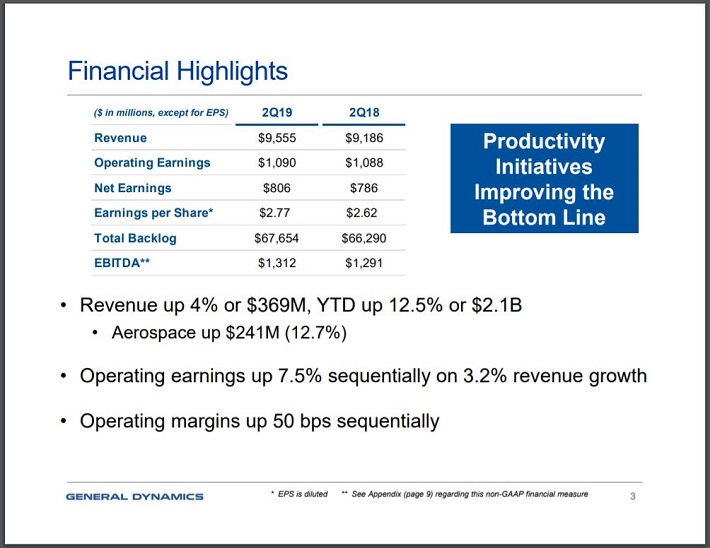
Source: Second Quarter Earnings Release Presentation, slide 3.
The company earned $2.77 per share, $0.06 higher than expected and a 5.7% increase from the previous year. Revenue was higher by 4% to $9.6 billion.
Aerospace sales improved 12.7% as the company delivered 31 Gulf Stream jets in the second quarter compared to 26 deliveries a year ago. The company’s G600 jet received certification from the FAA on 6/28/2019. The company said that demand for jets was broad amongst different customer industries.
Combat systems had revenue growth of 8.1% due to higher than expected growth in the M-1 Abrams tank production. General Dynamics also saw increased demand for munitions and armaments.
Marine Systems sales grew 7.2%. General Dynamics was also awarded two large contracts during the quarter. The first was a $495 million contract for a Columbia-class development and industrial base from the U.S. government. The company also received a $270 million award for a missile compartment work under joint development with the U.K. Royal Navy.
Sales for the Information Technology division declined 9% year-over-year, but were stable from the first quarter of 2019. This division had a book-to-bill ratio of 1.2x and a 6% increase in backlog. The total estimated contract value rose 7.2% to $26.8 billion for this division.
Mission Systems grew 11.3% due to strength in space, intelligence and cyber systems. Mission Systems partners with the Information technology division to cross-sell high performance computing solutions.
General Dynamics raised its guidance range for 2019 for earnings-per-share to $11.85 to $11.90 from $11.60 to $11.70. The company compounded earnings at a rate of 6.1% over the last decade. We feel that the company is capable of annual growth of 6% through 2024.
General Dynamics has increased its dividend for 28 years in a row, giving the company the longest dividend growth streak on this list. The company raised its dividend at an annual of 9.5% from 2009 through 2018. Consistent with this, General Dynamics raised its dividend 9.7% for the May 2019 payment. The stock currently offers a 2.2% yield. The annualized dividend of $4.08 is slated to consume just 34% of expected earnings-per-share for the year.
Using the midpoint of guidance for the year of $11.88, the stock has a current P/E ratio of 16. We feel 14x earnings is more appropriate as this is closer to the stock’s 10-year average valuation. If the stock trades at this P/E ratio by 2024, the multiple contraction would reduce annual returns by 2.6% during this period.
Therefore, total returns would consist of the following:
- 6.0% earnings growth
- 2.2% dividend yield
- 2.6% multiple reversion
General Dynamics is expected to return 5.6% annually over the next half decade. While we are impressed by the company’s dividend growth track record, the mid-single digits projected growth earns shares of General Dynamics a hold recommendation.
Defense Stock #4: L3Harris Technologies
- Estimated Total Annual Return through 2024: 5.7%
On June 9th, L3 Technologies and Harris Corporation completed their previously announced merger. The combined entity is now the sixth largest defense contractor in the world. For every share of L3 Technologies that they owned, shareholders received 1.30 shares of Harris Corporation.
The company has four components: Integrated Mission Systems, Communication Systems, Space & Airborne Systems and Aviation Systems. The majority of L3Harris’ sales come from the U.S. government and other defense contractors. The company had pro forma sales of $16 billion last year. The stock has a current market capitalization of $46 billion.
L3Harris reported pro forma combined earnings results for the second quarter on 7/31/2019.
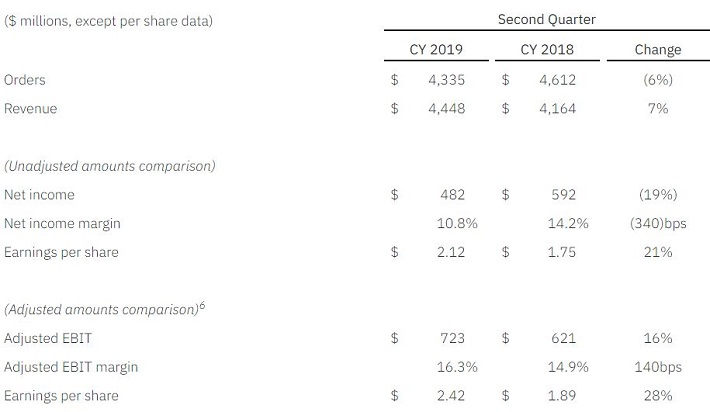
Source: L3Harris’ Second Quarter Results Press Release.
Second quarter adjusted earnings-per-share from continuing operations came to $2.44, a 39% increase from the previous year. Revenue grew 7% to $4.5 billion.
Communication Systems tactical orders grew 23% due to strength in both U.S. and international demand for modernized products. Public Safety orders improved 30% last quarter.
The Electronic Systems segment had 14% growth, as all three businesses saw increase in demand. Volumes for the F-35, F/A-18 and F-16 programs were all higher year-over-year.
Space & Intelligence Systems grew 8%. Double-digit growth from classified programs, especially in the areas of small satellites, exquisite systems and next-generation technology programs, accounted for much of the increase.
L3Harris expects earnings-per-share of $9.60 to $9.70 for the year. L3Harris has only been a combined company for a short time, but we feel that the new company can grow earnings-per-share by 10% annually over the next half-decade.
The company increased its dividend 9.5% for the September 2019 payment. This latest increase is slightly below the 10-year average increase of 11%. The stock has a current yield of 1.4%. Based on expected earnings and the annualized dividend of $2.74, L3Harris has a payout ratio of 28%.
Using the midpoint for 2019 guidance of $9.65, the stock has a P/E ratio of 21.5. This is the highest valuation of all of the companies on this list. If shares were to trade at our target P/E ratio of 16 by 2024, then valuation would be a 5.7% headwind to annual returns.
Total returns for L3Harris would be made up of:
- 10% earnings growth
- 1.4% dividend yield
- 5.7% multiple reversion
We anticipate that L3Harris will generate an annual return of 5.7% over the next five years. While the company’s expected growth rate is tied for the highest on this list, we find that the stock’s valuation has gotten ahead of itself. We maintain our hold recommendation on shares of L3Harris.
Defense Stock #3: Northrop Grumman
- Estimated Total Annual Return through 2024: 7.2%
Northrop Grumman was founded as Northrop Aircraft in 1939. The company’s first aircraft was a patrol bomber for the Norwegian Air Force. Northrop Aircraft’s iconic B-2 stealth bomber took its first flight in 1989. In 1994, Northrop purchased Grumman Corporation, which provided the Lunar Module that landed on the moon in 1969.
After completing its acquisition of Orbital ATK, the largest supplier of munitions to the U.S. government, in June of 2018, Northrop Grumman is now made up of four reporting divisions. Aerospace includes manned aircraft such as the F-35 and B-2 as well as unmanned aircraft such as the Global Hawk. Missions Systems produces radars, sensors and surveillance and targeting systems.
Meanwhile, the Technology segment provides customers with IT solutions and cyber security programs, and Innovation Systems produces systems used in missile defense, space and hypersonics programs.
Today, Northrop Grumman has a market cap of $61.5 billion and generated more $30 billion in sales in 2018.
Northrop Grumman released second quarter earnings results on 7/24/2019.
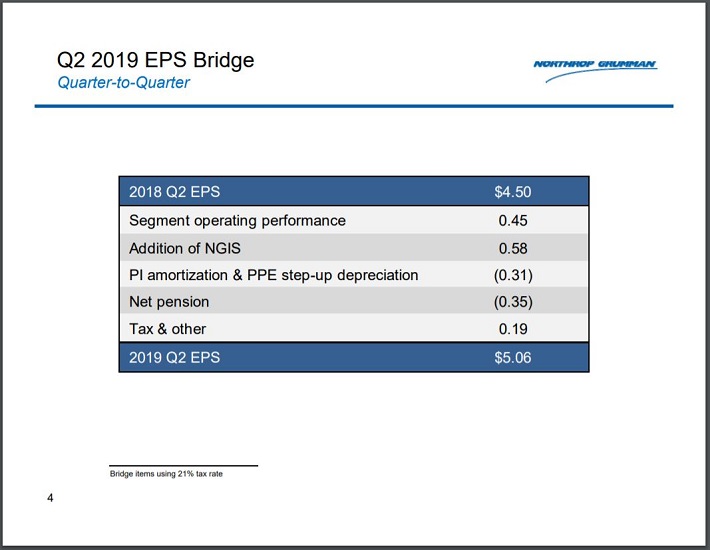
Source: Second Quarter Earnings Release Presentation, slide 4.
Earnings-per-share grew 12.4% year-over-year to $5.06. This was $0.41 above analysts’ estimates. Revenue grew 18.8% to $8.5 billion, which was $40 million above estimates.
Aerospace sales were higher by 2% due to increased volumes for manned aircraft and space programs. Demand for the F-35 program was especially strong during the quarter.
Pro-forma sales for the Innovation Systems division improved 8%. Flight and defense systems saw an uptick in demand. Sales for Mission Systems improved 9% as the entire division saw growth. Radars and restricted programs were the primary contributors to this growth.
Northrop Grumman offered revised guidance for the year and now expects earnings-per-share in a range of $19.30 to $19.55 in 2019. We expect that the company will be able to compound earnings-per-share growth by 10% annually through 2024.
Northrop Grumman has increased its dividend for the past 16 years. The company has increased its dividend with a compound annual growth rate of 11.6% over the past five years. Shares yield 1.5% at the moment, but Northrop Grumman has a very low payout ratio. The annualized dividend of $5.28 represents a payout ratio of just 27% of the midpoint for expected earnings-per-share for 2019.
In addition to dividends, Northrop Grumman has returned a tremendous amount of capital to shareholders in the form of stock buybacks. The company reduced its share count at an annual rate of 5.7% from 2009 through 2018. This growth is likely to slow as the company pays down debt related to the Orbital ATK acquisition.
Using expected earnings-per-share of $19.43, the stock has a P/E ratio of 18.7. We feel a 2024 target P/E ratio of 15 is appropriate, given the strength of the business and the Orbital ATK purchase. If shares were to trade at this multiple by 2024, the corresponding impact would reduce annual returns by 4.3% over this period of time.
Annual returns for Northrop Grumman would therefore consist of the following:
- 10% earnings-per-share growth
- 1.5% dividend yield
- 4.3% multiple reversion
Northrop Grumman is anticipated to return 7.2% per year over the next five years. The company has a high expected growth rate and has a long history of returning capital to shareholders through dividends and buybacks. We feel that the Orbital ATK acquisition was an excellent addition to the company. We rate shares of Northrop Grumman as a hold, but would be more interested in the stock if it were to pullback.
Defense Stock #2: Lockheed Martin
- Estimated Total Annual Return through 2024: 7.6%
Created when Lockheed Corporation and Martin Marietta merged in 1995, Lockheed Martin is the world’s largest defense contractor. The company had nearly $54 billion in sales in 2018, with the U.S. Department of Defense contributing 60% of this total. Other U.S. government agencies and international clients make up about 20% each of remaining sales. The stock trades with a market capitalization of $109 billion.
Lockheed Martin consists of four divisions. Aeronautics produces fighter aircraft like the F-35, while Rotary and Mission Systems houses combat ships and naval electronics. Missiles and Fire Control operations create missile defense systems, while the Space Systems segment produces satellites.
In 2015, the company purchased Sikorsky Aircraft, which produces Black Hawk helicopters, from United Technologies for $9 billion.
Lockheed Martin reported second quarter earnings results on 7/23/2019.
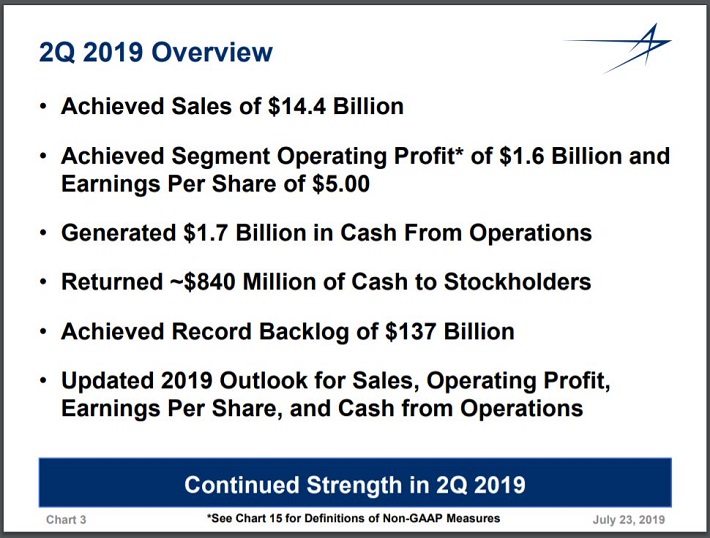
Source: Second Quarter Earnings Release Presentation, slide 4.
Lockheed Martin earned $5.00 per share, which topped estimates by $0.26 and represented 23.4% growth from the previous year. Sales grew 7.7% to $14.4 billion, which was $226 million more than expected.
All four divisions within the company reported growth. Aeronautics sales improved 4% due to higher production of the F-35 program along with an increases in development and sustainment contracts.
Missiles and Fire Control grew 16%, resulting from higher sales for classified programs as well as tactical and strike missiles. Growth in sensors for the Apache helicopters also aided sales growth.
Rotary and Mission Systems had sales growth of 6% on higher demand for integrated warfare systems and sensors programs. Another area of strength was the Space division, which grew sales by 11% on higher revenue from government satellite and strategic and missile defense programs.
Lockheed Martin expects to generate EPS in a range of $20.85 and $21.15 for the year. This is the second consecutive quarter that the company has increased its guidance for 2019. As the world’s largest defense contractor, Lockheed Martin has a size and scale that competitors cannot match.
Combined with stronger worldwide demand for defense products, Lockheed Martin could grow earnings-per-share by at least 8% annually over the next five years.
Lockheed Martin has increased its dividend for 16 consecutive years. The company gave shareholders a 10% dividend increase for the payment made 12/28/2018. This increase was slightly over the five-year average annual raise of 8.4%. The company is expected to payout $8.80 in dividends-per-share this year. Using the midpoint for earnings guidance, this equates to a payout ratio of just 42%. Shares yield 2.3%, giving Lockheed Martin the highest yield on this list.
Using the expected midpoint for earnings-per-share for the year of $21, Lockheed Martin stock trades with a P/E ratio of 18.3. This is above our target P/E ratio of 16. If shares were to revert to this level by 2024, then valuation would be a 2.7% headwind to annual returns over this period of time.
Total annual returns would be made up of the following:
- 8.0% earnings growth
- 2.3% dividend yield
- 2.7% multiple reversion
Added up, we believe Lockheed Martin can return 7.6% annually through 2024. We rate shares as a hold, but would recommend Lockheed Martin as a buy if the stock were to pullback from current levels to push its expected returns closer to 10%.
Defense Stock #1: Textron, Inc.
- Estimated Total Annual Return through 2024: 13.2%
Textron is a diversified aerospace, defense and industrial conglomerate. The company is composed of five business divisions: Textron Aviation, Bell Helicopter, Textron Systems, Industrial and Finance. The Textron Aviation and Bell Helicopter divisions contribute ~60% of sales.
Textron develops and manufactures military and civilian aircraft, military munitions, recreational vehicles and engines. Major brands include Bell, Cessna, Beechcraft, Hawker, Lycoming, Arctic Cat, Cushman and EX-GO. Textron has a market cap of $11.8 billion, with annual revenues of $14 billion.
Textron reported second quarter earnings results on 7/17/2019.
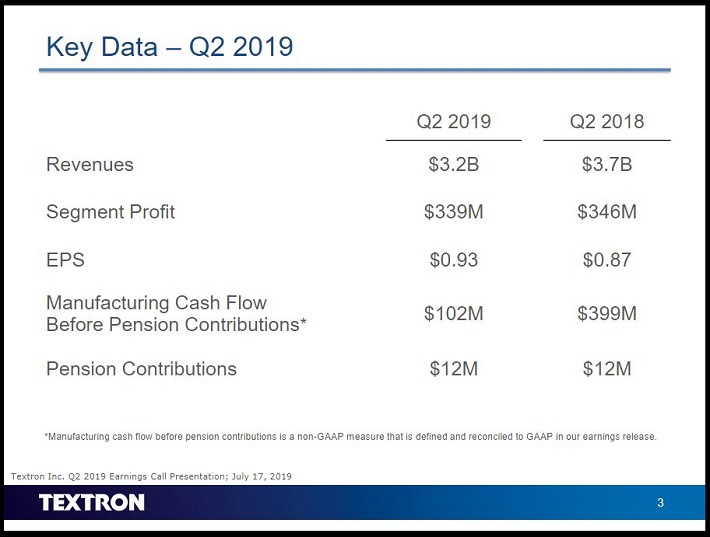
Source: Second Quarter Results Presentation, slide 3.
Textron’s earnings-per-share totaled $0.93 in the quarter, $0.07 above consensus estimates and a 7% improvement from the second quarter of 2018. Revenue declined 13.4% to $3.2 billion, which was $200 million lower than expected. The majority (10%) was due to organic sales declines. Divestitures lowered results by 2.9% while foreign exchange contributed the remainder of the decline.
Each segment contributed to the decline. Textron Systems was the largest drag on results, with revenue declining 18.9% on lower volumes.
Textron Aviation was down 12% due to lower jet and commercial turboprops deliveries. Delivers for jets declined to 46 from 48 a year ago while commercial turboprops deliveries decreased to 34 from 47. Bell Helicopter dropped 7.2% on lower military sales.
Lastly, accounting for divestitures, Industrial sales were lower by 8.4% to decreased volumes.
Through efficiency, operating margins increased 120 bps to 10.5% and the company spent $159 million on share repurchases during the quarter.
Textron raised both the low- and high-end ranges of its EPS guidance by $0.10. Earnings-per-share for the year are expected in a range of $3.65 and $3.85, and we expect earnings to grow at 8% annually over the next five years.
Unlike the other names on this list, Textron has not increased its dividend in quite some time. In fact, the company has paid the same $0.08 in yearly dividends every year since cutting it in 2009. Shares yield just 0.2%, the lowest yield on this list. Using expected earnings-per-share for the year, the payout ratio is just 2.1%. We do not believe that the company will grow its dividend in the coming years.
Using the midpoint for earnings guidance of $3.75, the stock has a P/E ratio of 13.6. Over the last decade, shares have an average P/E ratio of 18.5. We feel that a P/E ratio of 17 is a more appropriate target. If shares were to reach this level by 2024, multiple expansion would add 4.6% to annual returns.
Annual returns would consist of the following:
- 8.0% earnings growth
- 0.2% dividend yield
- 4.6% multiple expansion
Altogether, we believe that Textron is capable of offering a total annual return of 12.8% through 2024. While the company is experiencing difficulties throughout its business, we believe these trends will eventually reverse. Dividend growth investors might be disappointed with Textron, but shares are inexpensive compared to our target valuation. We rate Textron shares as a buy.
Final Thoughts
There is no question that defense stocks have among the hottest stocks in the market, in the years since the Great Recession ended. This has caused many stocks in this sector to reach valuations well above their historical average.
Of the eight stocks on this list, just one, Textron, has expected returns higher than 10%. While the sector could continue to perform well, we encourage investors to wait for a pullback in several of the stocks discussed in this article due to valuation concerns.