


Published on September 19th, 2019 by Aristofanis Papadatos
The September 16th strike on Saudi Arabia’s oil facilities sent oil prices skyrocketing as much as 15% in a single day. It was the biggest one-day jump in the past decade. While oil prices gave back some of the days over the next two days, oil prices still posted an impressive jump for the week.
With this in mind, we created a downloadable spreadsheet of oil stocks.
You can download our full Excel spreadsheet of oil stocks (with metrics such as P/E ratio, payout ratio, and dividend yield) by clicking the link below:
You can see a preview of the spreadsheet in the table below:
| AE | Adams Resources & Energy, Inc. | 29.80 | 3.0 | 126 | 40.5 | 122.4 | 0.31 |
| AETUF | ARC Resources Ltd. | 5.30 | 8.6 | 1,877 | 10.1 | 86.6 | 0.67 |
| AKT.A.TO | AKITA Drilling Ltd. | 1.62 | 0.0 | 65 | -3.2 | 0.0 | 0.20 |
| AKT.B.TO | AKITA Drilling Ltd. | 2.35 | 0.0 | 65 | -4.7 | 0.0 | -0.68 |
| AKTAF | Akita Drilling Ltd. | 1.15 | 22.3 | 45 | -2.8 | -61.6 | 0.40 |
| ALA.TO | ALA.TO - AltaGas Ltd. | 19.85 | 4.8 | 5,463 | 18.0 | 87.3 | 1.18 |
| AM | Antero Midstream Corp. | 7.70 | 9.6 | 3,903 | 21.4 | 204.8 | 1.09 |
| AMID | Third Coast Midstream LLC | 5.24 | 0.0 | 284 | -7.4 | 0.0 | -0.13 |
| ANDV | Andeavor | 0.00 | 0.0 | 0 | 0.00 | ||
| ANDX | Andeavor Logistics LP | 32.17 | 12.8 | 7,901 | 12.6 | 162.0 | 0.01 |
| ANW | Aegean Marine Petroleum Network Inc. | 0.00 | 0.0 | 0 | 0.00 | ||
| APA | Apache Corp. | 25.43 | 3.9 | 9,560 | -13.6 | -53.5 | 1.34 |
| APC | Anadarko Petroleum Corp. | 72.77 | 1.6 | 36,563 | -60.9 | -96.3 | 0.09 |
| AROC | Archrock, Inc. | 10.32 | 5.1 | 1,568 | 25.1 | 128.4 | 1.52 |
| ARX.TO | ARC Resources Ltd. | 7.30 | 8.2 | 2,478 | 10.7 | 88.2 | 1.51 |
| ATGFF | AltaGas Ltd. | 14.74 | 7.6 | 4,086 | 21.8 | 164.8 | 0.29 |
| BCHEY | Beach Energy Ltd. | 35.94 | 0.7 | 4,095 | 9.9 | 6.7 | 0.10 |
| BEPTF | Beach Energy Ltd. | 1.79 | 0.8 | 4,079 | 9.9 | 7.9 | 0.06 |
| BKEP | BlueKnight Energy Partners LP | 1.14 | 24.6 | 46 | -0.7 | -17.2 | 0.62 |
| BLMC | Biloxi Marsh Lands Corp. | 4.69 | 0.0 | 11 | -6.7 | 0.0 | 0.20 |
| BNE.TO | Bonterra Energy Corp. | 4.94 | 2.4 | 158 | 8.5 | 20.6 | 1.13 |
| BNEFF | Bonterra Energy Corp. | 3.75 | 17.2 | 125 | 29.6 | 507.9 | 0.71 |
| BNP.TO | Bonavista Energy Corporation | 0.67 | 5.3 | 180 | 7.8 | 41.0 | 1.98 |
| BNPUF | Bonavista Energy Corp. | 0.50 | 0.0 | 130 | 6.8 | 0.0 | 0.53 |
| BP | BP Plc | 38.59 | 6.3 | 129,881 | 14.6 | 92.1 | 0.61 |
| BPAQF | BP Plc | 6.35 | 6.6 | 128,232 | 7.3 | 47.7 | 0.28 |
| BPL | Buckeye Partners LP | 41.11 | 8.5 | 6,327 | -66.3 | -566.3 | 0.68 |
| BPT | BP Prudhoe Bay Royalty Trust | 9.73 | 42.5 | 208 | 2.4 | 100.0 | 1.36 |
| BRS | Bristow Group, Inc. | 0.29 | 0.0 | 10 | 0.0 | 0.0 | 1.56 |
| BSM | Black Stone Minerals LP | 14.85 | 9.7 | 3,058 | 9.9 | 96.3 | 0.48 |
| CAPL | CrossAmerica Partners LP | 17.18 | 12.2 | 591 | 31.0 | 378.4 | 0.46 |
| CCLP | CSI Compressco LP | 2.85 | 13.9 | 134 | -4.8 | -67.2 | 0.85 |
| CELP | Cypress Energy Partners LP | 8.59 | 9.8 | 103 | 10.2 | 99.7 | 0.57 |
| CEO | CNOOC Ltd. | 160.51 | 5.2 | 71,663 | 8.5 | 44.3 | 1.02 |
| CEOHF | CNOOC Ltd. | 1.43 | 6.5 | 63,845 | 7.6 | 49.3 | 0.21 |
| CEQP | Crestwood Equity Partners LP | 39.27 | 6.1 | 2,838 | 13.4 | 81.7 | 0.75 |
| CESDF | CES Energy Solutions Corp. | 1.62 | 2.8 | 430 | 18.0 | 50.3 | 0.65 |
| CEU.TO | CES Energy Solutions Corp. | 2.12 | 2.9 | 547 | 19.3 | 56.1 | 1.57 |
| CHKR | Chesapeake Granite Wash Trust | 0.62 | 33.9 | 28 | 2.9 | 100.0 | 0.52 |
| CHOLF | China Oilfield Services Ltd. | 1.22 | 0.0 | 5,821 | 28.1 | 0.0 | 0.22 |
| CHOLY | China Oilfield Services Ltd. | 18.08 | 0.0 | 1,637 | -231.8 | 0.0 | |
| CJ.TO | Cardinal Energy Ltd. | 2.68 | 6.7 | 318 | 4.3 | 28.7 | 2.32 |
| CLB | Core Laboratories NV | 49.15 | 4.5 | 2,180 | 23.9 | 107.1 | 1.36 |
| CNQ | Canadian Natural Resources Ltd. | 27.20 | 4.0 | 32,169 | 9.0 | 35.6 | 1.05 |
| CNQ.TO | Canadian Natural Resources Limited | 36.85 | 4.1 | 42,709 | 9.2 | 37.6 | 1.57 |
| CNU.TO | CNOOC Limited | 213.66 | 5.7 | 96,243 | 18.6 | 106.5 | 1.09 |
| CNXM | CNX Midstream Partners LP | 15.10 | 9.4 | 962 | 7.0 | 65.4 | 0.75 |
| COG | Cabot Oil & Gas Corp. | 18.33 | 1.6 | 7,669 | 9.3 | 14.7 | 0.59 |
| COP | ConocoPhillips | 60.01 | 2.0 | 66,619 | 9.6 | 19.2 | 1.10 |
| CPG | Crescent Point Energy Corp. | 4.68 | 3.3 | 2,500 | -1.6 | -5.2 | 1.77 |
| CPG.TO | Crescent Point Energy Corp. | 6.05 | 0.7 | 3,324 | -1.5 | -1.0 | 1.33 |
| CQH | Cheniere Energy Partners LP Holdings, LLC | 0.00 | 0.0 | 0 | 0.00 | ||
| CQP | Cheniere Energy Partners LP | 47.48 | 4.9 | 22,981 | 36.2 | 177.9 | 0.64 |
| CRT | Cross Timbers Royalty Trust | 9.17 | 13.0 | 55 | 7.7 | 100.0 | 0.47 |
| CTXAF | Caltex Australia Ltd. | 18.30 | 3.6 | 4,569 | 19.9 | 72.4 | 0.05 |
| CTXAY | Caltex Australia Ltd. | 43.24 | 2.8 | 5,398 | 23.5 | 65.7 | |
| CVE | Cenovus Energy, Inc. | 10.05 | 1.5 | 12,251 | 59.5 | 90.2 | 1.38 |
| CVE.TO | Cenovus Energy Inc. | 13.46 | 1.5 | 16,257 | 56.1 | 83.6 | 2.16 |
| CVI | CVR Energy, Inc. | 43.75 | 6.9 | 4,398 | 11.2 | 76.6 | 1.20 |
| CVRR | CVR Refining, LP | 0.00 | 0.0 | 0 | 0.00 | ||
| CVX | Chevron Corp. | 124.18 | 3.7 | 235,745 | 16.0 | 59.4 | 0.82 |
| DCP | DCP Midstream LP | 27.71 | 11.3 | 3,971 | 27.0 | 304.2 | 1.12 |
| DK | Delek US Holdings, Inc. | 38.17 | 2.8 | 2,851 | 5.9 | 16.5 | 1.74 |
| DKL | Delek Logistics Partners LP | 31.80 | 10.0 | 776 | 12.9 | 129.4 | 0.64 |
| DM | Dominion Energy Midstream Partners, LP | 0.00 | 0.0 | 0 | 0.00 | ||
| DMLP | Dorchester Minerals LP | 18.78 | 10.3 | 651 | 11.8 | 121.5 | 0.60 |
| DVN | Devon Energy Corp. | 26.50 | 1.3 | 10,711 | 3.2 | 4.2 | 1.52 |
| E | Eni SpA | 31.61 | 4.3 | 56,857 | 14.1 | 59.9 | 0.70 |
| EC | Ecopetrol SA | 17.69 | 0.0 | 36,367 | 9.8 | 0.0 | 1.30 |
| ECA | Encana Corp. | 5.02 | 1.3 | 6,772 | 4.3 | 5.8 | 1.34 |
| ECA.TO | Encana Corporation | 6.87 | 1.5 | 8,772 | 6.7 | 9.9 | 2.77 |
| ECT | ECA Marcellus Trust I | 1.25 | 25.5 | 22 | 4.3 | 109.1 | 0.61 |
| EEP | Enbridge Energy Partners, L.P. | 0.00 | 0.0 | 0 | 0.00 | ||
| EFX.TO | Enerflex Ltd. | 13.06 | 3.3 | 1,124 | 9.1 | 30.4 | 1.01 |
| EIPAF | Eni SpA | 15.27 | 0.0 | 54,933 | 13.6 | 0.0 | 0.31 |
| ENB | Enbridge, Inc. | 35.19 | 6.0 | 71,218 | 20.5 | 124.0 | 0.62 |
| ENB.TO | Enbridge Inc. | 46.70 | 6.3 | 94,574 | 19.1 | 120.5 | 1.02 |
| ENBL | Enable Midstream Partners LP | 12.67 | 10.0 | 5,512 | 10.6 | 106.0 | 0.71 |
| ENF.TO | Enbridge Income Fund Holdings Inc. | 0.00 | 0.0 | 0 | 0.00 | ||
| ENLC | EnLink Midstream LLC | 8.56 | 12.8 | 4,677 | -11.0 | -140.3 | 1.11 |
| ENLK | EnLink Midstream Partners, LP | 0.00 | 0.0 | 0 | 0.00 | ||
| ENRFF | Enerflex Ltd. | 9.51 | 3.3 | 852 | 8.8 | 28.7 | 0.31 |
| EOG | EOG Resources, Inc. | 81.32 | 1.2 | 47,194 | 13.2 | 15.3 | 1.23 |
| EPD | Enterprise Products Partners LP | 29.08 | 6.0 | 63,656 | 12.6 | 75.1 | 0.65 |
| EPM | Evolution Petroleum Corp. | 5.97 | 6.7 | 197 | 12.9 | 86.2 | 1.28 |
| EQGP | EQGP Holdings, LP | 0.00 | 0.0 | 0 | 0.00 | ||
| EQM | EQM Midstream Partners LP | 32.04 | 14.0 | 6,422 | 12.7 | 177.2 | 0.74 |
| EQNR | Equinor ASA | 20.08 | 0.0 | 66,832 | 8.2 | 0.0 | 0.92 |
| EQT | EQT Corp. | 12.25 | 1.0 | 3,129 | -8.7 | -8.5 | 1.22 |
| ERF | Enerplus Corp. | 7.94 | 1.1 | 1,831 | 5.7 | 6.5 | 1.34 |
| ERF.TO | Enerplus Corporation | 10.59 | 1.1 | 2,429 | 5.9 | 6.7 | 2.04 |
| ESI.TO | Ensign Energy Services Inc. | 3.83 | 14.0 | 544 | 8.9 | 124.8 | 1.24 |
| ESV | Ensco Rowan Plc | 8.19 | 2.0 | 1,569 | -1.3 | -2.5 | 1.87 |
| ESVIF | Ensign Energy Services, Inc. | 2.77 | 13.1 | 439 | 8.4 | 109.4 | 0.86 |
| ETE | Energy Transfer Equity, L.P. | 0.00 | 0.0 | 0 | 0.00 | ||
| ETP | Energy Transfer Partners, L.P. | 0.00 | 0.0 | 0 | 0.00 | ||
| FGP | Ferrellgas Partners LP | 0.93 | 0.0 | 90 | -0.4 | 0.0 | 0.71 |
| FI | Frank's International NV | 5.08 | 0.0 | 1,144 | -17.2 | 0.0 | 1.55 |
| FRHLF | Freehold Royalties Ltd. | 6.05 | 7.9 | 715 | 1,407.0 | 11,087.2 | 0.52 |
| FRU.TO | Freehold Royalties Ltd. | 8.14 | 7.7 | 954 | 1.43 | ||
| GEI.TO | Gibson Energy Inc. | 23.58 | 5.6 | 3,424 | 29.1 | 163.0 | 0.89 |
| GEL | Genesis Energy LP | 23.14 | 9.4 | 2,837 | -67.9 | -636.6 | 0.91 |
| GIFI | Gulf Island Fabrication, Inc. | 6.00 | 0.0 | 91 | -3.8 | 0.0 | 0.53 |
| GLOP | GasLog Partners LP | 19.47 | 11.1 | 925 | 14.7 | 163.3 | 0.79 |
| GLP | Global Partners LP | 19.76 | 9.9 | 671 | 12.6 | 124.9 | 0.55 |
| GLPEY | Galp Energia SGPS SA | 7.59 | 3.1 | 11,613 | 21.9 | 68.8 | 0.47 |
| GNE | Genie Energy Ltd. | 7.43 | 4.0 | 202 | 12.6 | 50.7 | 0.83 |
| GPP | Green Plains Partners LP | 13.11 | 14.5 | 303 | 7.1 | 103.3 | 0.30 |
| GXO.TO | Granite Oil Corp. | 0.63 | 17.4 | 24 | 4.5 | 77.7 | 3.44 |
| GXOCF | Granite Oil Corp. | 0.48 | 16.2 | 18 | 4.3 | 69.3 | 1.34 |
| GZPFY | Gazprom Neft PJSC | 32.93 | 0.0 | 30,657 | 4.8 | 0.0 | 0.32 |
| HAL | Halliburton Co. | 20.81 | 3.5 | 18,228 | 13.7 | 47.4 | 1.21 |
| HEP | Holly Energy Partners LP | 25.54 | 10.4 | 2,692 | 14.2 | 148.2 | 0.61 |
| HES | Hess Corp. | 66.91 | 1.5 | 20,372 | -418.2 | -625.0 | 1.58 |
| HFC | HollyFrontier Corp. | 53.05 | 2.5 | 8,730 | 9.8 | 24.4 | 1.34 |
| HGHAF | High Arctic Energy Services, Inc. | 1.91 | 7.8 | 94 | 764.0 | 5,983.5 | 0.36 |
| HGT | Hugoton Royalty Trust | 0.00 | 0.0 | 0 | 0.00 | ||
| HNL.TO | Horizon North Logistics Inc. | 1.11 | 7.0 | 183 | -32.6 | -227.2 | 2.10 |
| HP | Helmerich & Payne, Inc. | 43.58 | 6.5 | 4,769 | -63.8 | -415.8 | 1.17 |
| HWO.TO | High Arctic Energy Services Inc | 2.56 | 7.3 | 129 | 2.01 | ||
| HZNOF | Horizon North Logistics, Inc. | 0.75 | 8.1 | 124 | -29.9 | -240.8 | -0.12 |
| IMO | Imperial Oil Ltd. | 27.70 | 2.2 | 21,144 | 9.2 | 19.9 | 0.73 |
| IMO.TO | Imperial Oil Limited | 36.57 | 2.4 | 28,093 | 9.2 | 22.3 | 1.40 |
| INT | World Fuel Services Corp. | 40.43 | 0.7 | 2,627 | 19.1 | 13.3 | 1.15 |
| IPL.TO | Inter Pipeline Ltd. | 24.77 | 6.9 | 10,112 | 14.7 | 101.7 | 1.28 |
| IPPLF | Inter Pipeline Ltd. | 18.60 | 6.9 | 7,698 | 14.7 | 101.5 | 0.44 |
| IPXHF | INPEX Corp. | 9.53 | 2.3 | 13,915 | 14.2 | 32.3 | 0.04 |
| JXHGF | JXTG Holdings, Inc. | 4.06 | 4.7 | 13,097 | 7.8 | 36.4 | 0.13 |
| KEY.TO | Keyera Corp. | 33.46 | 5.7 | 7,133 | 15.6 | 89.0 | 1.02 |
| KLYCY | Kunlun Energy Co. Ltd. | 8.85 | 0.0 | 7,663 | 10.4 | 0.0 | 0.31 |
| KMI | Kinder Morgan, Inc. | 20.67 | 4.1 | 46,792 | 20.7 | 85.2 | 0.83 |
| KUNUF | Kunlun Energy Co. Ltd. | 0.87 | 0.0 | 7,533 | 10.2 | 0.0 | 0.15 |
| LUKOY | Oil Co. LUKOIL PJSC | 84.42 | 0.0 | 53,930 | 5.7 | 0.0 | 0.35 |
| MARPS | Marine Petroleum Trust | 2.17 | 15.0 | 4 | 6.8 | 102.8 | 0.65 |
| MCM.A.V | Matachewan Consolidated Mines, Limited | 0.12 | 0.0 | 1 | -10.5 | 0.0 | 2.13 |
| MDIKF | MODEC, Inc. | 27.45 | 1.8 | 1,546 | 13.9 | 24.4 | -0.07 |
| MGYOY | MOL Hungarian Oil & Gas Plc | 4.51 | 0.0 | 5,730 | 5.6 | 0.0 | 0.09 |
| MITSF | Mitsui & Co., Ltd. | 17.56 | 4.1 | 30,526 | 8.1 | 33.2 | 0.12 |
| MMLP | Martin Midstream Partners LP | 4.91 | 35.6 | 190 | -1.2 | -44.5 | 0.92 |
| MMP | Magellan Midstream Partners LP | 66.26 | 5.9 | 15,133 | 11.0 | 65.6 | 0.57 |
| MOHCY | Motor Oil (Hellas) Corinth Refineries SA | 12.35 | 0.0 | 2,736 | 9.3 | 0.0 | 0.00 |
| MPC | Marathon Petroleum Corp. | 53.76 | 3.7 | 35,391 | 11.5 | 42.3 | 1.35 |
| MPLX | MPLX LP | 29.77 | 8.6 | 23,647 | 12.9 | 111.6 | 0.90 |
| MRO | Marathon Oil Corp. | 13.03 | 1.5 | 10,476 | 11.0 | 16.9 | 1.55 |
| MTL.TO | Mullen Group Ltd. | 9.45 | 6.3 | 983 | -59.1 | -370.9 | 0.41 |
| MUR | Murphy Oil Corp. | 22.87 | 4.4 | 3,710 | 11.9 | 52.1 | 1.07 |
| MVO | MV Oil Trust | 7.75 | 17.6 | 89 | 5.7 | 100.0 | 0.97 |
| NBL | Noble Energy, Inc. | 24.24 | 1.9 | 11,592 | -12.6 | -23.4 | 1.47 |
| NBR | Nabors Industries Ltd. | 2.53 | 5.6 | 901 | -1.4 | -7.8 | 1.74 |
| NDRO | Enduro Royalty Trust | 0.00 | 0.0 | 0 | 0.00 | ||
| NFG | National Fuel Gas Co. | 48.56 | 3.5 | 4,191 | 14.2 | 49.9 | 0.47 |
| NGL | NGL Energy Partners LP | 14.56 | 10.7 | 1,837 | 5.6 | 60.2 | 0.89 |
| NOA | North American Construction Group Ltd. | 12.11 | 0.5 | 331 | 16.1 | 8.0 | 0.85 |
| NOA.TO | North American Construction Group Ltd. | 16.07 | 0.0 | 406 | 0.00 | ||
| NOV | National Oilwell Varco, Inc. | 22.94 | 0.9 | 8,852 | -1.6 | -1.4 | 1.24 |
| NOVKY | NOVATEK JSC | 205.00 | 0.0 | 62,244 | 7.5 | 0.0 | 0.19 |
| NRT | North European Oil Royalty Trust | 6.30 | 12.9 | 57 | 7.8 | 100.8 | 0.29 |
| NS | NuStar Energy LP | 29.53 | 8.1 | 3,182 | -4.5 | -36.3 | 0.87 |
| NTOIF | Neste Corp. | 31.45 | 0.0 | 24,142 | 24.0 | 0.0 | 0.15 |
| NTOIY | Neste Corp. | 15.96 | 0.0 | 24,503 | 31.5 | 0.0 | 0.60 |
| NZEOF | New Zealand Oil & Gas Ltd. | 0.38 | 0.0 | 62 | -12.6 | 0.0 | -0.04 |
| OAOFY | Tatneft PJSC | 69.94 | 11.2 | 24,516 | 7.8 | 87.0 | 0.37 |
| OGZPY | Gazprom PJSC | 7.17 | 0.0 | 84,987 | 3.1 | 0.0 | 0.81 |
| OII | Oceaneering International, Inc. | 14.64 | 0.0 | 1,430 | -7.6 | 0.0 | 1.60 |
| OISHF | Oil Search Ltd. | 5.14 | 2.7 | 7,837 | 18.5 | 50.1 | 0.05 |
| OISHY | Oil Search Ltd. | 25.77 | 2.5 | 7,858 | 18.5 | 47.1 | 0.87 |
| OJSCY | Rosneft Oil Co. | 6.28 | 0.0 | 66,556 | 7.7 | 0.0 | 0.20 |
| OKE | ONEOK, Inc. | 76.50 | 4.5 | 31,592 | 25.1 | 111.9 | 0.94 |
| OMVKY | OMV AG | 53.11 | 0.0 | 17,361 | 8.8 | 0.0 | 0.66 |
| OXY | Occidental Petroleum Corp. | 44.62 | 7.0 | 39,911 | 8.8 | 61.6 | 0.95 |
| PAA | Plains All American Pipeline LP | 21.86 | 5.8 | 15,901 | 5.2 | 30.2 | 0.89 |
| PAGP | Plains GP Holdings LP | 22.47 | 5.6 | 17,909 | 7.1 | 39.8 | 0.88 |
| PBA | Pembina Pipeline Corp. | 37.06 | 4.7 | 18,956 | 16.1 | 75.6 | 0.67 |
| PBF | PBF Energy, Inc. | 24.79 | 4.8 | 2,972 | 125.3 | 606.7 | 1.40 |
| PBFX | PBF Logistics LP | 21.36 | 9.4 | 1,326 | 13.2 | 124.2 | 0.46 |
| PBT | Permian Basin Royalty Trust | 4.95 | 10.0 | 230 | 10.0 | 100.0 | 0.65 |
| PCCYF | PetroChina Co., Ltd. | 0.51 | 4.7 | 93,889 | 11.8 | 55.6 | 0.27 |
| PDER | Pardee Resources Co. | 169.00 | 4.0 | 122 | 5.5 | 22.1 | 0.23 |
| PER | SandRidge Permian Trust | 1.68 | 24.4 | 88 | 4.1 | 99.7 | 0.50 |
| PETFF | PTT Public Co., Ltd. | 1.55 | 0.0 | 44,272 | 13.7 | 0.0 | 0.24 |
| PEXNY | PTT Exploration & Production Plc | 8.20 | 3.8 | 16,276 | 12.0 | 45.8 | 0.54 |
| PEY.TO | Peyto Exploration & Development Corp. | 4.04 | 5.9 | 644 | 3.8 | 22.6 | 0.99 |
| PEYUF | Peyto Exploration & Development Corp. | 2.95 | 12.4 | 484 | 3.7 | 45.9 | 0.69 |
| PHX | Panhandle Oil & Gas, Inc. | 14.37 | 1.1 | 235 | 15.2 | 16.9 | 0.90 |
| PKI.TO | Parkland Fuel Corporation | 43.09 | 2.8 | 6,289 | 19.9 | 55.1 | 0.26 |
| PKIUF | Parkland Fuel Corp. | 32.41 | 2.8 | 4,773 | 19.6 | 53.9 | 0.52 |
| POFCY | Petrofac Ltd. | 2.69 | 6.1 | 1,827 | 8.2 | 50.1 | 0.64 |
| PPL.TO | Pembina Pipeline Corporation | 49.08 | 4.9 | 25,177 | 16.2 | 79.4 | 1.23 |
| PSI.TO | Pason Systems Inc. | 17.04 | 4.5 | 1,448 | 20.0 | 89.6 | 1.13 |
| PSK.TO | PrairieSky Royalty Ltd. | 19.06 | 4.1 | 4,427 | 42.4 | 174.1 | 1.19 |
| PSX | Phillips 66 | 102.99 | 3.2 | 46,242 | 8.9 | 28.4 | 1.06 |
| PSXP | Phillips 66 Partners LP | 57.87 | 5.6 | 13,075 | 12.8 | 71.4 | 0.53 |
| PSYTF | Pason Systems, Inc. | 12.74 | 4.3 | 1,087 | 19.6 | 83.8 | 0.44 |
| PTEN | Patterson-UTI Energy, Inc. | 9.77 | 1.6 | 1,971 | -5.9 | -9.8 | 1.50 |
| PTR | PetroChina Co., Ltd. | 53.29 | 4.0 | 11,300 | 12.3 | 49.4 | 0.93 |
| PTXLF | PTT Exploration & Production Plc | 3.91 | 4.4 | 15,522 | 11.4 | 49.8 | -0.23 |
| PUTRF | PTT Public Co., Ltd. | 1.53 | 0.0 | 43,701 | 13.5 | 0.0 | -1.70 |
| PUTRY | PTT Public Co., Ltd. | 6.60 | 0.0 | 377,031 | 11.7 | 0.0 | 0.08 |
| PXD | Pioneer Natural Resources Co. | 137.77 | 0.3 | 23,027 | 25.9 | 9.0 | 1.34 |
| RDS.A | Royal Dutch Shell Plc | 58.22 | 5.5 | 123,311 | 11.7 | 64.1 | 0.68 |
| RDS.B | Royal Dutch Shell Plc | 58.56 | 6.4 | 109,123 | 11.8 | 75.5 | 0.70 |
| REPYF | Repsol SA | 15.60 | 0.0 | 23,401 | 10.9 | 0.0 | -0.03 |
| REPYY | Repsol SA | 15.80 | 0.0 | 23,644 | 11.1 | 0.0 | 0.63 |
| RES | RPC, Inc. | 5.82 | 6.1 | 1,231 | 18.2 | 111.2 | 1.10 |
| ROYT | Pacific Coast Oil Trust | 2.01 | 15.8 | 77 | 6.2 | 97.4 | 0.71 |
| RRC | Range Resources Corp. | 5.12 | 1.6 | 1,256 | -0.8 | -1.3 | 1.38 |
| RYDAF | Royal Dutch Shell Plc | 29.42 | 6.6 | 231,881 | 6.4 | 41.7 | 0.53 |
| RYDBF | Royal Dutch Shell Plc | 29.04 | 6.6 | 231,244 | 6.3 | 41.3 | 0.68 |
| SAWLF | ShawCor Ltd. | 12.88 | 3.5 | 903 | 21.2 | 74.7 | 0.39 |
| SBFFF | SBM Offshore NV | 17.62 | 0.0 | 3,446 | 18.6 | 0.0 | 0.29 |
| SBFFY | SBM Offshore NV | 19.90 | 0.0 | 3,892 | 21.0 | 0.0 | 0.13 |
| SBR | Sabine Royalty Trust | 43.74 | 8.1 | 637 | 12.7 | 102.9 | 0.83 |
| SCL.TO | Shawcor Ltd. | 16.81 | 3.7 | 1,155 | 20.8 | 75.7 | 1.97 |
| SDLP | Seadrill Partners LLC | 1.22 | 180.3 | 9 | 0.0 | -6.8 | -0.34 |
| SDR | Sandridge Mississippian Trust II | 0.54 | 31.4 | 27 | 3.2 | 99.7 | 0.52 |
| SDT | Sandridge Mississippian Trust I | 0.55 | 31.3 | 15 | 3.2 | 98.9 | 0.48 |
| SECYF | Secure Energy Services, Inc. | 4.67 | 4.4 | 737 | 49.6 | 216.5 | 0.17 |
| SEMG | SemGroup Corp. | 16.58 | 11.4 | 1,304 | -19.2 | -219.1 | 1.28 |
| SEP | Spectra Energy Partners, LP | 0.00 | 0.0 | 0 | 0.00 | ||
| SES.TO | Secure Energy Services Inc. | 6.52 | 4.3 | 990 | 54.3 | 235.3 | 1.28 |
| SGTPY | Surgutneftegas Public Joint Stock Company | 5.84 | 21.2 | 25,558 | 1.3 | 28.3 | 0.54 |
| SGTZY | Surgutneftegas PJSC | 5.56 | 0.0 | 19,970 | 3.6 | 0.0 | 0.31 |
| SGU | Star Group LP | 9.40 | 5.1 | 463 | 21.9 | 111.2 | 0.25 |
| SGY.TO | Surge Energy Inc. | 1.20 | 8.1 | 370 | -4.1 | -32.9 | 1.24 |
| SHI | Sinopec Shanghai Petrochemical Co. Ltd. | 30.57 | 0.0 | 1,068 | 7.8 | 0.0 | 0.91 |
| SHLX | Shell Midstream Partners LP | 21.51 | 7.3 | 5,018 | 12.0 | 86.8 | 0.69 |
| SJT | San Juan Basin Royalty Trust | 2.40 | 0.0 | 111 | 6.5 | 0.0 | 0.18 |
| SLB | Schlumberger NV | 38.03 | 5.3 | 52,595 | 25.2 | 132.5 | 1.06 |
| SM | SM Energy Co. | 10.80 | 0.9 | 1,195 | 25.9 | 24.5 | 2.08 |
| SMLP | Summit Midstream Partners LP | 5.32 | 37.8 | 439 | 12.6 | 476.9 | 0.77 |
| SNMP | Sanchez Midstream Partners LP | 0.42 | 213.4 | 8 | -0.3 | -73.2 | 0.08 |
| SNP | China Petroleum & Chemical Corp. | 60.64 | 8.2 | 15,471 | 9.6 | 78.2 | 0.84 |
| SNPMF | China Petroleum & Chemical Corp. | 0.60 | 9.1 | 72,642 | 9.5 | 86.1 | 0.26 |
| SOOCY | 0.00 | 0.0 | 0 | 0.00 | |||
| SPGYF | Whitecap Resources, Inc. | 3.60 | 7.0 | 1,445 | 24.0 | 168.3 | 1.12 |
| SPKOY | Sinopec Kantons Holdings Ltd. | 15.75 | 5.2 | 978 | 6.2 | 32.4 | 0.02 |
| SRLP | Sprague Resources LP | 17.38 | 15.4 | 395 | 10.1 | 155.6 | 0.53 |
| SRLY | Southern Realty Co. | 15.00 | 3.5 | 0 | 2.48 | ||
| SSL | Sasol Ltd. | 19.58 | 3.7 | 12,231 | 10.2 | 37.3 | 1.06 |
| STOHF | Equinor ASA | 20.39 | 5.2 | 67,864 | 8.3 | 42.6 | 0.24 |
| SU | Suncor Energy, Inc. | 31.98 | 3.7 | 49,624 | 11.7 | 43.3 | 0.86 |
| SU.TO | Suncor Energy Inc. | 42.57 | 4.2 | 65,965 | 11.9 | 49.4 | 1.69 |
| SUBCY | Subsea 7 SA | 11.26 | 0.0 | 3,319 | 29.5 | 0.0 | 1.04 |
| SUN | Sunoco LP | 31.45 | 10.5 | 3,118 | 20.5 | 215.0 | 0.65 |
| SWSKF | Showa Shell Sekiyu KK | 22.60 | 4.2 | 8,411 | 20.8 | 87.1 | -0.01 |
| TCP | TC Pipelines LP | 40.79 | 6.4 | 2,986 | -13.7 | -87.4 | 0.62 |
| TGSGY | TGS-NOPEC Geophysical Co. ASA | 26.32 | 0.0 | 3,111 | 18.8 | 0.0 | 0.17 |
| TGSNF | TGS-NOPEC Geophysical Co. ASA | 28.31 | 0.0 | 3,346 | 20.1 | 0.0 | 0.02 |
| TIRTZ | Tidelands Royalty Trust B | 0.13 | 0.1 | 0 | -10.5 | -1.0 | -0.75 |
| TK | Teekay Corp. | 4.58 | 0.0 | 461 | -3.0 | 0.0 | 1.72 |
| TLP | TransMontaigne Partners L.P. | 40.99 | 7.6 | 665 | 24.3 | 183.8 | |
| TOG.TO | TORC Oil & Gas Ltd. | 4.10 | 7.4 | 888 | 54.7 | 404.0 | 2.18 |
| TOIPF | Thai Oil Public Co. Ltd. | 2.11 | 3.2 | 4,304 | 28.9 | 91.3 | 0.11 |
| TOIPY | Thai Oil Public Co. Ltd. | 23.95 | 0.0 | 4,885 | 32.8 | 0.0 | 0.17 |
| TOT | Total SA | 52.83 | 0.0 | 137,459 | 12.6 | 0.0 | 0.72 |
| TOT.TO | Total Energy Services Inc. | 6.74 | 3.7 | 293 | 12.0 | 44.7 | 0.69 |
| TRGP | Targa Resources Corp. | 41.64 | 8.7 | 9,693 | -31.9 | -278.5 | 1.27 |
| TRP | TC Energy Corp. | 50.92 | 4.3 | 47,100 | 14.9 | 64.0 | 0.49 |
| TRP.TO | TC Energy Corporation | 66.90 | 4.5 | 62,494 | 14.8 | 67.3 | 1.20 |
| TTFNF | Total SA | 51.45 | 5.8 | 133,869 | 12.2 | 70.6 | 0.39 |
| TTYP | Trinity Petroleum Trust | 111.50 | 14.6 | 0 | -0.04 | ||
| TVK.TO | TerraVest Industries Inc. | 13.15 | 3.0 | 227 | 10.0 | 30.3 | 0.54 |
| TWM.TO | Tidewater Midstream and Infrastructure Ltd. | 1.07 | 3.7 | 354 | 356.7 | 1,309.0 | 0.33 |
| UGP | Ultrapar Participaçoes SA | 4.59 | 2.8 | 4,984 | 16.2 | 45.3 | 1.04 |
| USAC | USA Compression Partners LP | 16.91 | 12.4 | 1,741 | -72.2 | -896.3 | 0.62 |
| VET | Vermilion Energy, Inc. | 17.11 | 12.2 | 2,621 | 9.9 | 120.4 | 0.91 |
| VET.TO | Vermilion Energy Inc. | 23.00 | 12.0 | 3,519 | 10.2 | 122.7 | 2.18 |
| VLO | Valero Energy Corp. | 83.60 | 4.1 | 34,644 | 13.8 | 55.9 | 1.24 |
| VLP | Valero Energy Partners LP | 0.00 | 0.0 | 0 | 0.00 | ||
| VNOM | Viper Energy Partners LP | 30.23 | 6.8 | 4,082 | 44.3 | 303.5 | 1.24 |
| VOC | VOC Energy Trust | 5.42 | 13.4 | 92 | 7.5 | 100.0 | 0.93 |
| VREYF | TORC Oil & Gas Ltd. | 3.16 | 6.5 | 693 | 55.0 | 354.7 | 0.53 |
| WCP.TO | Whitecap Resources Inc. | 4.80 | 7.1 | 1,945 | 25.3 | 180.1 | 1.73 |
| WDGJF | John Wood Group Plc | 5.24 | 6.8 | 3,530 | 60.4 | 413.3 | 0.58 |
| WES | Western Midstream Partners LP | 26.83 | 8.9 | 12,154 | 16.9 | 150.3 | 0.86 |
| WGP | Western Midstream Partners LP | 33.46 | 6.9 | 7,163 | 19.8 | 136.0 | |
| WHZT | Whiting USA Trust II | 0.96 | 79.6 | 17 | 1.3 | 100.0 | 0.63 |
| WMB | The Williams Cos., Inc. | 24.84 | 5.8 | 30,106 | 327.3 | 1,897.2 | 0.86 |
| WOPEF | Woodside Petroleum Ltd. | 22.45 | 5.8 | 20,982 | 16.9 | 97.5 | 0.05 |
| WOPEY | Woodside Petroleum Ltd. | 22.04 | 5.6 | 20,599 | 16.6 | 92.7 | 0.81 |
| WPZ | Williams Partners L.P. | 0.00 | 0.0 | 0 | 0.00 | ||
| XEC | Cimarex Energy Co. | 50.75 | 1.5 | 5,148 | 8.2 | 12.3 | 1.54 |
| XOM | Exxon Mobil Corp. | 72.82 | 4.6 | 308,109 | 17.5 | 80.2 | 0.86 |
| YPF | YPF SA | 8.85 | 0.0 | 3,460 | 5.7 | 0.0 | 1.30 |
| ZCL.TO | ZCL Composites Inc. | 10.00 | 0.0 | 0 | 23.8 | 0.0 | 1.88 |
| ZCLCF | ZCL Composites, Inc. | 7.55 | 5.5 | 231 | 23.1 | 127.6 | |
| ZPTAF | Surge Energy, Inc. | 0.93 | 8.1 | 297 | -4.4 | -35.6 | 0.72 |
| Ticker | Name | Price | Dividend Yield | Market Cap ($M) | P/E Ratio | Payout Ratio | Beta |
The top 10 list below was derived from the Sure Analysis Research Database. To come up with the top 10, we ranked all the oil stocks in our coverage universe according to expected total returns over the next five years.
We further narrowed the list by excluding Master Limited Partnerships, which has unique risk factors and tax issues. Next, we focused on stocks that are particularly leveraged to the price of oil, meaning they stand to benefit from rising oil prices. Finally, they were evaluated based on balance sheet strength and dividend sustainability.
With all this in mind, we have created the following list of top 10 oil stocks for high dividend yields and expected returns.
Table of Contents
- Helmerich & Payne (HP)
- Eni (E)
- Chevron (CVX)
- BP plc (BP)
- Exxon Mobil (XOM)
- Royal Dutch Shell (RDS.B)
- Total (TOT)
- Schlumberger (SLB)
- Occidental Petroleum (OXY)
- Halliburton (HAL)
Top Oil Stock #10: Helmerich & Payne
Helmerich & Payne provides contract drilling services primarily to inland oil and gas producers in the U.S. The company generates 86% of its revenues from U.S. onshore production and it is the market leader in its business.
Due to the downturn of the energy sector, Helmerich & Payne incurred losses in 2016 and 2017. However, the energy sector has begun to recover in the last two years, with the number of active rigs more than doubling off its bottom. As a result, Helmerich & Payne has returned to profits in the last two years.
The company still has a long way to go to return to its pre-crisis earnings, as oil producers have become markedly conservative in their budgets and try to operate within the limits posed by their cash flows.
On the bright side, the growth prospects are promising for Helmerich & Payne. U.S. oil production has kept posting new all-time highs for several years in a row and is expected by EIA to keep climbing to new all-time highs for many more years.
While some analysts have raised concerns over peaking shale oil production in the upcoming years, a recent report shrugged off these concerns and stated that U.S. shale oil production will continue rising for about a decade before it peaks. This certainly bodes well for the growth prospects of Helmerich & Payne.
As the production and investment decisions of oil producers are essentially determined by the prevailing oil prices and future forecasts, Helmerich & Payne’s earnings are very sensitive to the underlying oil prices. Those who have great confidence in the sustained boom of U.S. oil production and expect higher oil prices in the upcoming years should consider Helmerich & Payne.
It is also important to note that Helmerich & Payne is a high dividend stock with a 6.0% yield, and has a much stronger balance sheet than its peers, with no debt maturities until 2025.
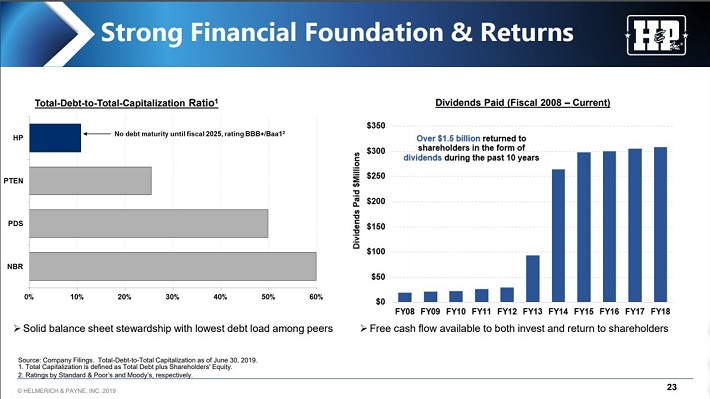
Source: Investor Presentation
This is of great importance, as the cyclical nature of the energy sector can cause prolonged and excessive losses to the highly leveraged players.
Overall, Helmerich & Payne offers strong upside in the scenario of higher oil prices, with tolerable downside risk from its current stock price in the event of a downturn. If the recovery of the energy sector continues in the next five years, Helmerich & Payne is likely to offer an 8.1% average annual return, mostly thanks to its 6.0% dividend.
Top Oil Stock #9: Eni
Eni is a major oil and gas producer based in Italy. It has exploration activity in more than 40 countries and operates in three segments: exploration & production, gas & power and refining & marketing.
In contrast to the other integrated oil majors, such as Exxon Mobil, Chevron and BP, Eni is much less diversified and much more leveraged to the price of oil. To provide a perspective, its upstream segment generated 92% of its operating income in 2018.
The pronounced sensitivity of Eni to the oil price was prominent in the downturn of the energy sector. While all the oil majors saw their earnings plunge, Eni was the only one that posted hefty losses for two years (2015 and 2016) and the only one that cut its dividend.
On the other hand, thanks to its high leverage to the oil price, Eni is better positioned than its peers to benefit from a potential surge in oil prices. It is in prime position to capitalize on higher prices, as the company expects to grow its production by approximately 3.5% per year on average until 2025.
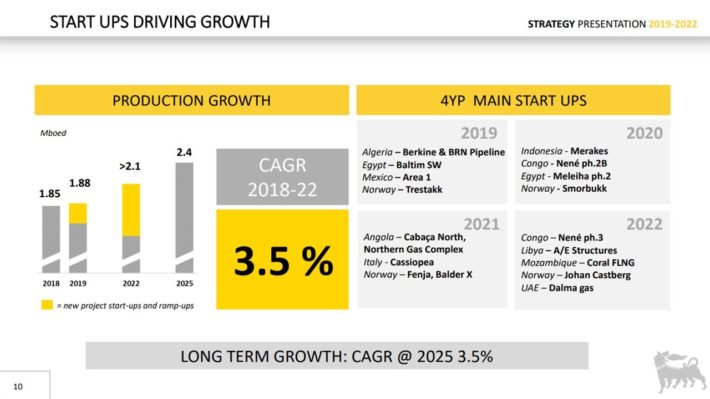
Source: Investor Presentation
Growth will be driven by the start-up of several growth projects. We expect Eni to grow its earnings per share by 5% per year on average over the next five years.
In addition, thanks to its upcoming growth projects, the company expects its upstream division to achieve free cash flows around $22 billion in the period 2019-2022. If the oil producer meets its own guidance, it will achieve a dividend coverage ratio above 2.0.
Eni stock trades at a price-to-earnings ratio of 13.5, which is higher than its 10-year average of 12.5. If the stock reverts to its average valuation level over the next five years, it will incur a 1.5% annualized drag in its returns. Based on the 6.0% dividend and 5.0% annual earnings-per-share growth, Eni is likely to offer a 9.5% average annual return over the next five years.
Overall, Eni is much more leveraged to the oil price than the other oil majors and thus it is likely to offer superior returns in a scenario of higher oil prices.
Top Oil Stock #8: Chevron
Chevron is the third-largest publicly traded oil major in the world in terms of market cap, behind only Royal Dutch Shell and Exxon Mobil. It has a more balanced structure than Eni but it is less diversified than the other oil majors. More precisely, it produces oil and natural gas at a 61/39 ratio but prices a significant portion of its gas based on the oil price.
As a result, about 75% of the total output of Chevron is priced based on the price of oil. This means that Chevron is less leveraged to the oil price than Eni but more leveraged to the oil price than all the other well-known integrated oil majors.
Like most of its peers, Chevron failed to grow its production for a whole decade, until 2017. However, the oil giant has returned to growth mode in the last two years. It grew its production by 5% in 2017 and 7% in 2018 and is on track to grow its output by 4%-7% this year. Moreover, it has provided guidance for 3%-4% annual production growth over the next five years.
A major growth driver will be the Permian Basin. It is remarkable that Chevron has nearly doubled the amount of its estimated reserves in the area in just two years, from 9.3 to 16.2 billion barrels of oil equivalent.
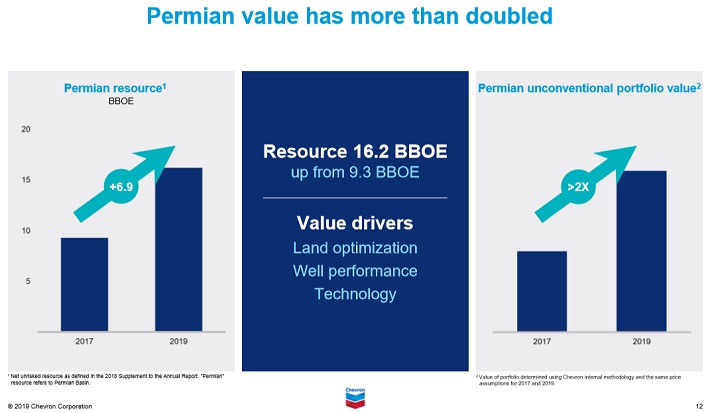
Source: Investor Presentation
Management expects the production in the Permian Basin to reach 600,000 barrels per day by the end of next year and 900,000 barrels per day by the end of 2023. The assets of Chevron in the Permian Basin benefit from zero-to-low royalties and minimal drilling commitments.
In addition, Chevron learned its lesson well from its lost decade and the downturn of the energy sector. It now invests primarily in low-cost, low-risk projects, which are characterized by a high rate of return and begin to generate cash flows within two years from the initial investment. About 70% of this year’s capital expenses will be allocated to growth projects that will begin generating cash flows within the next two years.
Given the promising growth prospects of Chevron, we expect the company to grow its earnings per share by about 7.5% per year over the next five years.
Finally, it is important to note that Chevron and Exxon Mobil are the only two Dividend Aristocrats in the energy sector. As this sector is highly cyclical, it is extremely hard for the companies to maintain multi-year dividend growth streaks. This is a testament to the long-term business perspective of the company.
Chevron currently offers a 3.8% dividend yield and is expected to announce its next dividend hike in January. Therefore, those who purchase the stock at its current price are likely to enjoy an approximate 4.0% forward dividend yield. Moreover, thanks to the healthy balance sheet of the oil major and its strong free cash flows, the dividend can be considered safe for the foreseeable future.
The following YouTube video discusses Chevron’s dividend safety in greater detail following the company’s most recent earnings report:
Furthermore, the stock is trading at a price-to-earnings ratio of 16.8, which is higher than its average valuation level of 15.8. If the stock reverts to its average valuation level over the next five years, it will incur a 1.2% annualized drag in its returns.
Therefore, given the 3.8% dividend and 7.5% annual earnings-per-share growth, Chevron is likely to offer a 10.1% average annual return over the next five years.
Top Oil Stock #7: BP plc
BP is one of the largest oil and gas companies in the world. It operates in two segments: upstream and downstream (mostly refining).
BP has greatly suffered from its disastrous accident in the Gulf of Mexico, in 2010. The company has paid $65 billion for this accident so far. This amount is almost equal to all the earnings of the company since then. While most investors think that this accident belongs to the past, BP paid $3.2 billion for the accident last year (25% of its earnings) and expects to pay another $2.1 billion this year.
Due to the unprecedented extent of asset sales in the aftermath of the accident, BP failed to grow its production until 2017. However, thanks to a series of growth projects, it has returned to strong growth mode in the last two years. Since 2016, BP has launched 23 major projects online.
Even better, it has another 12 major projects until the end of 2021. Thanks to these projects, the oil major expects to add about 900,000 barrels per day to its current production of 3.8 million barrels per day.
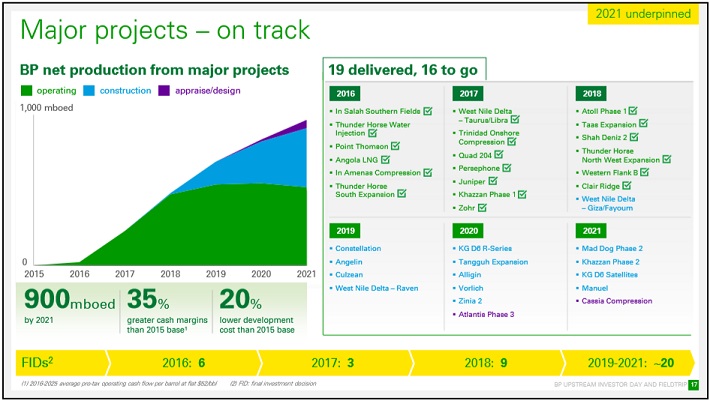
Source: Investor Presentation
BP has reduced its breakeven point below $50 per barrel and expects to lower it even further, to $35-$40 over the next two years. We expect BP to grow its earnings per share by 5.0% per year on average over the next five years.
It is also important to note that BP is particularly suitable for income-oriented investors thanks to its extremely shareholder-friendly management. While the company was forced to suspend its dividend after its disastrous accident amid public outrage, it restored its dividend just three quarters later.
In the recent downturn of the energy sector, BP maintained its dividend, which amounted to $7.0 billion per year, even though it failed to make a profit during 2015-2017. In other words, BP has repeatedly proved that the dividend is near the top of its capital allocation priorities. Therefore, the 6.3% dividend can be considered safe, particularly given the promising growth prospects of the company.
BP stock is trading at a price-to-earnings ratio of 11.1, which is lower than our assumed fair earnings multiple of 12.0. If the stock reverts to its average valuation level over the next five years, it will enjoy a 1.6% annualized boost in its returns. Therefore, given the 6.3% dividend and 5.0% expected annual earnings-per-share growth, BP is likely to offer a 12.9% average annual return over the next five years.
Top Oil Stock #6: Exxon Mobil
Exxon Mobil is the largest publicly-traded oil company in the world. It is a mega-cap stock, with a current market cap of $312 billion. It is more integrated and diversified than most of the oil majors. As a result, it is more defensive than most of its peers during downturns but it benefits less than them from rising oil prices.
Exxon has disappointed its shareholders for a whole decade, as it is the only oil major that has failed to grow its production. It currently produces 4.0 million barrels per day, the same amount it was producing back in 2008.
In addition, its earnings per share are expected to plunge 30% this year, primarily due to lackluster oil prices but also due to depressed margins in its chemicals segment. The earnings of this segment plunged 80% in the most recent quarter.
However, Exxon seems to have eventually changed course, as it announced a major shift in its strategy early last year. The company will nearly double its annual capital expenses in the upcoming years in order to pursue growth more aggressively. Thanks to this strategic shift, Exxon expects to grow its production from 3.8 million barrels per day in 2018 to 5.0 million barrels per day in 2025.
The major growth drivers will be the Permian Basin and Guyana. In the Permian, Exxon expects to produce about 1.0 million barrels per day by 2024. This level of output is certainly impressive, as it represents 25% of the current output of the company.
Exxon has particularly exciting growth prospects in Guyana. While other companies have drilled about 40 dry holes in the area, Exxon has posted an impressive 87% exploration success rate in the area thanks to its expertise. Due to these new discoveries, the oil major has almost doubled its estimated reserves in the area since early last year, from 3.2 to 6.0 billion barrels now. Exxon expects to produce about 750,000 barrels per day in Guyana by 2025.
Exxon expects to grow its earnings per share by 135%, from $3.59 in 2017 to $8.44 in 2025, assuming an oil price of $60 in 2025.
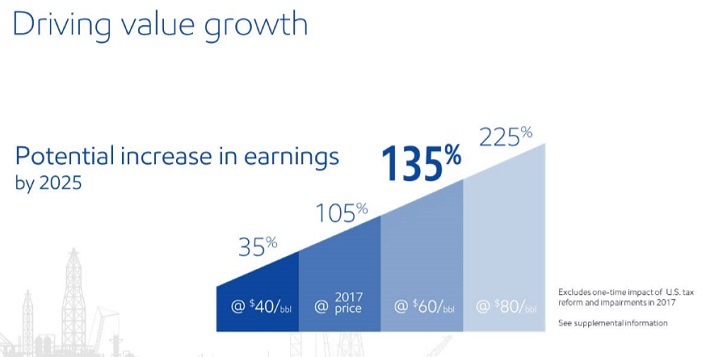
Source: Investor Presentation
The above chart shows that Exxon will benefit even more if the oil price averages $80 in 2025, as the oil major expects to grow its earnings per share by 225% in such a scenario. We have adopted the conservative scenario of oil at $60 per barrel and thus expect Exxon to earn approximately $7.80 per share by 2024 for a 17.4% average annual growth rate.
As mentioned earlier, Exxon is one of the two Dividend Aristocrats in the energy sector, as it has raised its dividend for 37 consecutive years. This enviable dividend growth streak is a testament to the defensive nature of the company, which has kept growing its dividend even under the most adverse business conditions, assisted by its rock-solid balance sheet.
We believe Exxon Mobil’s dividend is among the safest of all oil stocks. The following video analyzes Exxon Mobil’s dividend in further detail:
The current 4.7% dividend yield is certainly attractive and can be considered safe. However, the stock is trading at a price-to-earnings ratio of 20.9, which is higher than our assumed fair earnings multiple of 13.0. If the stock reverts to its average valuation level over the next five years, it will incur a 9.1% annualized drag in its returns.
Still, with the 4.7% dividend and 17.4% expected annual earnings-per-share growth, Exxon is likely to offer a 13.0% average annual return over the next five years.
Top Oil Stock #5: Royal Dutch Shell
Royal Dutch Shell is the second-largest oil and gas company in the world, behind only Exxon Mobil in terms of annual production volumes.
During the downturn of the energy sector, which lasted from 2014 to 2017, Shell acquired BG Group, a deep-water oil and natural gas upstream company for $53 billion. Thanks to that acquisition, Shell boosted its production to 3.8 million barrels per day.
However, due to the extensive asset sales that helped fund the acquisition, the output has remained essentially flat in the last two years. This is in sharp contrast to the trend observed among the other oil majors, which are growing their output at a decent pace.
On the other hand, during the recent downturn, Shell drastically reduced its operating expenses and fine-graded its portfolio by investing in high-quality, low-cost reserves. As a result, the oil giant has become much more profitable than in the past at a given oil price.
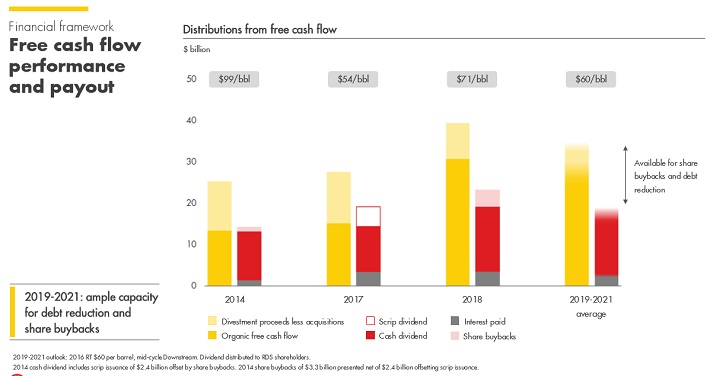
Source: Investor Presentation
To provide a perspective, in 2018, Shell posted record organic free cash flows of $31 billion even though the average price of Brent was 40% lower than it was before the downturn.
Although Shell has frozen its dividend for four consecutive years, it still has an impressive dividend record, as it has not cut its dividend since World War II. In addition, the stock offers an exceptional 6.4% dividend yield.
It is also remarkable that Shell exceeded Exxon in annual operating cash flows in 2017 for the first time in about 20 years and maintained its top position last year. The company expects its annual free cash flows to remain around $30 billion over the next three years. As this amount is twice as much as the dividend, the dividend can be considered safe for the foreseeable future.
Shell is trading at a price-to-earnings ratio of 12.0, which is equal to our assumed fair earnings multiple. Therefore, given the 6.4% dividend and 8.2% expected annual earnings-per-share growth, Shell is likely to offer a 14.6% average annual return over the next five years.
Top Oil Stock #4: Total
Total is the fourth-largest oil and gas company in the world based on market cap. It is the most diversified and integrated oil major, making it the most defensive stock during downturns. This was evident in the recent fierce 2014-2016 downturn of the energy sector, when the earnings per share of Total fell only 49% whereas those of Exxon slumped 75% and Chevron and BP posted losses in 2016.
On the other hand, the integrated structure of Total means that it benefits less than its peers when the price of oil rallies. Of course, higher oil prices boost the earnings of Total but the investors who have strong confidence in higher future oil prices will be better served by investing in the other oil majors, such as Chevron and BP, which are more leveraged to the oil price.
That said, Total will still benefit from higher oil prices because it has returned to growth mode in the last few years. The company grew its production by 8% last year and is poised to grow its output by 9% this year. It also expects to grow its production by 5% per year for at least the next three years. We expect Total to grow its earnings per share by 7.0% per year on average over the next five years.
In addition, Total has greatly improved its asset portfolio since 2015. During this period, Total has added about 7.0 billion barrels of reserves at a cost below $2.5 per barrel and expects free cash flows above $4.0 billion from these assets this year.
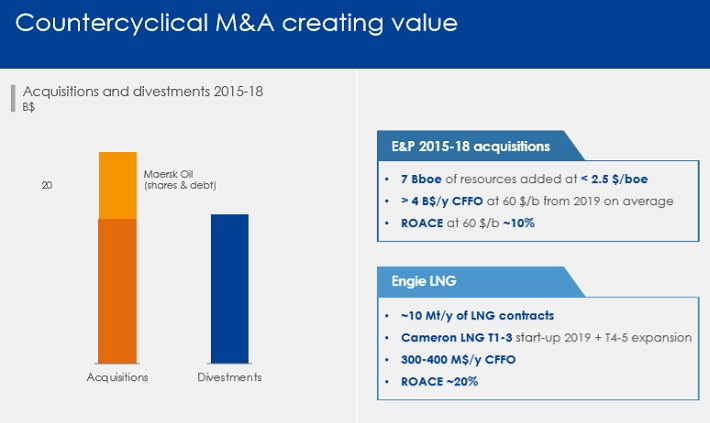
Source: Investor Presentation
As Total posted free cash flows of $12.1 billion last year, it is evident that the above assets will boost the free cash flows by about one-third.
Total does not have the impressive dividend record that Exxon and Chevron have but it offers a superior 5.5% dividend yield. This yield is lower than the yield of Shell and BP but Total is much more defensive than its peers during downturns and has much brighter growth prospects than Shell. Overall, Total offers a better combination of yield, growth prospects and resilience in downturns than the other oil majors, though it is not the best oil major to own during a rally of the oil price.
Total is trading at a price-to-earnings ratio of 10.2, which is lower than its 10-year average earnings multiple of 11.9. If the stock reverts to its average valuation level over the next five years, it will enjoy a 3.1% annualized boost in its returns. Therefore, with the 5.5% dividend and 7.0% expected annual earnings-per-share growth, Total is likely to offer a 15.6% average annual return over the next five years.
Top Oil Stock #3: Schlumberger
Schlumberger is the world’s leading provider of oilfield services and technology, with activity in more than 120 countries.
While the energy sector has been slowly recovering from the 2014-2016 industry downturn, Schlumberger’s recovery has been disappointing so far, primarily due to two headwinds. First of all, shale oil producers have become conservative in their budgets and thus they have reduced their investment spending, in order to avoid growing their debt load.
In addition, there has been great technological progress in oil production in recent years. As a result, oil producers are now able to extract more oil from a given number of wells. It is impressive that global investment in oil production is still 40% lower than it was in 2014, just before the downturn of the sector, whereas oil production has grown 7% since then.
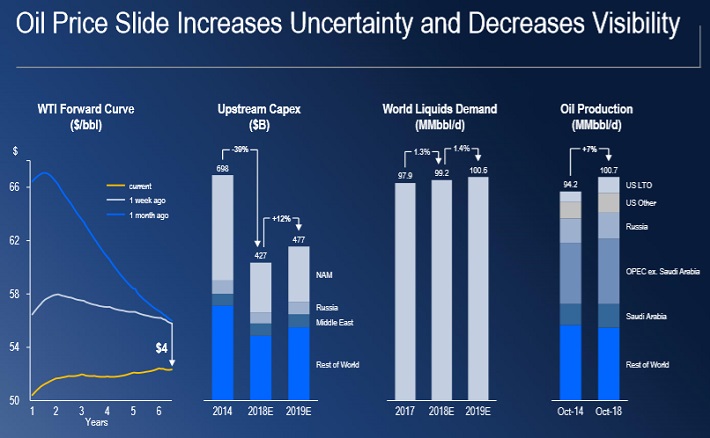
Source: Investor Presentation
This striking divergence shows that oilfield service providers have incurred permanent deterioration in their business, as they generate lower revenues at a given oil production level. In other words, these companies have become victims of their own success. Due to this secular change, the market has punished Schlumberger to the extreme, by sending the stock to a 10-year low.
Schlumberger is offering an almost all-time high dividend yield of 5.2%. Due to its suppressed expected earnings per share of $1.50 this year, the stock is trading at a price-to-earnings ratio of 25.3, which is much higher than our assumed fair earnings multiple of 20.0. If the stock reaches our fair valuation level over the next five years, it will incur a 4.6% annualized drag in its returns.
On the other hand, due to its suppressed earnings per share this year, we expect the company to grow its bottom line from $1.50 this year to $3.20 in 2024 for a 15.5% average annual growth rate, primarily thanks to the sustained boom in U.S. oil production. We thus expect the stock to offer a 16.1% average annual return over the next five years.
Top Oil Stock #2: Occidental Petroleum
Occidental Petroleum is an oil and gas producer with operations in the U.S., the Middle East and Latin America. While it also has a midstream and a chemical segment, it should be viewed as an essentially pure upstream company. It is thus much more leveraged to the oil price than the well-known oil majors.
Occidental has promising growth prospects. It has doubled its production in the Permian Basin in the last three years and expects to double it again in the area over the next five years, from 300,000 to 600,000 barrels per day. Occidental expects to grow its total output by 9%-11% this year and 5% per year beyond this year. As we expect oil prices to rise from their current suppressed level in the upcoming years, we expect Occidental to grow its earnings per share by about 8.4% per year over the next five years.
Moreover, Occidental recently acquired Anadarko after it prevailed in a bidding war against Chevron. Occidental pursued this acquisition in order to strengthen its already strong presence in Permian and in the Gulf of Mexico.
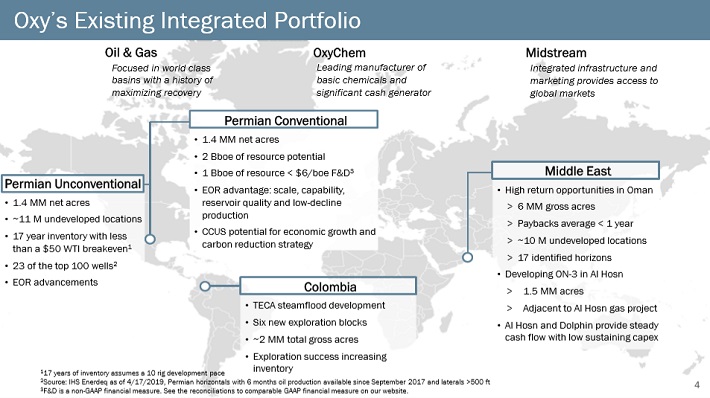
Source: Investor Presentation
The combined company will be the largest producer in the Permian Basin and the fourth-largest producer in the Gulf of Mexico. In addition, thanks to the great fit of the assets of the two companies, Occidental expects to achieve $3.5 billion of pre-tax annual synergies.
On the other hand, Occidental paid $38 billion for this acquisition. This amount is almost equal to its current market cap of $43 billion. Consequently, the market fears that the acquisition is too large for the company to assimilate. Moreover, as Chevron offered only $32 billion, there are concerns that Occidental overpaid for this deal. Furthermore, its debt load and its interest expense will greatly increase. All these concerns have resulted in a dramatic sell-off of the stock to a new 12-year low.
However, we believe that the market has punished the stock to the extreme. Occidental has grown its dividend for 17 consecutive years and is now offering a 7.0% dividend yield. As its cash flows are sufficient to support its capital expenses and its dividend, the latter is safe for the foreseeable future. We just expect the company to raise its dividend marginally in the upcoming years in order to reduce its debt load.
Occidental is now trading at a price-to-earnings ratio of 12.9, which is lower than its 10-year average of 13.8. If the stock reverts to its average valuation level over the next five years, it will enjoy a 1.4% annualized gain in its returns. Given also its 7.0% dividend and our expected 8.4% annual earnings-per-share growth, the stock is likely to offer a 16.8% average annual return over the next five years.
Investors should note that Occidental is highly leveraged to the oil price thanks to two factors, namely its upstream nature and the high interest expense that has resulted from its major acquisition. The higher the oil price the faster the company will reduce its interest expense and the richer the valuation it will earn from the market thanks to its reduced perceived risk. Those who expect higher oil prices in the future will be highly rewarded by Occidental if they are proven correct.
Top Oil Stock #1: Halliburton
Halliburton is one of the world’s largest providers of products and services to the energy industry. It has operations in more than 80 countries and generates 60% of its revenues in North America.
Halliburton is suffering from the same headwinds as Schlumberger. North American oil producers have tightened their budgets and try to operate within the limits posed by their cash flows. Even worse, thanks to the great technological advances that have taken place in recent years, oil producers extract more oil from a given number of wells, at a lower cost.
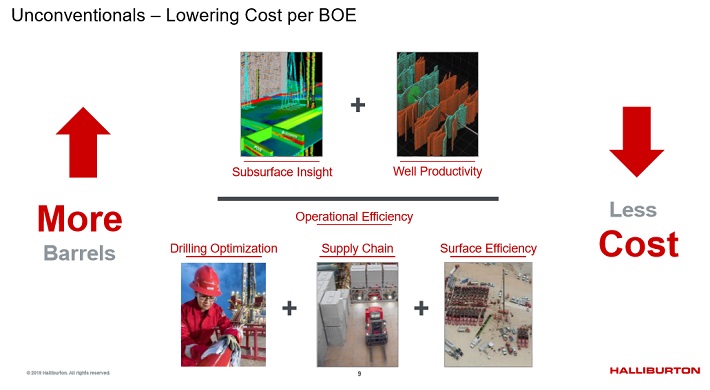
Source: Investor Presentation
Due to these headwinds, Halliburton is trading at a 10-year low, just like Schlumberger. In late July, Halliburton reported (7/22/19) financial results for the second quarter of fiscal 2019. Revenue in North America remained weak due to cautious spending from shale oil producers, who now try to grow within the limits posed by their cash flows. As a result, revenue in the region fell 13% over last year’s quarter.
However, international activity remained strong, with revenue increasing 12.5%. The great divergence between North America and International markets can be explained by the wide discount of WTI to Brent. Moreover, as most shale oil producers sell their oil at a discount to WTI, they face an even wider discount to Brent.
As international strength offset the weakness in North America, adjusted net income soared 50%, while adjusted EPS increased 52% for the quarter.
Management reiterated its expectations for high single-digit revenue growth in international markets for the full year. Moreover, it stated that it idled unused fracking equipment in an effort to reduce operating expenses and cut 8% of its North American workforce.
Despite the headwinds, we expect Halliburton to improve its performance thanks to our expectation for the boom in the U.S. oil production to last for several more years. We thus expect the company to grow its earnings per share from $1.40 this year to about $3.00 by 2024 for a 16.5% annualized growth rate.
Moreover, the stock is trading at a price-to-earnings ratio of 15.0, which is marginally higher than its 10-year average earnings multiple of 14.8. If the stock trades at its average valuation level in five years from now, it will incur a mild 0.3% annualized drag in its returns. Therefore, given also its 3.4% dividend, the stock is likely to offer a 19.6% average annual return over the next five years.
In contrast to the earnings of oil producers, the earnings of Halliburton and Schlumberger are not directly derived from oil production. However, Halliburton and Schlumberger are extremely sensitive to the underlying oil prices, as their earnings are determined by the level of drilling activity, which is closely tied to the price of oil. Overall, Halliburton and Schlumberger are highly leveraged to the price of oil.
Final Thoughts
Oil prices jumped following an attack on Saudi Arabia, one of the world’s largest oil-producing nations. A supply disruption or heightened geopolitical tensions could keep the oil price rally going. If oil prices continue to rise, these 10 stocks stand to benefit the most, while also paying attractive dividends to shareholders.
With reasonable valuations and growth potential in addition to their strong dividend yields, these 10 oil stocks have high expected total returns over the next five years. As a result, these 10 oil stocks are attractive for value and income investors expecting the recent oil price rally to continue.