


Updated April 22nd, 2022 by Ben Reynolds
The 10 Year T-Bonds hit all time yield lows of under 0.65% in July of 2020. For comparison, the long-term average 10 Year T-Bond yield is 4.5%.
To say we have been in a period of low interest rates is an understatement.
With that said, interest rates have been rising steadily over the last ~2 years. The current 10 Year T-Bond rate is now 2.8%, more than 3x previous lows.
The image below gives a good idea of the range of T-Bond rates over time.
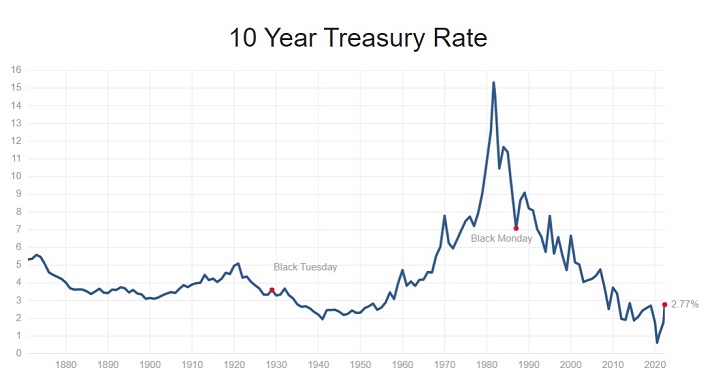
Source: Multpl
In theory lower interest rates cause asset prices (including stock prices) to rise. Here’s how.
Imagine a stock yields 4% and T-Bonds yield 8%. The stock has a lower yield because it is expected to grow over time, resulting in higher dividend income and capital appreciation. Now imagine that the T-Bond yields drop to 2%. Now the stock’s yield looks very attractive as it offers growth and is higher than the T-Bond’s yield. Investors will pile on and bid up the share price, reducing the stock’s yield so that both investment classes offer comparable risk-adjusted returns.
If theory holds true, it stands to reason that the S&P 500 will have a higher price-to-earnings multiple on average when interest rates are lower.
But how much higher should the price-to-earnings ratio be? Is the market really overvalued given today’s ultra-low interest rate environment?
This article takes a look at the relationship between interest rates and price-to-earnings ratios to determine if the market is truly overvalued today on a historical basis taking into account interest rates.
Who Controls Interest Rates
Before going further, it is important to note that interest rates are not dictated by the free market. If they were, there’d be no need to study their relationship with price-to-earnings ratios as they would always move in or near equilibrium thanks to market forces.
Instead, interest rates are controlled by the Federal Reserve. The Federal Reserve’s primary tool in setting interest rates is controlling the Federal Funds Rate.
The Federal Funds Rate is the rate at which banks lend funds held at the Federal Reserve to each other on a short-term (overnight) basis.
The Federal Funds Rate indirectly determines borrowing rates for the entire United States economy.
The Federal Funds Rate was slashed to a range of 0% to 0.25% (virtually free bank borrowing costs) to stimulate the economy in 2008. It was held at that rate until 2015. From late 2015 through 2018, the Federal Funds rate was increased. Movement in the Federal Funds rate from 2015 through 2018 is shown below.
- 0.25 percentage point increase, December 2015
- 0.25 percentage point increase, December 2016
- 0.25 percentage point increase, March 2017
- 0.25 percentage point increase, June 2017
- 0.25 percentage point increase, December 2017
- 0.25 percentage point increase, March 2018
- 0.25 percentage point increase, June 2018
- 0.25 percentage point increase, September 2018
- 0.25 percentage point increase, December 2018
The end result was the Federal Funds Rate going from a range of 0% to 0.25% prior to December 2015, up to range of 2.25% to 2.50% by the end of 2018.
From there, the Federal Reserve began reducing rates again. This trend accelerated in reaction to COVID-19 in an attempt to stimulate the economy. These moves are shown below.
- 0.25 percentage point decrease, August 2019
- 0.25 percentage point decrease, September 2019
- 0.25 percentage point decrease, October 2019
- 0.50 percentage point decrease, March 3rd, 2020
- 1.00 percentage point decrease, March 16th, 2020
From March of 2020 through February of 2022, the Federal Reserve again held the Federal Funds Rate at a range of 0.00% to 0.25%. High inflation – currently at 8.5% annually through March of 2022 – has caused the Federal Reserve to increase rates again in an attempt to push back on inflation.
This started on March 17th, 2022, with a 0.25% increase, pushing the Federal Funds Rate to 0.25% to 0.50%. And further rate increases in the coming months are very likely.
With the Federal Funds Rate on the move, it’s important to examine the historical relationship between the stock market’s price-to-earnings ratio and the 10 Year T-Bond yield (which is a good general gauge of interest rates).
We will explore the correlation of the stock market’s price-to-earnings (P/E or PE) multiple with 10 Year T-Bond yields in the modern financial era; since the United States abandoned the gold standard in 1971.
Correlation Between Market Valuation & Interest Rates
From 1971 through 2022 the S&P 500’s price-to-earnings ratio and PE10 has been highly correlated with the 10 year T-Bond rate.
Note 1: The PE10 ratio or ‘Shiller PE ratio’ divides the current price by average earnings over the last decade. This ‘smooths out’ the price-to-earnings ratio and is a better gauge of valuation during recessions. As an example, the S&P 500’s P/E ratio in 2009 was 70.9, which would be wildly overvalued. In reality earnings were depressed causing a high P/E ratio even though market sentiment was negative. The PE10 ratio was at 15.2 in 2009, well under its mark of 24.0 the year earlier, accurately showing the better valuations during the depths of the Great Recession. This article uses both P/E and PE10 ratios for thoroughness.
Note 2: Data for this study is from Multpl.com. At the time of this writing, the P/E ratio ratio for January 2022 was an estimate.
- PE10 and 10 Year T-Bond correlation of -0.70
- P/E and 10 Year T-Bond correlation of -0.54

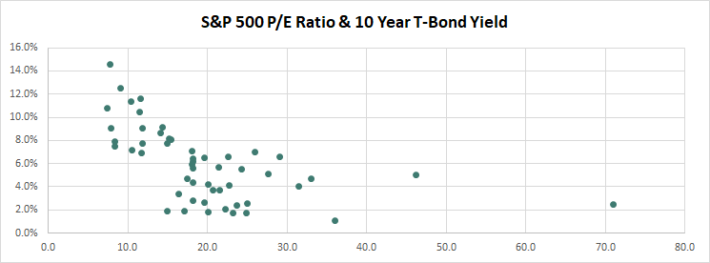
There is a clear inverse relationship between the market’s valuation multiple and interest rates. The higher interest rates go, the lower the S&P 500’s valuation multiple will be, all other things being equal.
What’s a Fair Valuation Today?
What is a fair price-to-earnings ratio for the S&P 500 today given ultra-low interest rates?
Running a linear regression on the data above gives the following for the P/E ratio:
- Correlation of -0.54
- Intercept of 30.7
- Slope of -183.2
And the same information for the PE10 ratio is:
- Correlation of -0.70
- Intercept of 33.4
- Slope of -204.6
Using the slope and intercept above combined with the current 10 Year T-Bond yield of 2.77%, we get the following:
- Fair price-to-earnings ratio of 25.6
- Current price-to-earnings ratio of 21.1
Using PE10 tells a slightly different story:
- Fair PE10 ratio of 27.8
- Current PE10 ratio of 32.8
Based on today’s still low interest rate, the market appears somewhat undervalued using the P/E ratio. It is somewhat overvalued using the PE10 ratio.
All in all, the market certainly doesn’t look extremely overvalued or undervalued when one factors in current interest rate levels. It’s reasonable to say the market is trading more-or-less in its fair value range currently, depending on which metric you prefer, after factoring in interest rates.
What if Interest Rates Continue to Rise?
10 Year T-Bond rates fell from their high in 1981 to record lows in 2020. Since then, T-Bond rates have risen.
The trend of rising interest rates is likely to continue as long as the United States’ economy suffers high inflation. More Federal Funds Rate increases this year are widely expected.
Higher interest rates put a damper on the economy. While the United States’ economy is growing, high levels of government debt and liabilities make it impractical that interest rates will rise to 1980’s levels.
As interest rates rise, the United States’ economy is likely to grow slower, which will result in a halt in rising rates – and potentially even rate reductions if we enter into another recession.
Final Thoughts
Is the market overvalued based on an absolute historical basis using only P/E ratios? Absolutely.
Is the market overvalued given current low interest rates? No. It is trading around fair value, give or take.
The conclusion I draw from this data is that the stock market is trading around fair value given our current low interest rate environment, and that the artificially low interest rate environment will likely be with us for the foreseeable future, albeit with moderate increases, given the United States government’s large amount of debt which makes high interest rates unfeasible, despite high inflation.
Regardless, the prerogative for long-term buy and hold investors does not change: Invest in high quality dividend growth stocks with strong competitive advantages trading at fair or better prices. When the market trades for a lower price-to-earnings ratio this is easier, but it is still possible today as many great dividend growth stocks are currently undervalued in our view.