


Updated on September 9th, 2019 by Bob Ciura
The goal of most investors is to either:
- Maximize returns given a fixed level of risk
- Minimize risk given a particularly level of desired returns
Perhaps the best metric for analyzing both risk and return is the Sharpe Ratio. With that in mind, we’ve compiled a list of all stocks in the S&P 500 sorted by 5-Year Sharpe Ratio, which you can access below.
The list of S&P 500 stocks sorted by Sharpe Ratio available for download above has the following metrics for each of the constituents of the index:
- Sharpe Ratio
- 5-Year Annualized Total Returns
- Dividend yield
- Price-to-earnings ratio
- Market Capitalization
- 5-Year Beta
You can see a preview of the spreadsheet in the table below:
Ticker Name Price Dividend Yield Market Cap ($M) P/E Ratio Payout Ratio Beta Sharpe Ratio
MKTX
MarketAxess Holdings, Inc.
419.40
0.4
15,835
83.9
37.2
0.33
1.93
MSCI
MSCI, Inc.
241.27
1.0
20,435
35.8
34.4
1.32
1.86
CTAS
Cintas Corp.
266.19
0.8
27,281
32.2
24.8
1.07
1.81
CME
CME Group, Inc.
223.07
1.3
79,880
43.4
56.4
0.37
1.79
MA
Mastercard, Inc.
291.38
0.4
295,622
44.7
19.0
1.41
1.78
FISV
Fiserv, Inc.
108.62
0.0
42,684
44.8
0.0
1.00
1.77
V
Visa, Inc.
185.74
0.5
322,890
35.6
18.4
1.22
1.73
RSG
Republic Services, Inc.
88.88
1.7
28,508
27.4
46.2
0.47
1.71
WM
Waste Management, Inc.
119.33
1.6
50,623
28.9
47.3
0.53
1.68
CPRT
Copart, Inc.
81.38
0.0
18,645
34.3
0.0
1.05
1.60
MCD
McDonald's Corp.
220.03
2.0
167,100
28.6
58.4
0.39
1.59
GPN
Global Payments, Inc.
174.37
0.0
27,319
56.6
1.3
1.22
1.58
PGR
Progressive Corp.
77.39
3.4
45,245
14.0
47.3
0.96
1.57
NEE
NextEra Energy, Inc.
220.14
2.1
107,593
31.4
67.3
0.18
1.56
ADBE
Adobe, Inc.
284.94
0.0
138,320
52.5
0.0
1.62
1.53
ZTS
Zoetis, Inc.
128.43
0.5
61,332
44.9
21.6
0.98
1.51
TSS
Total System Services, Inc.
141.09
0.4
24,971
41.1
15.2
1.09
1.51
AWK
American Water Works Co., Inc.
125.70
1.5
22,708
39.1
59.4
0.25
1.49
SNPS
Synopsys, Inc.
145.51
0.0
21,868
34.6
0.0
1.30
1.47
INTU
Intuit, Inc.
287.80
0.7
74,849
48.0
31.4
1.35
1.47
MSFT
Microsoft Corp.
139.10
1.3
1,062,085
27.2
36.0
1.37
1.46
SYK
Stryker Corp.
221.40
0.9
82,605
23.3
21.4
0.93
1.45
TTWO
Take-Two Interactive Software, Inc.
130.76
0.0
14,799
48.1
0.0
1.24
1.43
BR
Broadridge Financial Solutions, Inc.
130.29
1.5
14,889
31.3
46.6
0.95
1.39
AMZN
Amazon.com, Inc.
1,833.51
0.0
906,956
74.3
0.0
1.71
1.39
UNH
UnitedHealth Group, Inc.
229.00
1.7
217,018
16.9
27.9
0.86
1.39
IDXX
IDEXX Laboratories, Inc.
288.47
0.0
24,834
61.3
0.0
1.26
1.38
VRSN
VeriSign, Inc.
207.57
0.0
24,570
39.6
0.0
1.11
1.38
CDNS
Cadence Design Systems, Inc.
70.00
0.0
19,610
45.0
0.0
1.31
1.38
ATO
Atmos Energy Corp.
109.09
1.9
12,894
25.7
48.6
0.27
1.37
FIS
Fidelity National Information Services, Inc.
137.67
1.0
84,452
59.1
57.5
0.91
1.37
BSX
Boston Scientific Corp.
43.45
0.0
60,524
43.0
0.0
1.16
1.36
JKHY
Jack Henry & Associates, Inc.
147.74
1.0
11,375
41.9
43.7
0.83
1.35
NOC
Northrop Grumman Corp.
367.77
1.3
62,225
17.9
23.9
0.80
1.35
ICE
Intercontinental Exchange, Inc.
94.89
1.1
53,177
26.7
28.9
0.61
1.35
TDG
TransDigm Group, Inc.
533.91
0.0
28,497
40.0
0.0
1.25
1.34
CINF
Cincinnati Financial Corp.
114.94
1.9
18,773
15.3
29.1
0.68
1.33
SPGI
S&P Global, Inc.
267.75
0.8
65,946
33.7
27.0
1.01
1.33
MSI
Motorola Solutions, Inc.
174.80
1.3
29,113
27.8
35.5
0.91
1.33
ACN
Accenture Plc
201.12
1.4
128,141
27.4
38.1
1.01
1.32
MKC
McCormick & Co., Inc.
164.98
1.3
21,864
31.8
42.0
0.42
1.31
TFX
Teleflex, Inc.
356.17
0.4
16,466
60.4
23.1
0.92
1.30
XEL
Xcel Energy, Inc.
64.80
2.4
33,372
26.4
64.1
0.21
1.29
NVDA
NVIDIA Corp.
178.65
0.4
108,797
39.6
14.0
2.13
1.29
CMS
CMS Energy Corp.
62.76
2.4
17,810
30.5
71.8
0.18
1.28
HD
The Home Depot, Inc.
231.13
2.1
253,122
22.9
47.4
0.92
1.28
DHR
Danaher Corp.
144.33
0.5
103,537
41.7
19.1
0.93
1.27
WEC
WEC Energy Group, Inc.
93.13
2.5
29,376
26.8
65.9
0.14
1.27
EQIX
Equinix, Inc.
554.09
1.7
46,997
91.3
156.2
0.57
1.25
LHX
L3Harris Technologies, Inc.
214.70
1.3
47,938
26.7
34.1
0.63
1.25
NDAQ
Nasdaq, Inc.
104.26
1.7
17,170
31.9
54.7
0.81
1.25
EW
Edwards Lifesciences Corp.
226.29
0.0
47,061
65.2
0.0
1.23
1.24
VRSK
Verisk Analytics, Inc.
164.58
0.3
26,909
45.2
13.7
0.84
1.24
ISRG
Intuitive Surgical, Inc.
505.26
0.0
58,232
47.9
0.0
1.48
1.23
AMT
American Tower Corp.
232.59
1.5
102,964
69.8
103.6
0.31
1.23
YUM
Yum! Brands, Inc.
119.21
1.3
36,273
27.8
36.4
0.56
1.20
INFO
IHS Markit Ltd.
67.91
0.0
27,238
60.3
0.0
0.98
1.20
LMT
Lockheed Martin Corp.
386.56
2.2
109,163
18.7
41.6
0.77
1.19
DRI
Darden Restaurants, Inc.
125.48
2.4
15,410
21.7
51.9
0.69
1.19
COST
Costco Wholesale Corp.
303.76
0.8
133,590
37.0
28.7
0.85
1.19
CHD
Church & Dwight Co., Inc.
75.90
1.2
18,754
30.9
36.3
0.41
1.18
AEE
Ameren Corp.
76.19
2.5
18,727
23.5
58.0
0.24
1.16
SBUX
Starbucks Corp.
95.74
1.5
114,600
33.5
50.3
0.73
1.16
ROP
Roper Technologies, Inc.
374.96
0.5
38,996
34.6
16.6
0.99
1.15
EXR
Extra Space Storage, Inc.
119.74
2.9
16,113
35.3
102.5
0.22
1.15
AON
Aon Plc
195.28
0.8
46,055
34.9
29.3
0.75
1.14
AJG
Arthur J. Gallagher & Co.
90.50
1.9
16,839
24.2
44.9
0.73
1.14
BDX
Becton, Dickinson & Co.
262.48
1.2
70,857
90.2
105.2
0.95
1.13
MMC
Marsh & McLennan Cos., Inc.
100.91
1.7
51,091
34.4
58.0
0.79
1.11
ROST
Ross Stores, Inc.
109.18
0.9
39,817
24.6
21.6
1.00
1.10
EL
The Estée Lauder Companies, Inc.
207.03
0.8
74,687
42.2
34.0
1.04
1.10
WCG
WellCare Health Plans, Inc.
269.00
0.0
13,533
25.6
0.0
0.85
1.10
TXN
Texas Instruments Incorporated
127.09
2.3
118,653
22.8
52.6
1.29
1.10
ROL
Rollins, Inc.
33.92
1.2
11,108
49.1
57.4
0.77
1.10
IQV
IQVIA Holdings, Inc.
154.07
0.0
30,335
123.6
0.0
1.12
1.07
NI
NiSource, Inc.
29.33
2.7
10,950
96.2
259.0
0.24
1.07
BA
The Boeing Co.
363.00
2.1
204,263
41.8
86.7
1.14
1.07
CCI
Crown Castle International Corp.
146.44
3.0
60,883
84.3
254.9
0.43
1.07
SYY
Sysco Corp.
75.71
2.0
38,852
23.3
47.1
0.48
1.06
TMO
Thermo Fisher Scientific, Inc.
295.05
0.2
118,160
33.4
8.2
1.10
1.06
ANSS
ANSYS, Inc.
217.59
0.0
18,299
41.6
0.0
1.39
1.06
LDOS
Leidos Holdings, Inc.
87.62
1.5
12,600
19.5
28.5
0.94
1.04
ES
Eversource Energy
82.35
2.5
26,648
30.4
76.7
0.18
1.04
ABMD
ABIOMED, Inc.
189.43
0.0
8,595
33.1
0.0
1.47
1.03
AEP
American Electric Power Co., Inc.
91.09
2.9
44,979
22.7
65.7
0.13
1.03
PLD
Prologis, Inc.
84.79
2.4
53,513
31.3
74.5
0.68
1.02
BLL
Ball Corp.
78.30
0.6
25,995
50.2
28.8
0.74
1.02
TMUS
T-Mobile US, Inc.
79.15
0.0
67,630
20.5
0.0
0.78
1.02
BAX
Baxter International, Inc.
89.78
0.9
45,837
29.6
26.1
0.83
1.02
LNT
Alliant Energy Corp.
52.26
2.6
12,412
24.2
63.8
0.21
1.02
RMD
ResMed, Inc.
140.30
1.1
20,157
49.7
52.4
0.84
1.02
ADP
Automatic Data Processing, Inc.
173.25
1.8
75,180
32.8
58.0
1.08
1.01
IEX
IDEX Corp.
168.85
1.1
12,806
29.9
33.0
1.03
1.01
PAYX
Paychex, Inc.
84.07
2.7
30,210
29.2
79.9
0.92
1.01
AVGO
Broadcom, Inc.
291.91
3.0
116,201
34.7
104.7
1.31
1.00
SHW
The Sherwin-Williams Co.
534.74
0.7
49,332
42.1
31.4
0.87
1.00
AVY
Avery Dennison Corp.
114.19
1.9
9,613
40.8
76.5
0.97
1.00
HON
Honeywell International, Inc.
171.16
1.9
123,150
17.9
33.5
0.94
0.99
DTE
DTE Energy Co.
128.88
0.0
23,623
21.2
0.0
0.17
0.99
ARE
Alexandria Real Estate Equities, Inc.
153.11
2.5
17,365
43.7
110.4
0.57
0.99
STZ
Constellation Brands, Inc.
204.75
1.5
39,224
15.7
22.8
0.81
0.98
PEG
Public Service Enterprise Group, Inc.
60.42
3.0
30,550
20.8
63.4
0.25
0.96
MCO
Moody's Corp.
220.54
0.9
41,726
33.8
28.8
1.18
0.96
DLR
Digital Realty Trust, Inc.
128.62
3.2
26,797
117.9
383.0
0.55
0.95
APD
Air Products & Chemicals, Inc.
225.59
2.0
49,709
29.1
58.2
0.79
0.95
CLX
The Clorox Co.
162.04
2.4
20,375
25.2
61.3
0.40
0.95
CBOE
Cboe Global Markets, Inc.
118.70
1.0
13,256
32.7
34.2
0.30
0.95
MAA
Mid-America Apartment Communities, Inc.
128.82
3.0
14,691
62.2
183.5
0.40
0.94
DG
Dollar General Corp.
161.54
0.8
41,526
25.8
19.5
0.81
0.94
DRE
Duke Realty Corp.
33.32
2.5
12,148
51.7
131.2
0.60
0.94
NKE
NIKE, Inc.
88.69
1.0
138,964
34.6
33.6
1.14
0.93
CHTR
Charter Communications, Inc.
425.72
0.0
94,287
71.1
0.0
0.92
0.93
PNW
Pinnacle West Capital Corp.
93.81
3.1
10,535
20.9
64.8
0.19
0.93
RTN
Raytheon Co.
190.46
1.9
53,049
17.5
33.3
0.79
0.92
ECL
Ecolab, Inc.
206.69
0.9
59,475
39.8
34.5
0.78
0.91
SBAC
SBA Communications Corp.
262.38
0.0
29,676
228.2
0.0
0.49
0.91
AFL
Aflac, Inc.
51.57
2.1
38,181
12.5
25.7
0.69
0.91
LRCX
Lam Research Corp.
227.92
1.9
32,941
15.9
30.6
1.50
0.89
ABT
Abbott Laboratories
86.04
1.4
152,067
52.5
75.6
1.02
0.88
ED
Consolidated Edison, Inc.
91.14
3.2
30,271
21.5
68.8
0.16
0.88
ORLY
O'Reilly Automotive, Inc.
399.73
0.0
30,584
23.6
0.0
0.62
0.87
CRM
salesforce.com, inc.
151.07
0.0
117,665
122.4
0.0
1.56
0.87
UDR
UDR, Inc.
48.93
2.7
23,329
85.3
231.7
0.41
0.87
WLTW
Willis Towers Watson Plc
197.75
1.3
25,508
30.4
38.4
0.71
0.86
MTD
Mettler-Toledo International, Inc.
684.98
0.0
16,856
31.2
0.0
1.12
0.85
FB
Facebook, Inc.
187.49
0.0
534,856
31.5
0.0
1.25
0.84
PEP
PepsiCo, Inc.
137.37
2.7
192,066
15.1
41.1
0.45
0.84
XYL
Xylem, Inc.
78.39
1.1
14,112
24.6
28.3
1.09
0.84
O
Realty Income Corp.
75.95
3.5
24,169
58.0
204.4
0.36
0.83
JPM
JPMorgan Chase & Co.
112.61
2.8
360,069
11.5
32.6
0.93
0.83
TJX
The TJX Cos., Inc.
56.14
1.5
68,079
22.3
33.8
0.89
0.83
IR
Ingersoll-Rand Plc
121.60
1.7
29,375
20.8
36.3
0.94
0.83
ADI
Analog Devices, Inc.
112.67
1.8
41,620
27.5
49.9
1.26
0.82
CSCO
Cisco Systems, Inc.
48.84
2.8
209,070
18.6
51.7
1.29
0.82
ALL
The Allstate Corp.
105.31
1.8
34,667
13.6
24.7
0.73
0.82
CB
Chubb Ltd.
161.03
1.8
73,389
19.6
35.8
0.61
0.82
ETR
Entergy Corp.
113.55
3.2
22,577
22.0
70.0
0.17
0.82
HSY
The Hershey Co.
158.98
1.8
33,318
26.7
48.4
0.25
0.81
MDT
Medtronic Plc
108.69
1.9
145,826
33.0
61.9
0.66
0.81
FTNT
Fortinet, Inc.
80.10
0.0
13,696
36.6
0.0
1.32
0.81
ESS
Essex Property Trust, Inc.
327.06
2.3
21,496
52.6
122.5
0.37
0.81
AMD
Advanced Micro Devices, Inc.
30.56
0.0
33,174
162.9
0.0
2.36
0.81
TRV
The Travelers Cos., Inc.
152.84
2.0
39,797
15.1
31.0
0.67
0.80
DHI
D.R. Horton, Inc.
50.13
1.1
18,539
11.9
13.6
0.78
0.79
PG
Procter & Gamble Co.
122.87
2.4
307,498
84.2
198.5
0.47
0.77
XLNX
Xilinx, Inc.
105.94
1.4
26,760
28.5
39.0
1.55
0.77
ANTM
Anthem, Inc.
249.38
1.2
63,795
15.8
19.6
0.86
0.77
TSN
Tyson Foods, Inc.
86.04
1.7
25,353
14.0
24.4
0.46
0.77
LLY
Eli Lilly & Co.
114.05
2.1
110,107
27.1
57.4
0.65
0.77
GOOG
Alphabet, Inc.
1,204.93
0.0
835,524
24.1
0.0
1.27
0.77
KLAC
KLA Corp.
150.98
2.0
24,044
20.0
39.7
1.48
0.77
KO
The Coca-Cola Co.
55.23
2.9
236,165
33.6
96.1
0.40
0.76
GL
Globe Life, Inc.
91.68
0.7
10,002
14.2
10.3
0.90
0.76
NFLX
Netflix, Inc.
290.17
0.0
127,046
109.9
0.0
1.73
0.76
SO
The Southern Co.
59.68
4.1
62,379
13.9
56.5
0.15
0.75
VMC
Vulcan Materials Co.
145.01
0.8
19,182
34.0
27.7
0.93
0.75
HAS
Hasbro, Inc.
112.40
2.3
14,184
45.7
106.4
0.97
0.75
AIZ
Assurant, Inc.
124.41
1.9
7,605
21.1
40.1
0.76
0.75
ITW
Illinois Tool Works, Inc.
152.49
2.6
49,327
20.4
53.4
1.10
0.74
LOW
Lowe's Cos., Inc.
114.71
1.7
88,533
35.8
62.1
1.08
0.74
GOOGL
Alphabet, Inc.
1,206.32
0.0
836,487
24.1
0.0
1.26
0.74
HIG
The Hartford Financial Services Group, Inc.
60.32
2.0
21,810
13.3
26.5
0.72
0.74
ALLE
Allegion Plc
98.95
1.0
9,239
21.4
20.7
0.92
0.73
AZO
AutoZone, Inc.
1,143.34
0.0
28,044
20.0
0.0
0.33
0.72
EA
Electronic Arts, Inc.
98.53
0.0
29,037
13.7
0.0
1.08
0.72
WAT
Waters Corp.
217.24
0.0
14,502
27.4
0.0
0.91
0.71
HOLX
Hologic, Inc.
49.71
0.0
13,287
-436.8
0.0
0.96
0.71
AAPL
Apple, Inc.
213.26
1.4
963,760
18.0
25.0
1.51
0.71
CMCSA
Comcast Corp.
46.35
1.7
210,660
17.5
30.1
0.89
0.71
CSX
CSX Corp.
67.52
1.4
53,892
16.2
22.0
1.06
0.70
HUM
Humana, Inc.
273.51
0.8
36,948
14.8
11.4
0.87
0.70
EQR
Equity Residential
86.85
2.6
32,208
50.2
128.0
0.37
0.70
RE
Everest Re Group Ltd.
249.00
2.2
10,144
19.6
43.2
0.56
0.69
AIV
Apartment Investment & Management Co.
51.80
3.0
7,712
22.7
69.0
0.46
0.69
DE
Deere & Co.
156.52
1.9
49,283
15.0
28.5
1.28
0.69
EXPD
Expeditors International of Washington, Inc.
73.25
1.3
12,505
19.9
25.8
1.04
0.69
HII
Huntington Ingalls Industries, Inc.
215.00
1.5
8,887
13.3
20.4
0.98
0.68
EXC
Exelon Corp.
48.12
2.9
46,752
20.5
60.3
0.24
0.68
ADSK
Autodesk, Inc.
150.35
0.0
33,015
582.8
0.0
1.66
0.67
PSA
Public Storage
257.50
3.1
44,958
30.7
95.4
0.12
0.67
MAS
Masco Corp.
41.75
1.1
12,084
17.0
19.6
1.06
0.67
FLT
FleetCor Technologies, Inc.
302.64
0.0
26,198
29.5
0.0
1.05
0.67
MXIM
Maxim Integrated Products, Inc.
56.92
3.2
15,440
18.9
61.0
1.35
0.67
APH
Amphenol Corp.
89.32
1.0
26,568
22.1
22.7
1.07
0.67
COO
The Cooper Cos., Inc.
302.84
0.0
15,012
33.5
0.7
0.87
0.67
DGX
Quest Diagnostics, Inc.
104.21
2.0
14,033
19.4
38.8
0.70
0.66
ULTA
Ulta Beauty, Inc.
233.10
0.0
13,717
19.6
0.0
0.96
0.66
FRC
First Republic Bank (San Francisco, California)
89.19
0.8
15,003
17.7
14.5
0.87
0.66
MDLZ
Mondelez International, Inc.
56.63
1.8
81,668
22.2
40.8
0.54
0.66
A
Agilent Technologies, Inc.
74.28
0.9
22,987
22.0
19.0
1.09
0.66
HRL
Hormel Foods Corp.
42.60
1.9
22,747
23.1
44.3
0.44
0.65
CNC
Centene Corp.
45.89
0.0
18,980
14.8
0.0
1.19
0.65
ALGN
Align Technology, Inc.
175.06
0.0
13,982
33.5
0.0
1.65
0.65
CE
Celanese Corp.
118.07
1.9
14,609
14.7
27.8
1.17
0.65
AME
AMETEK, Inc.
89.27
0.6
20,384
24.8
15.6
1.11
0.64
AVB
AvalonBay Communities, Inc.
215.75
2.8
30,130
32.6
90.5
0.42
0.63
AOS
A. O. Smith Corp.
47.81
1.8
6,614
19.1
33.5
0.92
0.63
FE
FirstEnergy Corp.
46.68
3.2
25,206
22.5
71.2
0.29
0.62
MRK
Merck & Co., Inc.
86.57
2.5
221,652
24.1
59.2
0.66
0.61
PHM
PulteGroup, Inc.
34.57
1.2
9,479
10.5
12.7
0.63
0.61
ATVI
Activision Blizzard, Inc.
54.58
0.6
41,864
24.8
15.4
1.28
0.61
PKI
PerkinElmer, Inc. (United States)
83.74
0.3
9,301
36.7
12.3
1.29
0.61
DUK
Duke Energy Corp.
93.76
4.0
68,313
20.7
81.9
0.15
0.61
MAR
Marriott International, Inc.
129.43
1.3
42,628
29.4
38.8
1.08
0.61
WMT
Walmart, Inc.
114.73
1.8
327,522
25.7
47.1
0.59
0.60
BBY
Best Buy Co., Inc.
66.35
2.9
17,718
11.8
33.8
1.20
0.60
LIN
Linde Plc
189.52
1.8
102,452
18.9
33.9
0.72
0.59
AMAT
Applied Materials, Inc.
50.10
1.6
46,280
16.5
27.0
1.54
0.59
KMB
Kimberly-Clark Corp.
138.05
2.9
47,516
26.4
77.8
0.41
0.59
EFX
Equifax, Inc.
146.76
1.1
17,740
-41.7
-44.3
0.79
0.58
TGT
Target Corp.
109.85
2.3
56,125
18.0
42.3
0.89
0.58
GD
General Dynamics Corp.
192.67
2.0
55,651
16.9
34.3
0.94
0.58
SRE
Sempra Energy
142.00
2.6
38,986
20.2
52.9
0.32
0.57
CTXS
Citrix Systems, Inc.
94.41
1.1
12,358
23.8
26.5
0.64
0.57
PNC
The PNC Financial Services Group, Inc.
131.72
0.0
58,649
11.8
0.0
0.85
0.56
ANET
Arista Networks, Inc.
235.70
0.0
18,064
24.5
0.0
1.64
0.55
GRMN
Garmin Ltd.
83.46
2.6
15,865
21.3
55.2
0.81
0.55
HLT
Hilton Worldwide Holdings, Inc.
93.74
0.6
26,889
34.1
21.8
1.04
0.55
BRK.B
Berkshire Hathaway, Inc.
204.73
0.0
501,856
17.4
0.0
0.92
0.55
DIS
The Walt Disney Co.
139.55
1.2
251,382
17.5
21.6
0.86
0.55
TROW
T. Rowe Price Group, Inc.
115.62
2.5
27,236
14.3
36.2
1.24
0.54
MNST
Monster Beverage Corp.
57.17
0.0
31,150
29.6
0.0
0.87
0.53
MCHP
Microchip Technology, Inc.
90.52
1.6
21,547
57.7
92.9
1.50
0.53
WELL
Welltower, Inc.
91.39
3.8
37,035
101.8
387.5
0.33
0.53
TEL
TE Connectivity Ltd.
94.85
1.9
31,863
10.1
18.9
1.02
0.53
IT
Gartner, Inc.
137.19
0.0
12,365
56.3
0.0
1.01
0.52
UNP
Union Pacific Corp.
164.60
2.0
115,965
19.5
39.7
1.08
0.52
HCA
HCA Healthcare, Inc.
126.10
1.2
42,997
11.9
14.1
0.95
0.52
ETFC
E*TRADE Financial Corp.
42.92
1.0
10,292
10.5
10.3
1.19
0.52
STI
SunTrust Banks, Inc.
62.90
3.2
27,923
11.0
34.9
0.87
0.52
DLTR
Dollar Tree, Inc.
109.62
0.0
25,938
-16.5
0.0
0.63
0.51
BF.B
Brown-Forman Corp.
62.30
1.1
29,750
36.3
38.2
0.79
0.51
AMGN
Amgen, Inc.
207.73
2.7
124,575
16.3
43.6
0.82
0.50
MLM
Martin Marietta Materials, Inc.
258.03
0.7
16,111
32.0
23.8
0.70
0.50
VTR
Ventas, Inc.
75.23
4.2
28,029
53.9
227.0
0.25
0.49
BAC
Bank of America Corp.
27.73
2.2
258,119
9.8
21.1
1.10
0.49
JNJ
Johnson & Johnson
128.21
2.8
338,367
21.0
59.7
0.58
0.49
WU
The Western Union Co.
22.85
3.4
9,685
8.2
28.1
0.66
0.49
EBAY
eBay, Inc.
40.37
0.7
33,860
15.6
10.8
1.02
0.48
NSC
Norfolk Southern Corp.
175.06
1.9
46,112
16.9
32.0
1.06
0.48
SWK
Stanley Black & Decker, Inc.
137.83
0.0
20,914
28.9
0.0
1.42
0.48
LH
Laboratory Corp. of America Holdings
172.93
0.0
16,895
20.3
0.0
0.82
0.48
PFE
Pfizer Inc.
36.50
3.9
201,883
16.4
63.7
0.74
0.47
VZ
Verizon Communications, Inc.
59.06
4.1
244,272
15.4
62.9
0.29
0.47
JEC
Jacobs Engineering Group, Inc.
92.32
0.7
12,509
-52.5
-37.5
1.09
0.46
INTC
Intel Corp.
50.92
2.4
225,575
11.7
28.2
1.21
0.45
CNP
CenterPoint Energy, Inc.
28.50
4.0
14,313
25.0
98.9
0.33
0.45
BKNG
Booking Holdings, Inc.
1,967.63
0.0
83,647
21.6
0.0
1.14
0.44
USB
U.S. Bancorp
53.41
2.8
84,165
12.5
34.8
0.74
0.43
RCL
Royal Caribbean Cruises Ltd.
108.41
2.6
22,718
12.3
31.7
1.26
0.43
VRTX
Vertex Pharmaceuticals, Inc.
181.33
0.0
46,608
20.9
0.0
1.18
0.43
CBRE
CBRE Group, Inc.
53.86
0.0
18,115
17.0
0.0
1.14
0.42
BBT
BB&T Corp.
48.72
3.3
37,327
11.9
39.6
0.77
0.41
PH
Parker-Hannifin Corp.
173.49
1.8
22,283
14.9
27.1
1.29
0.41
FLIR
FLIR Systems, Inc.
51.02
1.3
6,918
24.9
32.3
0.95
0.41
CI
Cigna Corp.
153.80
0.0
58,076
13.9
0.0
0.92
0.41
JBHT
J.B. Hunt Transport Services, Inc.
110.74
0.9
11,823
25.4
23.0
0.96
0.40
D
Dominion Energy, Inc.
76.37
4.6
62,769
51.3
235.2
0.16
0.40
VLO
Valero Energy Corp.
78.13
4.4
32,377
12.9
55.9
1.23
0.39
AXP
American Express Co.
120.19
1.3
99,718
14.9
19.3
1.04
0.39
PKG
Packaging Corporation of America
100.61
3.1
9,524
12.0
37.8
1.08
0.39
ROK
Rockwell Automation, Inc.
161.04
2.4
18,842
18.7
44.4
1.21
0.39
FMC
FMC Corp.
87.40
1.6
11,399
22.5
35.1
1.10
0.39
ORCL
Oracle Corp.
53.16
1.5
177,332
17.2
26.2
0.99
0.38
TSCO
Tractor Supply Co.
103.54
1.2
12,348
22.8
28.2
1.02
0.38
IPGP
IPG Photonics Corp.
133.51
0.0
7,102
23.4
0.0
1.71
0.37
RF
Regions Financial Corp.
14.85
3.8
14,816
10.3
38.7
1.06
0.37
VFC
VF Corp.
87.61
2.3
34,884
30.2
68.6
1.12
0.37
EXPE
Expedia Group, Inc.
131.71
1.0
18,749
31.7
30.8
0.89
0.37
VAR
Varian Medical Systems, Inc.
109.55
0.0
9,975
29.6
0.0
0.92
0.36
DAL
Delta Air Lines, Inc.
57.98
2.4
37,698
8.6
20.8
0.98
0.36
T
AT&T, Inc.
36.25
5.6
264,878
15.2
85.1
0.67
0.36
HBAN
Huntington Bancshares, Inc.
13.54
4.1
14,052
10.6
43.8
0.92
0.36
CHRW
C.H. Robinson Worldwide, Inc.
83.28
2.4
11,274
16.5
38.9
0.79
0.36
CL
Colgate-Palmolive Co.
74.70
2.3
64,093
28.4
64.2
0.55
0.36
REG
Regency Centers Corp.
66.92
3.4
11,236
39.1
133.1
0.49
0.35
BLK
BlackRock, Inc.
423.83
3.0
65,513
16.0
48.4
1.16
0.35
FAST
Fastenal Co.
31.56
2.6
18,097
23.6
62.1
1.13
0.35
UPS
United Parcel Service, Inc.
120.08
3.1
103,188
21.9
68.1
1.07
0.35
GLW
Corning, Inc.
28.33
2.7
22,121
15.9
42.6
1.30
0.34
LUV
Southwest Airlines Co.
52.14
1.3
28,026
12.1
15.3
0.91
0.34
RJF
Raymond James Financial, Inc.
80.56
1.6
11,185
11.2
18.3
1.18
0.34
APTV
Aptiv Plc
88.75
1.0
22,737
23.5
23.3
1.14
0.34
UTX
United Technologies Corp.
133.69
2.2
115,351
21.6
46.9
1.06
0.33
KMX
CarMax, Inc.
86.00
0.0
14,240
16.9
0.0
0.76
0.33
EIX
Edison International
70.98
3.4
25,417
-93.2
-320.8
0.51
0.33
FITB
Fifth Third Bancorp
26.76
3.2
19,444
9.0
28.9
0.90
0.33
SIVB
SVB Financial Group
201.28
0.0
10,373
9.2
0.0
1.55
0.33
NTRS
Northern Trust Corp.
89.82
2.6
19,301
13.5
34.6
1.08
0.33
UAL
United Airlines Holdings, Inc.
86.30
0.0
22,172
8.7
0.0
1.00
0.32
CTSH
Cognizant Technology Solutions Corp.
64.45
1.2
35,595
17.8
22.1
0.93
0.32
ETN
Eaton Corp. Plc
83.25
3.3
34,965
16.1
53.0
1.09
0.32
ZBH
Zimmer Biomet Holdings, Inc.
139.74
0.7
28,690
-79.4
-54.5
0.91
0.32
ZION
Zions Bancorporation NA
40.94
2.9
7,244
9.3
27.3
0.94
0.30
IRM
Iron Mountain, Inc.
33.05
7.3
9,488
32.4
237.5
0.57
0.30
DFS
Discover Financial Services
82.25
1.9
26,175
9.6
18.7
1.20
0.29
ABBV
AbbVie, Inc.
67.62
6.2
99,974
24.8
153.0
0.89
0.29
UHS
Universal Health Services, Inc.
148.26
0.3
13,119
16.9
4.5
0.77
0.29
AKAM
Akamai Technologies, Inc.
91.82
0.0
15,148
35.5
0.0
1.18
0.28
MMM
3M Co.
163.94
3.4
94,311
19.4
66.3
1.05
0.28
HSIC
Henry Schein, Inc.
61.56
0.0
9,126
19.4
0.0
0.72
0.28
KEY
KeyCorp
16.80
4.0
16,854
10.0
40.3
1.04
0.27
LEN
Lennar Corp.
52.00
0.3
16,751
8.9
2.7
0.74
0.27
GM
General Motors Co.
38.78
3.9
55,367
6.1
23.9
0.97
0.27
NEM
Newmont Goldcorp Corp.
38.66
1.4
31,697
-284.3
-411.8
-0.11
0.26
CCL
Carnival Corp.
45.72
4.4
24,087
10.7
46.9
1.02
0.26
SCHW
The Charles Schwab Corp.
39.90
1.5
52,156
14.9
22.4
1.16
0.26
SNA
Snap-On, Inc.
151.07
2.4
8,340
12.1
29.3
1.03
0.26
PCAR
PACCAR, Inc.
68.34
1.8
23,670
10.0
18.2
1.01
0.26
MTB
M&T Bank Corp.
146.44
2.7
19,577
10.5
28.6
0.77
0.26
FRT
Federal Realty Investment Trust
134.23
3.0
10,145
40.7
123.6
0.49
0.26
OMC
Omnicom Group, Inc.
77.54
3.2
16,866
13.0
41.8
0.73
0.25
SWKS
Skyworks Solutions, Inc.
79.87
1.9
13,713
15.1
28.8
1.47
0.25
ALK
Alaska Air Group, Inc.
63.09
2.1
7,777
15.4
32.7
0.97
0.25
ILMN
Illumina, Inc.
270.00
0.0
39,690
42.3
0.0
1.48
0.25
C
Citigroup, Inc.
65.97
2.7
149,030
9.1
25.0
1.23
0.25
NCLH
Norwegian Cruise Line Holdings Ltd.
52.12
0.0
11,236
11.7
0.0
1.16
0.25
MS
Morgan Stanley
42.18
2.8
69,713
9.1
25.8
1.21
0.24
PSX
Phillips 66
100.91
3.3
45,308
8.7
28.4
1.07
0.24
SYF
Synchrony Financial
32.88
2.6
21,813
6.8
17.4
0.97
0.23
BXP
Boston Properties, Inc.
130.17
2.9
20,120
38.1
111.1
0.63
0.23
MO
Altria Group, Inc.
43.85
7.3
81,916
13.0
95.0
0.52
0.23
CAT
Caterpillar, Inc.
122.70
2.8
69,029
11.3
31.7
1.40
0.22
PPL
PPL Corp.
29.79
5.5
21,515
12.1
66.7
0.26
0.22
IFF
International Flavors & Fragrances, Inc.
117.86
0.0
12,584
34.1
0.0
0.68
0.22
INCY
Incyte Corp.
79.24
0.0
17,041
55.4
0.0
1.12
0.22
CMA
Comerica, Inc.
61.61
4.1
9,202
7.8
32.2
0.95
0.21
LEG
Leggett & Platt, Inc.
38.98
4.0
5,124
18.0
71.2
1.05
0.21
L
Loews Corp.
49.28
0.5
14,901
20.2
10.2
0.89
0.21
AES
The AES Corp.
15.31
3.5
10,163
25.6
90.3
0.64
0.21
CAG
Conagra Brands, Inc.
28.66
3.0
13,946
18.8
55.9
0.63
0.21
HPQ
HP, Inc.
19.10
3.2
28,304
7.0
22.6
1.32
0.20
FBHS
Fortune Brands Home & Security, Inc.
51.57
1.6
7,213
17.8
29.0
1.25
0.20
CMI
Cummins, Inc.
154.90
2.9
24,441
9.4
27.7
1.07
0.20
PBCT
People's United Financial, Inc.
14.77
4.8
5,889
11.3
53.6
0.85
0.20
GIS
General Mills, Inc.
54.96
3.6
33,167
18.9
67.2
0.29
0.20
GPC
Genuine Parts Co.
94.33
3.1
13,779
17.4
54.8
0.63
0.20
IPG
Interpublic Group of Cos., Inc.
20.73
4.3
8,027
12.3
52.7
0.79
0.19
PPG
PPG Industries, Inc.
115.78
1.7
27,358
22.7
37.6
0.84
0.19
NTAP
NetApp, Inc.
51.98
3.2
12,366
13.1
42.2
1.52
0.18
MU
Micron Technology, Inc.
48.97
0.0
54,053
5.5
0.0
1.86
0.18
GS
The Goldman Sachs Group, Inc.
207.21
1.6
74,505
8.6
13.5
1.17
0.17
MPC
Marathon Petroleum Corp.
52.47
3.8
34,541
11.2
42.3
1.35
0.17
SYMC
Symantec Corp.
24.52
1.2
15,154
132.8
162.4
1.24
0.17
DOV
Dover Corp.
95.14
2.0
13,836
23.0
46.5
0.96
0.17
JCI
Johnson Controls International Plc
42.82
2.4
34,072
67.8
164.6
0.80
0.17
OKE
ONEOK, Inc.
71.83
4.7
29,663
23.6
111.9
0.94
0.17
BK
The Bank of New York Mellon Corp.
43.03
2.6
40,562
11.1
29.0
0.77
0.16
GWW
W.W. Grainger, Inc.
278.22
2.0
15,182
18.9
37.4
0.90
0.16
TXT
Textron, Inc.
46.48
0.2
10,696
9.3
1.6
1.25
0.15
KSU
Kansas City Southern
128.91
1.1
12,966
23.0
25.7
1.00
0.15
HCP
HCP, Inc.
35.58
4.2
17,473
17.3
71.8
0.31
0.15
COF
Capital One Financial Corp.
88.19
1.8
41,478
7.6
13.8
1.11
0.15
FANG
Diamondback Energy, Inc.
95.60
0.6
15,586
15.2
9.0
1.28
0.14
SJM
The J. M. Smucker Co.
105.21
3.3
11,998
22.3
72.8
0.20
0.14
MGM
MGM Resorts International
28.30
1.8
14,756
81.8
144.6
1.44
0.14
K
Kellogg Co.
64.22
3.5
21,875
25.5
88.9
0.37
0.14
ABC
AmerisourceBergen Corp.
86.32
1.8
17,982
19.1
35.0
0.80
0.14
PFG
Principal Financial Group, Inc.
54.50
3.9
15,194
10.2
40.1
1.15
0.13
AMP
Ameriprise Financial, Inc.
134.75
2.7
17,634
9.8
26.7
1.46
0.13
NRG
NRG Energy, Inc.
37.74
0.3
9,547
20.7
6.6
0.73
0.13
CPB
Campbell Soup Co.
44.98
3.1
13,545
52.5
163.3
0.29
0.13
CVX
Chevron Corp.
118.26
3.9
224,507
15.2
59.4
0.83
0.12
CMG
Chipotle Mexican Grill, Inc.
836.32
0.0
23,185
93.1
0.0
0.73
0.12
CERN
Cerner Corp.
67.36
0.3
21,447
37.0
9.9
0.90
0.12
QCOM
QUALCOMM, Inc.
78.84
3.1
95,842
27.7
87.0
1.02
0.12
RHI
Robert Half International, Inc.
53.41
2.2
6,278
13.9
30.7
1.34
0.11
SEE
Sealed Air Corp.
39.71
1.6
6,136
17.0
27.4
0.63
0.10
JNPR
Juniper Networks, Inc.
24.17
3.1
8,358
17.0
51.9
1.00
0.10
EMR
Emerson Electric Co.
62.25
3.1
38,290
17.5
55.0
1.15
0.10
XRAY
Dentsply Sirona, Inc.
50.69
0.7
11,363
105.1
72.6
0.71
0.10
MET
MetLife, Inc.
46.23
3.7
43,291
7.5
27.7
1.04
0.09
AIG
American International Group, Inc.
54.85
2.3
47,714
-548.5
-1,280.0
0.94
0.09
FDX
FedEx Corp.
161.87
1.6
42,226
81.1
130.3
1.30
0.09
STX
Seagate Technology Plc
54.33
4.6
14,616
7.6
35.1
1.32
0.07
WFC
Wells Fargo & Co.
47.15
3.7
207,748
9.7
36.1
0.82
0.07
HFC
HollyFrontier Corp.
48.64
2.7
8,005
9.0
24.4
1.36
0.07
PRU
Prudential Financial, Inc.
82.17
4.6
33,032
8.2
38.1
1.18
0.07
BMY
Bristol-Myers Squibb Co.
48.27
3.4
78,958
12.7
42.8
0.86
0.06
LNC
Lincoln National Corp.
55.20
2.6
11,050
7.7
20.0
1.34
0.06
SPG
Simon Property Group, Inc.
151.25
5.4
100,252
21.6
115.6
0.53
0.06
CF
CF Industries Holdings, Inc.
48.64
2.5
10,619
24.0
59.3
1.29
0.06
NKTR
Nektar Therapeutics
17.01
0.0
2,981
-7.0
0.0
1.47
0.06
PM
Philip Morris International, Inc.
72.97
6.2
113,529
14.5
90.7
0.50
0.06
FFIV
F5 Networks, Inc.
132.96
0.0
7,994
17.2
0.0
1.21
0.05
WHR
Whirlpool Corp.
143.88
3.2
9,140
10.1
32.5
1.15
0.05
AAP
Advance Auto Parts, Inc.
147.21
0.2
10,508
24.4
4.0
0.66
0.05
ALB
Albemarle Corp.
63.23
2.2
6,701
12.3
27.3
1.32
0.05
KIM
Kimco Realty Corp.
19.35
5.8
8,167
24.1
139.2
0.66
0.03
NUE
Nucor Corp.
50.16
3.1
15,206
7.1
22.3
1.12
0.03
CELG
Celgene Corp.
97.15
0.0
68,854
13.0
0.0
0.75
0.02
KR
The Kroger Co.
24.70
0.0
19,730
10.7
0.0
0.57
0.02
XRX
Xerox Holdings Corp.
29.85
3.4
6,605
13.2
44.1
1.24
0.00
CFG
Citizens Financial Group, Inc. (Rhode Island)
34.14
3.5
15,263
9.1
31.5
1.00
0.00
FTV
Fortive Corp.
68.47
0.4
22,973
8.8
3.6
1.02
0.00
HPE
Hewlett-Packard Enterprise Co.
14.57
3.1
19,022
-140.5
-433.9
1.33
0.00
KEYS
Keysight Technologies, Inc.
98.05
0.0
18,392
59.1
0.0
1.46
0.00
KHC
The Kraft Heinz Co.
27.28
7.5
33,281
-3.0
-22.5
0.48
0.00
LW
Lamb Weston Holdings, Inc.
71.22
1.1
10,374
22.3
24.5
0.31
0.00
PYPL
PayPal Holdings, Inc.
110.05
0.0
129,492
51.4
0.0
1.43
0.00
QRVO
Qorvo, Inc.
75.45
0.0
8,886
45.5
0.0
1.48
0.00
UA
Under Armour, Inc.
17.78
0.0
8,023
93.9
0.0
1.34
0.00
WRK
WestRock Co.
35.12
5.1
9,037
10.8
55.1
1.28
0.00
URI
United Rentals, Inc.
116.89
0.0
9,019
8.6
0.0
1.91
-0.01
KSS
Kohl's Corp.
48.56
5.3
7,867
10.6
56.1
1.06
-0.01
IP
International Paper Co.
39.43
5.0
15,489
9.9
49.7
1.13
-0.03
WY
Weyerhaeuser Co.
26.71
5.1
19,897
5,806.5
29,565.2
0.86
-0.03
TIF
Tiffany & Co.
88.22
2.5
10,656
19.1
48.3
1.12
-0.04
PNR
Pentair Plc
36.32
2.0
6,103
17.0
33.2
1.05
-0.04
TWTR
Twitter, Inc.
45.42
0.0
35,110
14.7
0.0
1.74
-0.05
PWR
Quanta Services, Inc.
34.22
0.4
4,866
15.5
5.4
1.14
-0.05
LKQ
LKQ Corp.
26.90
0.0
8,290
20.1
0.0
0.99
-0.05
HST
Host Hotels & Resorts, Inc.
16.66
4.8
12,160
11.2
54.0
0.86
-0.07
EMN
Eastman Chemical Co.
68.05
3.6
9,322
10.4
37.0
1.25
-0.07
VNO
Vornado Realty Trust
62.75
4.1
11,973
4.2
17.1
0.61
-0.07
WBA
Walgreens Boots Alliance, Inc.
52.56
3.3
47,469
10.3
34.4
0.96
-0.08
HRB
H&R Block, Inc.
24.14
4.2
4,883
11.4
47.9
0.63
-0.10
IBM
International Business Machines Corp.
140.57
4.5
124,527
14.5
65.1
1.02
-0.10
NWS
News Corp.
14.51
1.4
8,492
54.7
75.4
0.91
-0.11
ADM
Archer-Daniels-Midland Co.
38.71
3.5
21,560
16.5
58.5
0.75
-0.11
REGN
Regeneron Pharmaceuticals, Inc.
292.00
0.0
32,089
15.3
0.0
1.15
-0.12
WAB
Westinghouse Air Brake Technologies Corp.
68.27
0.7
13,087
37.7
26.5
1.04
-0.12
UNM
Unum Group
26.48
3.9
5,524
10.6
41.8
1.24
-0.13
CVS
CVS Health Corp.
62.23
3.2
80,930
17.4
56.0
0.84
-0.13
AAL
American Airlines Group, Inc.
27.79
1.4
12,374
8.3
12.0
1.49
-0.14
NWSA
News Corp.
14.11
1.4
8,258
53.2
75.4
0.93
-0.14
SLG
SL Green Realty Corp.
80.90
4.2
7,012
29.3
121.7
0.63
-0.14
LYB
LyondellBasell Industries NV
78.05
5.2
26,165
8.2
42.4
1.06
-0.15
WDC
Western Digital Corp.
62.24
3.2
18,423
-24.0
-77.2
1.68
-0.15
STT
State Street Corp.
51.84
3.6
19,314
9.3
33.7
1.01
-0.16
MHK
Mohawk Industries, Inc.
118.81
0.0
8,572
11.2
0.0
1.04
-0.17
TAP
Molson Coors Brewing Co.
53.42
3.1
11,554
12.9
39.6
0.62
-0.17
HES
Hess Corp.
64.04
1.6
19,498
-400.3
-625.0
1.60
-0.17
DD
DuPont de Nemours, Inc.
69.22
5.5
51,602
56.8
315.3
1.15
-0.18
COP
ConocoPhillips
53.63
2.2
59,536
8.6
19.2
1.11
-0.18
XOM
Exxon Mobil Corp.
70.93
4.7
300,112
17.1
80.2
0.86
-0.18
WYNN
Wynn Resorts Ltd.
111.44
2.9
11,992
14.4
42.0
1.77
-0.18
DVA
DaVita, Inc.
59.37
0.0
9,517
72.0
0.0
1.06
-0.18
JEF
Jefferies Financial Group, Inc.
19.11
2.2
5,733
50.1
111.4
1.22
-0.18
AGN
Allergan Plc
163.26
1.8
53,554
-6.4
-11.4
0.75
-0.19
BIIB
Biogen, Inc.
224.57
0.0
41,421
8.3
0.0
0.81
-0.19
COTY
Coty, Inc.
10.02
5.0
7,557
-2.0
-9.9
0.93
-0.19
EOG
EOG Resources, Inc.
76.44
1.2
44,362
12.4
15.3
1.24
-0.20
CBS
CBS Corp.
43.63
1.7
16,346
5.3
8.8
0.97
-0.21
TPR
Tapestry, Inc.
23.69
5.7
6,795
10.7
60.7
1.34
-0.22
MCK
McKesson Corp.
143.60
1.1
26,552
47.5
51.7
0.75
-0.23
PVH
PVH Corp.
85.39
0.2
6,396
9.5
1.7
1.32
-0.24
PXD
Pioneer Natural Resources Co.
128.87
0.4
21,539
24.2
9.0
1.37
-0.27
F
Ford Motor Co.
9.34
6.4
37,266
16.9
108.8
0.85
-0.27
DISCA
Discovery, Inc.
27.34
0.0
14,698
11.4
0.0
0.94
-0.28
UAA
Under Armour, Inc.
19.56
0.0
8,826
103.3
0.0
1.34
-0.28
ALXN
Alexion Pharmaceuticals, Inc.
103.84
0.0
23,283
17.4
0.0
1.44
-0.28
NWL
Newell Brands, Inc.
17.24
5.3
7,299
-1.1
-5.7
1.11
-0.29
KMI
Kinder Morgan, Inc.
20.41
4.2
46,204
20.4
85.2
0.83
-0.29
RL
Ralph Lauren Corp.
94.58
2.7
7,305
17.2
46.7
1.11
-0.29
ARNC
Arconic, Inc.
25.99
0.8
11,440
28.8
22.1
1.14
-0.29
WMB
The Williams Cos., Inc.
24.12
6.0
29,233
317.8
1,897.2
0.86
-0.30
DISCK
Discovery, Inc.
25.67
0.0
13,800
10.7
0.0
0.93
-0.31
HBI
Hanesbrands, Inc.
14.12
4.2
5,104
9.1
38.7
1.06
-0.31
FLS
Flowserve Corp.
44.02
1.7
5,774
27.9
48.1
1.51
-0.31
BWA
BorgWarner, Inc.
35.42
1.9
7,314
9.6
18.4
1.25
-0.31
CAH
Cardinal Health, Inc.
45.43
4.2
13,544
10.0
42.2
0.90
-0.31
FCX
Freeport-McMoRan, Inc.
9.42
2.1
13,667
21.2
45.0
1.47
-0.33
GILD
Gilead Sciences, Inc.
64.82
3.7
82,091
13.9
51.6
0.84
-0.33
JWN
Nordstrom, Inc.
31.07
4.8
4,813
10.2
48.5
0.96
-0.34
CXO
Concho Resources, Inc.
69.68
0.4
14,011
27.5
9.9
1.39
-0.34
HP
Helmerich & Payne, Inc.
38.43
7.4
4,205
-56.3
-415.8
1.20
-0.39
COG
Cabot Oil & Gas Corp.
17.55
1.7
7,342
8.9
14.7
0.58
-0.39
MRO
Marathon Oil Corp.
12.45
1.6
10,010
10.5
16.9
1.57
-0.39
HOG
Harley-Davidson, Inc.
32.55
4.6
5,101
11.9
54.7
1.18
-0.40
FTI
TechnipFMC Plc
25.18
2.1
11,242
-5.7
-11.7
1.28
-0.40
DISH
DISH Network Corp.
35.70
0.0
16,777
11.7
0.0
1.30
-0.40
GPS
Gap, Inc.
16.86
5.8
6,335
6.9
39.4
0.90
-0.41
TRIP
TripAdvisor, Inc.
37.88
0.0
5,276
38.5
0.0
1.41
-0.41
MYL
Mylan NV
20.52
0.0
10,585
342.0
0.0
1.39
-0.43
ADS
Alliance Data Systems Corp.
125.96
1.9
6,436
7.8
14.8
1.18
-0.43
DVN
Devon Energy Corp.
23.35
1.5
9,438
2.9
4.2
1.54
-0.43
BEN
Franklin Resources, Inc.
26.92
3.8
13,558
10.0
37.3
0.99
-0.43
OXY
Occidental Petroleum Corp.
45.46
6.9
40,663
9.0
61.6
0.97
-0.43
MOS
The Mosaic Co.
19.54
0.6
7,539
29.2
18.7
1.21
-0.43
MAC
Macerich Co.
30.20
9.9
4,580
39.4
389.7
0.68
-0.44
CPRI
Capri Holdings Ltd.
28.07
0.0
4,254
10.5
0.0
1.17
-0.45
CTL
CenturyLink, Inc.
11.80
13.4
12,871
-1.6
-21.3
0.93
-0.46
NLSN
Nielsen Holdings Plc
21.21
6.6
7,543
-10.9
-72.2
0.90
-0.51
BHGE
Baker Hughes, a GE Co.
23.53
3.1
24,432
67.2
205.7
1.02
-0.51
IVZ
Invesco Ltd.
15.98
7.6
7,714
11.0
83.1
1.09
-0.52
M
Macy's, Inc.
15.39
9.8
4,754
4.6
45.5
1.00
-0.54
LB
L Brands, Inc.
16.71
10.8
4,617
8.0
86.1
1.21
-0.54
VIAB
Viacom, Inc.
25.88
3.1
10,439
6.4
19.7
0.99
-0.55
NBL
Noble Energy, Inc.
22.71
2.0
10,861
-11.8
-23.4
1.47
-0.56
XEC
Cimarex Energy Co.
42.27
1.8
4,288
6.8
12.3
1.56
-0.56
GE
General Electric Co.
8.71
1.7
76,012
-3.6
-6.1
1.09
-0.57
AMG
Affiliated Managers Group, Inc.
78.63
1.6
3,981
-34.4
-54.2
1.21
-0.60
APA
Apache Corp.
22.35
4.5
8,402
-12.0
-53.5
1.36
-0.61
HAL
Halliburton Co.
19.09
3.8
16,721
12.6
47.4
1.24
-0.61
PRGO
Perrigo Co. Plc
49.92
1.6
6,791
77.5
121.1
1.26
-0.61
SLB
Schlumberger NV
34.20
5.8
47,298
22.6
132.5
1.07
-0.64
NOV
National Oilwell Varco, Inc.
22.17
0.9
8,555
-1.6
-1.4
1.24
-0.70
Ticker Name Price Dividend Yield Market Cap ($M) P/E Ratio Payout Ratio Beta Sharpe Ratio
Keep reading this article to learn more about using the Sharpe Ratio to analyze publicly-traded investments.
How To Use The Sharpe Ratios List To Find Compelling Investment Ideas
Having an Excel document with all the S&P 500 stocks sorted by their 5-year Sharpe Ratios can be extremely useful.
The resource becomes even more powerful when combined with a rudimentary knowledge of how to use the filter function of Microsoft Excel to find investment ideas.
With that in mind, this section will show you step-by-step how to implement a particular investing screen using the Sharpe Ratio stocks list. More specifically, we’ll show you how to screen for stocks with 5-year Sharpe Ratios above 1 and forward price-to-earnings ratios below 20.
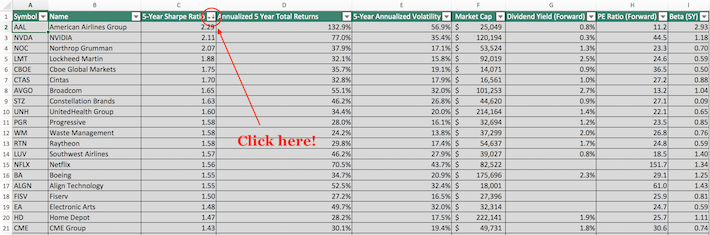
Step 1: Download the Sharpe Ratio Stocks List by clicking here.
Step 2: Click the filter icon at the top of the Sharpe Ratio column, as shown below.
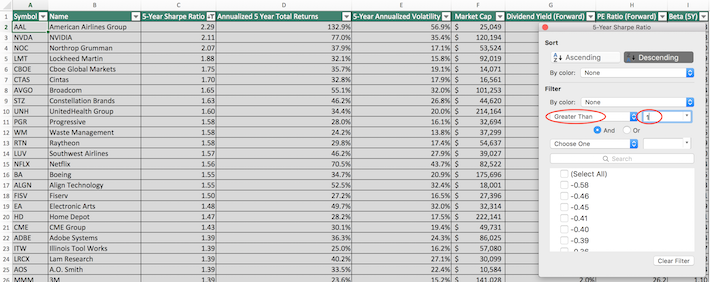
Step 3: Change the filter setting to “Greater Than” and input 1 into the field beside it, as shown below. This filters for S&P 500 stocks with Sharpe Ratios higher than 1.
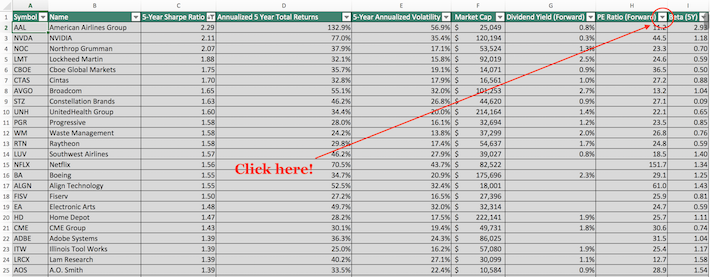
Step 4: Close out of the filter window (by clicking the exit button, not by clicking the “Clear Filter” button in the bottom right corner). Then, click the filter icon at the top of the price-to-earnings ratio column, as shown below.
Step 5: Change the filter setting to “Less Than” and input 20 into the field beside it, as shown below. This filters for S&P 500 stocks with forward price-to-earnings ratios less than 20.
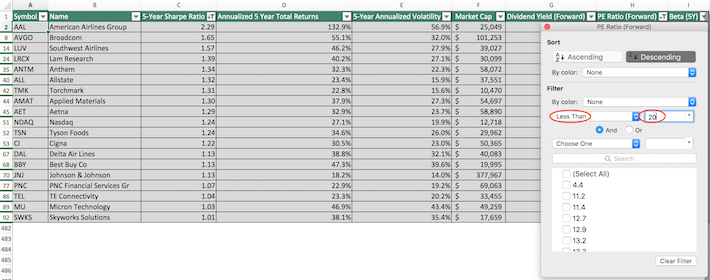
The remaining stocks in this Excel document are S&P 500 stocks with trailing 5-year Sharpe ratios higher than 1 and forward price-to-earnings ratios less than 20.
You now have a solid fundamental understanding of how to use the Sharpe Ratios list to find investment ideas.
The remainder of this article will provide more information on how to analyze stocks using the Sharpe ratio.
What Is The Sharpe Ratio?
The Sharpe ratio is the financial industry’s favorite measure of risk-adjusted returns. It tells investors whether they are being appropriately rewarded for the risks they’re assuming in their investments.
The Sharpe ratio is calculated with the following formula:

There are three components to the Sharpe Ratio calculation:
- Investment return
- Risk free rate of return
- Investment standard deviation
Investment return and investment standard deviation are relatively straightforward and require no explanation.
The risk free rate of return can be different depending on your use case. For most investors, a suitable risk free rate of return is the current yield on 10-year U.S. government bonds.
For this article, we have used a risk free rate of 0, as interest rates have declined significantly in recent months.
The Sharpe ratio is rarely calculated by hand in practice. Instead, investors generally use a tool such as Microsoft Excel for the purpose of Sharpe ratio calculations.
How To Manually Calculate Sharpe Ratios Using Yahoo! Finance
At Sure Dividend, we use YCharts for much of our data analytics. YCharts requires a paid subscription that many of our readers do not have. Accordingly, we want to show you how to manually calculate Sharpe Ratio for publicly-traded stocks over a given time period.
More specifically, this tutorial will show you how to calculate a 3-year Sharpe ratio for Apple, Inc (AAPL).
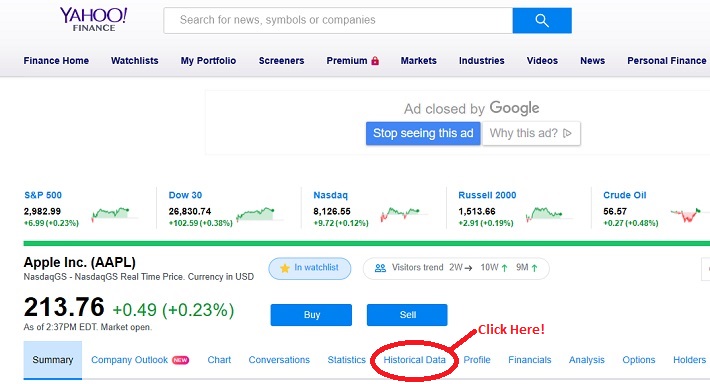
Step 1: Navigate to Yahoo! Finance. Type the ticker of your desired stock into the search bar at the top of the Yahoo! Finance bar. In our case, it’s Apple.
Step 2: Click on historical data, as shown below.
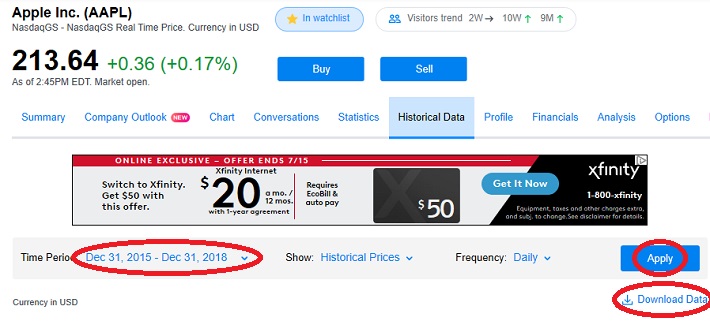
Step 3: Change the dates to the range of your choice, and then click “Apply.” After that, click “Download Data” (which is just below the Apply button).
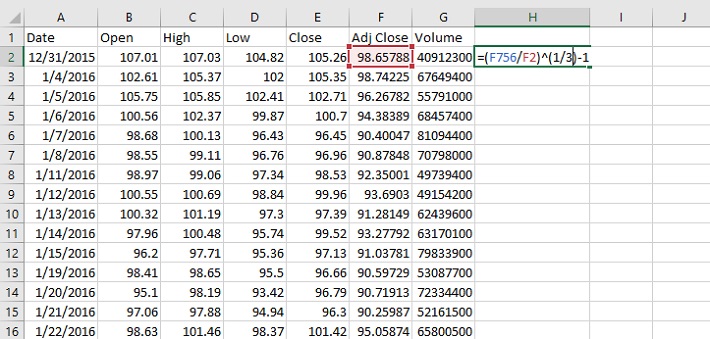
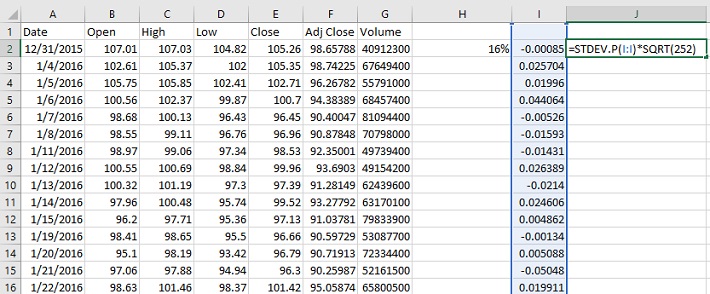
Step 4: The Excel document that will download as a result of your process so far will have six columns: Open, High, Low, Close, Adjusted Close (or “Adj Close” in the top row of the spreadsheet), and Volume. It’s Adjusted Close that we’re interested in, as this accounts for stock splits and dividend payments.
Using the adjusted close column, calculate the stock’s annualized returns during the time period under investigation. In the example shown below, this is done by dividing the current price by the oldest price and then raising this to the inverse power of the number of years during the sample. The equation is shown below.
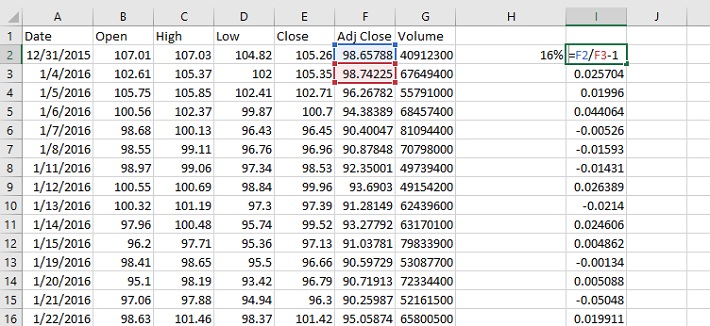
Step 5: Next, a time series of daily returns needs to be calculated. This is done in column I in the spreadsheet shown below.
Step 6: Calculate the standard deviation of daily price returns using the STDEV.P() function, and then convert this number to an annualized figure by multiplying by the square root of 252. We use 252 instead of 365 (the number of days in a year) because there are approximately 252 trading days in an average calendar year. The formula to calculate the annualized standard deviation figure is shown below.
Step 7: Use the annualized return and annualized standard deviation data to calculate a Sharpe ratio. An example of how to do this is shown below, using 0% as the risk free rate of return.
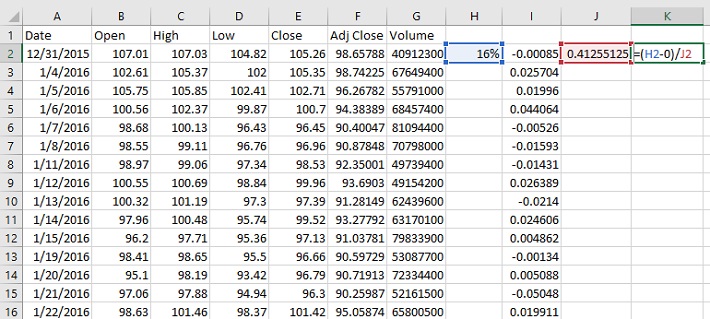
The resulting number is the Sharpe ratio of the investment in question. In this case, Apple had a 3-year Sharpe ratio of 0.40 at the time of this writing.
Final Thoughts
Looking for stocks with strong historical Sharpe ratios is a useful way to find investment ideas.
With that said, this strategy is not the only way to find high-quality investments. To conclude this article, we’ll provide additional resources that you can use for your investment due diligence.
If you are looking for high-quality dividend growth stocks suitable for long-term investment, the following databases will be useful:
- The Dividend Aristocrats List: 25+ years of consecutive dividend increases.
- The Dividend Achievers List: 10+ years of consecutive dividend increases.
- The Dividend Kings: Widely considered to be the “best-of-the-best” when it comes to dividend growth streaks, the Dividend Kings are an exclusive group of dividend stocks with 50+ years of consecutive dividend increases.
You may also be looking for appealing stocks from a certain stock market sector to ensure appropriate diversification within your portfolio. If that is the case, you will find the following resources useful:
- The Complete List Of All Dividend-Paying Utility Stocks
- The Complete List Of All Dividend-Paying Healthcare Stocks
- The Complete List Of All Dividend-Paying Technology Stocks
- The Complete List Of All Dividend-Paying Telecommunications Stocks
- The Complete List Of All Dividend-Paying Materials Stocks
- The Complete List Of All Dividend-Paying Industrial Stocks
- The Complete List Of All Dividend-Paying Consumer Cyclical Stocks
- The Complete List Of All Dividend-Paying Consumer Staples Stocks
- The Complete List Of All Dividend-Paying Energy Stocks
- The Complete List Of All Dividend-Paying Financial Stocks
You may also wish to consider investments within the major market indices. The most well-known benchmarks for large- and small-cap U.S. stocks can be accessed below:
Other great places to look for investment opportunities are international markets. If that appeals to you, the following international stock market indices will be useful: