


Spreadsheet updated daily
Retirees face a number of unique challenges when it comes to managing their investment portfolios.
One of the more specialized challenges is the desire to generate a consistent amount of dividends each month. With that in mind, Sure Dividend maintains stock market databases for stocsk that pay dividends in each month of the calendar year. You can download our list of stocks that pay dividends in November below.
The list of stocks that pay dividends in November available for download at the link above contains the following information for each security in the database:
- Ticker
- Name
- Price
- Dividend Yield
- Market Capitalization
- P/E Ratio
- Beta
Additionally, the table below includes some of the metrics in the free downloadable spreadsheet:
| AAL | American Airlines Group, Inc. | 28.26 | 1.4 | 12,583.4 | 8.5 | 12.0 |
| AAPL | Apple, Inc. | 239.96 | 1.2 | 1,084,422.4 | 20.3 | 25.0 |
| ABBV | AbbVie, Inc. | 77.87 | 5.4 | 115,129.2 | 28.6 | 153.0 |
| ABM | ABM Industries, Inc. | 37.94 | 1.9 | 2,519.8 | 28.3 | 53.3 |
| ABR | Arbor Realty Trust, Inc. | 13.47 | 7.9 | 1,270.8 | 9.4 | 74.6 |
| ABT | Abbott Laboratories | 80.54 | 1.6 | 142,346.4 | ||
| ACC | American Campus Communities, Inc. | 50.73 | 3.6 | 13,940.8 | 83.3 | 303.7 |
| ACN | Accenture Plc | 182.72 | 1.6 | 116,418.4 | 24.4 | 39.0 |
| ADNT | Adient plc | 23.70 | 1.2 | 2,218.8 | -1.2 | -1.4 |
| ADTN | ADTRAN, Inc. | 9.35 | 3.9 | 447.2 | 114.3 | 440.1 |
| AES | The AES Corp. | 16.90 | 3.2 | 11,219.1 | 28.3 | 90.3 |
| AFG | American Financial Group, Inc. | 103.46 | 1.5 | 9,305.4 | 13.0 | 19.4 |
| AGNC | AGNC Investment Corp. | 16.64 | 12.7 | 9,115.7 | -10.8 | -137.7 |
| AGO | Assured Guaranty Ltd. | 46.66 | 1.5 | 4,605.7 | 11.0 | 16.0 |
| AHL | Aspen Insurance Holdings Limited | 0.00 | 0.0 | 0.0 | ||
| AIR | AAR Corp. | 40.32 | 0.7 | 1,410.0 | -385.1 | -286.5 |
| AIT | Applied Industrial Technologies, Inc. | 57.29 | 2.1 | 2,214.4 | 15.4 | 33.1 |
| AIV | Apartment Investment & Management Co. | 54.85 | 2.9 | 8,166.3 | 24.0 | 69.0 |
| ALLY | Ally Financial, Inc. | 30.77 | 2.1 | 12,044.3 | 7.6 | 16.2 |
| ALSN | Allison Transmission Holdings, Inc. | 46.19 | 1.3 | 5,566.2 | 8.8 | 11.4 |
| ALX | Alexander's, Inc. | 355.77 | 5.1 | 1,816.9 | 33.6 | 170.2 |
| AMG | Affiliated Managers Group, Inc. | 75.62 | 1.6 | 3,829.4 | -33.1 | -54.2 |
| AMOT | Allied Motion Technologies, Inc. | 37.21 | 0.3 | 357.2 | 21.2 | 6.8 |
| AMOV | America Movil SAB de CV | 16.20 | 0.0 | 435.5 | 16.3 | 0.0 |
| AMP | Ameriprise Financial, Inc. | 142.45 | 2.6 | 18,642.4 | 10.4 | 26.7 |
| AMTD | TD Ameritrade Holding Corp. | 38.14 | 2.9 | 20,926.2 | 10.1 | 29.4 |
| AMX | America Movil SAB de CV | 16.14 | 0.0 | 36,191.3 | 16.2 | 0.0 |
| ANCX | Access National Corporation | 0.00 | 0.0 | 0.0 | ||
| ANDX | Andeavor Logistics LP | 32.17 | 12.8 | 7,901.9 | 12.6 | 162.0 |
| AON | Aon Plc | 193.42 | 0.8 | 45,616.6 | 34.6 | 29.3 |
| AOS | A. O. Smith Corp. | 51.74 | 1.6 | 7,158.2 | 20.6 | 33.5 |
| APA | Apache Corp. | 22.95 | 4.4 | 8,628.3 | -12.3 | -53.5 |
| APAM | Artisan Partners Asset Management, Inc. | 26.43 | 8.7 | 2,056.5 | 10.7 | 93.1 |
| APD | Air Products & Chemicals, Inc. | 206.97 | 2.2 | 45,606.9 | 26.7 | 58.2 |
| APLE | Apple Hospitality REIT, Inc. | 16.61 | 7.2 | 3,718.5 | 19.1 | 138.3 |
| APO | Apollo Global Management, Inc. | 39.82 | 4.8 | 16,038.1 | 33.7 | 161.9 |
| APOG | Apogee Enterprises, Inc. | 37.80 | 1.8 | 1,003.8 | 22.9 | 41.3 |
| ARCB | ArcBest Corp. | 30.03 | 1.1 | 766.1 | 9.0 | 9.6 |
| ARNC | Arconic, Inc. | 27.08 | 0.7 | 11,920.3 | 30.0 | 22.1 |
| AROC | Archrock, Inc. | 9.74 | 5.4 | 1,480.2 | 23.7 | 128.4 |
| ARR | ARMOUR Residential REIT, Inc. | 17.06 | 13.4 | 1,004.7 | -1.8 | -24.3 |
| ARTNA | Artesian Resources Corp. | 37.30 | 2.6 | 346.1 | 24.2 | 63.0 |
| ASRV | AmeriServ Financial, Inc. | 4.14 | 2.2 | 72.0 | 9.9 | 21.6 |
| ASTE | Astec Industries, Inc. | 31.86 | 1.4 | 718.0 | -304.0 | -419.8 |
| ATLO | Ames National Corp. | 27.63 | 3.4 | 255.1 | 14.9 | 51.4 |
| ATR | AptarGroup, Inc. | 116.66 | 1.2 | 7,471.0 | 33.9 | 40.1 |
| AVAL | Grupo Aval Acciones y Valores SA | 7.68 | 4.2 | 2,750.4 | 8.3 | 35.2 |
| AVH | Avianca Holdings SA | 4.21 | 0.0 | 179.2 | -1.1 | 0.0 |
| AVX | AVX Corp. | 16.38 | 2.8 | 2,769.7 | 10.2 | 28.7 |
| AXP | American Express Co. | 118.61 | 1.3 | 98,407.6 | 14.3 | 19.3 |
| AYI | Acuity Brands, Inc. | 125.47 | 0.4 | 5,006.1 | 15.1 | 6.2 |
| AZZ | AZZ, Inc. | 39.36 | 1.7 | 1,029.3 | 18.1 | 31.3 |
| BAH | Booz Allen Hamilton Holding Corp. | 68.16 | 1.2 | 9,547.4 | 22.4 | 27.6 |
| BAP | Credicorp Ltd. | 208.13 | 0.0 | 16,511.8 | 13.2 | 0.0 |
| BBD | Banco Bradesco SA | 8.64 | 0.5 | 34,139.8 | 12.8 | 6.6 |
| BBDO | Banco Bradesco SA | 8.10 | 0.5 | 32,594.0 | 12.0 | 5.9 |
| BCBP | BCB Bancorp, Inc. | 12.93 | 4.3 | 214.0 | 10.5 | 45.4 |
| BELFB | Bel Fuse, Inc. | 14.17 | 2.0 | 174.5 | 8.6 | 17.1 |
| BFIN | BankFinancial Corp. | 12.26 | 3.3 | 188.5 | 13.2 | 42.9 |
| BGCP | BGC Partners, Inc. | 5.78 | 11.1 | 1,994.7 | 10.8 | 119.7 |
| BGSF | BG Staffing, Inc. | 19.78 | 6.1 | 202.4 | 12.4 | 75.3 |
| BHLB | Berkshire Hills Bancorp, Inc. | 30.78 | 2.9 | 1,566.9 | 15.2 | 44.5 |
| BK | The Bank of New York Mellon Corp. | 46.14 | 2.5 | 43,494.4 | 11.9 | 29.7 |
| BLMN | Bloomin' Brands, Inc. | 18.62 | 2.0 | 1,626.4 | 15.7 | 31.8 |
| BLX | Banco Latinoamericano de Comercio Exterior SA | 20.52 | 7.5 | 765.3 | 9.6 | 71.9 |
| BMO | Bank of Montreal | 74.73 | 4.0 | 47,630.9 | 10.4 | 42.2 |
| BMRC | Bank of Marin Bancorp | 43.92 | 1.7 | 599.2 | 17.3 | 30.1 |
| BMY | Bristol-Myers Squibb Co. | 54.42 | 3.0 | 89,018.6 | 14.3 | 42.8 |
| BNCL | 0.00 | 0.0 | 0.0 | |||
| BOKF | BOK Financial Corp. | 78.91 | 2.5 | 5,617.9 | 11.7 | 29.6 |
| BPFH | Boston Private Financial Holdings, Inc. | 11.96 | 4.0 | 1,003.5 | 10.8 | 43.3 |
| BRG | Bluerock Residential Growth REIT, Inc. | 12.21 | 5.3 | 291.0 | -6.0 | -32.1 |
| BRKL | Brookline Bancorp, Inc. | 15.26 | 2.8 | 1,218.3 | 14.1 | 38.9 |
| BRO | Brown & Brown, Inc. | 36.38 | 0.9 | 10,232.8 | 26.4 | 22.9 |
| BRSS | Global Brass & Copper Holdings, Inc. | 43.99 | 0.8 | 965.7 | 16.0 | 12.0 |
| BSBR | Banco Santander (Brasil) SA | 11.76 | 2.1 | 43,650.9 | 24.3 | 51.4 |
| BSET | Bassett Furniture Industries, Inc. | 15.36 | 3.3 | 155.3 | 31.2 | 101.6 |
| BSRR | Sierra Bancorp | 27.00 | 2.6 | 414.1 | 12.0 | 31.4 |
| BWFG | Bankwell Financial Group, Inc. | 27.92 | 1.8 | 218.9 | 11.7 | 20.9 |
| C | Citigroup, Inc. | 72.06 | 2.6 | 162,787.9 | 9.5 | 24.6 |
| CAG | Conagra Brands, Inc. | 27.37 | 3.1 | 13,319.7 | 19.2 | 59.5 |
| CAKE | Cheesecake Factory, Inc. | 40.54 | 3.3 | 1,796.4 | 16.9 | 55.3 |
| CASY | Casey's General Stores, Inc. | 163.92 | 0.7 | 6,029.5 | 27.5 | 19.9 |
| CAT | Caterpillar, Inc. | 133.69 | 2.6 | 75,212.5 | 12.3 | 31.7 |
| CBRL | Cracker Barrel Old Country Store, Inc. | 161.47 | 3.1 | 3,883.4 | 17.4 | 54.3 |
| CDR | Cedar Realty Trust, Inc. | 3.64 | 5.5 | 324.1 | 40.1 | 220.5 |
| CE | Celanese Corp. | 119.30 | 1.9 | 14,762.2 | 14.8 | 27.8 |
| CF | CF Industries Holdings, Inc. | 46.41 | 2.6 | 10,132.5 | 22.9 | 59.3 |
| CFFN | Capitol Federal Financial, Inc. | 14.42 | 2.4 | 2,039.5 | 20.9 | 49.3 |
| CFG | Citizens Financial Group, Inc. (Rhode Island) | 35.94 | 3.3 | 16,068.3 | 9.6 | 31.5 |
| CG | The Carlyle Group LP | 27.08 | 4.7 | 9,240.9 | 10.6 | 49.3 |
| CHFN | Charter Financial Corporation | 0.00 | 0.0 | 0.0 | ||
| CHKR | Chesapeake Granite Wash Trust | 0.57 | 36.8 | 26.6 | 2.7 | 100.0 |
| CIT | CIT Group, Inc. | 43.99 | 2.5 | 4,165.6 | 9.8 | 24.6 |
| CIVB | Civista Bancshares, Inc. | 22.17 | 1.7 | 347.0 | 16.8 | 28.8 |
| CL | Colgate-Palmolive Co. | 67.06 | 2.5 | 57,537.9 | 25.5 | 64.2 |
| CLB | Core Laboratories NV | 42.32 | 5.2 | 1,877.4 | 20.6 | 107.1 |
| CLCT | Collectors Universe, Inc. | 28.67 | 2.4 | 262.4 | 25.7 | 62.7 |
| CLDT | Chatham Lodging Trust | 17.77 | 7.4 | 833.8 | 33.1 | 245.9 |
| CLX | The Clorox Co. | 148.44 | 2.7 | 18,628.3 | 23.1 | 61.3 |
| CMC | Commercial Metals Co. | 18.60 | 2.5 | 2,228.8 | 13.4 | 34.0 |
| CMCO | Columbus McKinnon Corp. | 37.76 | 0.6 | 891.9 | 16.5 | 9.2 |
| CMRE | Costamare Inc. | 7.06 | 5.7 | 834.4 | 27.0 | 152.8 |
| CMS | CMS Energy Corp. | 63.73 | 2.3 | 18,085.7 | 30.9 | 71.8 |
| CMTL | Comtech Telecommunications Corp. | 32.17 | 1.2 | 780.7 | 31.0 | 38.6 |
| CNA | CNA Financial Corp. | 45.95 | 3.0 | 12,475.7 | 14.3 | 43.6 |
| CNBKA | Century Bancorp, Inc. (Massachusetts) | 88.15 | 0.5 | 490.7 | ||
| CNOB | ConnectOne Bancorp, Inc. | 22.55 | 1.5 | 797.2 | 10.9 | 16.0 |
| CNSL | Consolidated Communications Holdings, Inc. | 3.61 | 32.2 | 260.2 | -5.8 | -185.6 |
| COBZ | CoBiz Financial Inc. | 0.00 | 0.0 | 0.0 | ||
| COF | Capital One Financial Corp. | 92.16 | 1.7 | 43,345.9 | 7.9 | 13.8 |
| COG | Cabot Oil & Gas Corp. | 18.52 | 1.6 | 7,748.6 | 9.4 | 14.7 |
| COKE | Coca-Cola Consolidated, Inc. | 281.28 | 0.4 | 2,636.5 | 392.7 | 139.6 |
| COLB | Columbia Banking System, Inc. | 38.03 | 3.9 | 2,773.9 | 14.7 | 58.1 |
| COLM | Columbia Sportswear Co. | 101.37 | 0.9 | 6,848.3 | 22.5 | 20.8 |
| CORR | CorEnergy Infrastructure Trust, Inc. | 47.31 | 6.3 | 640.2 | 17.7 | 112.4 |
| CPG | Crescent Point Energy Corp. | 3.99 | 3.8 | 2,205.2 | -1.3 | -5.1 |
| CQH | Cheniere Energy Partners LP Holdings, LLC | 0.00 | 0.0 | 0.0 | ||
| CRESY | Cresud SA | 5.06 | 0.0 | 255.8 | 0.9 | 0.0 |
| CRH | CRH Plc | 35.66 | 2.3 | 27,722.8 | 17.6 | 40.2 |
| CRT | Cross Timbers Royalty Trust | 8.63 | 13.8 | 51.8 | 7.2 | 100.0 |
| CSB | VictoryShares US Small Cap High Div Volatility Wtd ETF | 45.08 | 0.0 | 0.0 | ||
| CTO | Consolidated-Tomoka Land Co. | 66.22 | 0.6 | 326.3 | 11.4 | 6.7 |
| CTS | CTS Corp. | 33.85 | 0.5 | 1,105.8 | 21.8 | 10.3 |
| CTSH | Cognizant Technology Solutions Corp. | 59.90 | 1.3 | 33,082.2 | 16.6 | 22.1 |
| CVCY | Central Valley Community Bancorp | 20.29 | 2.0 | 272.9 | 12.4 | 25.0 |
| CVI | CVR Energy, Inc. | 44.71 | 6.7 | 4,494.7 | 11.4 | 76.6 |
| CVLY | Codorus Valley Bancorp, Inc. | 21.46 | 2.7 | 222.7 | 12.1 | 32.0 |
| CVS | CVS Health Corp. | 66.56 | 3.0 | 86,561.3 | 18.6 | 56.0 |
| CWBC | Community West Bancshares | 9.85 | 2.1 | 83.4 | 12.1 | 25.3 |
| CWT | California Water Service Group | 55.07 | 1.4 | 2,651.1 | 44.8 | 62.6 |
| CZFC | Citizens First Corp. | 25.68 | 1.1 | 65.4 | 13.4 | 14.7 |
| CZNC | Citizens & Northern Corp. | 25.84 | 4.2 | 353.7 | 16.9 | 70.7 |
| DCOM | Dime Community Bancshares, Inc. | 22.26 | 2.5 | 800.5 | 16.6 | 41.7 |
| DE | Deere & Co. | 175.15 | 1.7 | 55,150.0 | 16.8 | 28.5 |
| DGICA | Donegal Group, Inc. | 14.41 | 4.0 | 411.7 | 28.7 | 114.6 |
| DIT | AMCON Distributing Co. | 69.20 | 1.0 | 41.0 | 9.5 | 9.9 |
| DLB | Dolby Laboratories, Inc. | 64.45 | 1.1 | 6,538.2 | 25.3 | 28.6 |
| DLPH | Delphi Technologies Plc | 14.25 | 0.0 | 1,250.0 | 5.8 | 0.0 |
| DRAD | Digirad Corp. | 4.11 | 13.4 | 8.3 | -1.4 | -18.4 |
| DRE | Duke Realty Corp. | 34.05 | 2.5 | 12,414.2 | 52.9 | 131.2 |
| DRI | Darden Restaurants, Inc. | 108.82 | 2.9 | 13,341.5 | 18.7 | 53.7 |
| DRYS | DryShips, Inc. | 5.24 | 0.0 | 455.3 | 99.1 | 0.0 |
| EBF | Ennis, Inc. | 19.95 | 4.5 | 520.8 | 13.8 | 62.1 |
| ECC | Eagle Point Credit Co., Inc. | 15.73 | 15.3 | 382.5 | -14.3 | -217.9 |
| EDR | Endeavor Group Holdings, Inc. | 0.00 | 0.0 | 0.0 | ||
| EIG | Employers Holdings, Inc. | 43.36 | 2.0 | 1,374.3 | 8.5 | 16.6 |
| EMCI | EMC Insurance Group, Inc. | 36.01 | 2.5 | 780.5 | 24.0 | 60.7 |
| EPR | EPR Properties | 78.74 | 5.6 | 6,106.8 | 23.3 | 130.3 |
| ERF | Enerplus Corp. | 6.30 | 1.4 | 1,453.0 | 4.5 | 6.5 |
| ETN | Eaton Corp. Plc | 84.72 | 3.2 | 35,582.4 | 16.4 | 53.0 |
| EV | Eaton Vance Corp. | 44.44 | 3.2 | 5,042.4 | 12.5 | 39.3 |
| EWBC | East West Bancorp, Inc. | 43.18 | 2.3 | 6,284.7 | 9.5 | 22.3 |
| EXP | Eagle Materials, Inc. | 95.68 | 0.4 | 4,010.7 | 105.6 | 44.2 |
| FAST | Fastenal Co. | 37.36 | 2.3 | 21,423.3 | 27.4 | 62.3 |
| FBIZ | First Business Financial Services, Inc. | 25.23 | 2.3 | 219.8 | 10.1 | 23.1 |
| FBMS | The First Bancshares, Inc. (Mississippi) | 32.83 | 0.8 | 562.6 | 15.9 | 12.1 |
| FCBC | First Community Bancshares, Inc. (Virginia) | 32.55 | 2.7 | 541.4 | 13.6 | 36.7 |
| FCCO | First Community Corp. (South Carolina) | 19.60 | 2.2 | 145.0 | 13.5 | 29.6 |
| FCCY | 1st Constitution Bancorp | 19.23 | 1.6 | 166.4 | 12.1 | 18.8 |
| FCF | First Commonwealth Financial Corp. (Pennsylvania) | 13.56 | 2.8 | 1,335.7 | 12.9 | 36.1 |
| FCFS | FirstCash, Inc. | 93.14 | 1.0 | 4,072.0 | 25.8 | 26.4 |
| FDEF | First Defiance Financial Corp. | 30.50 | 2.4 | 601.7 | 13.0 | 30.8 |
| FELE | Franklin Electric Co., Inc. | 49.79 | 1.1 | 2,307.2 | 24.3 | 25.8 |
| FIBK | First Interstate BancSystem, Inc. (Montana) | 42.70 | 2.8 | 2,785.3 | 16.1 | 44.4 |
| FII | Federated Investors, Inc. | 31.63 | 3.4 | 3,200.9 | 13.4 | 45.7 |
| FIX | Comfort Systems USA, Inc. | 46.11 | 0.8 | 1,699.3 | 15.9 | 12.8 |
| FMX | Fomento Economico Mexicano SAB de CV | 92.47 | 0.0 | 19,895.8 | 27.7 | 0.0 |
| FRC | First Republic Bank (San Francisco, California) | 106.23 | 0.7 | 17,870.2 | 20.6 | 14.3 |
| FRD | Friedman Industries, Inc. | 6.71 | 3.0 | 47.0 | 27.8 | 83.0 |
| FSBW | FS Bancorp, Inc. | 53.75 | 1.1 | 240.7 | 8.6 | 9.3 |
| FSP | Franklin Street Properties Corp. | 8.74 | 4.1 | 937.2 | 81.8 | 337.1 |
| FTAI | Fortress Transportation & Infrastructure Investors LLC | 15.90 | 8.3 | 1,349.1 | 69.6 | 577.7 |
| FUL | H.B. Fuller Co. | 48.22 | 1.3 | 2,458.4 | 17.5 | 22.9 |
| GABC | German American Bancorp, Inc. | 32.78 | 2.0 | 873.9 | 14.9 | 29.0 |
| GBNK | Guaranty Bancorp | 0.00 | 0.0 | 0.0 | ||
| GCBC | Greene County Bancorp, Inc. | 27.80 | 1.4 | 237.4 | 13.6 | 19.5 |
| GD | General Dynamics Corp. | 179.88 | 2.2 | 51,957.3 | 15.8 | 34.3 |
| GGG | Graco, Inc. | 46.72 | 1.3 | 7,793.1 | 22.8 | 29.9 |
| GHC | Graham Holdings Co. | 650.01 | 0.8 | 3,454.8 | 10.8 | 9.0 |
| GHM | Graham Corp. | 20.60 | 1.9 | 203.5 | -79.5 | -154.4 |
| GIFI | Gulf Island Fabrication, Inc. | 5.56 | 0.0 | 84.7 | -3.5 | 0.0 |
| GIS | General Mills, Inc. | 51.09 | 3.8 | 30,878.5 | 16.4 | 62.9 |
| GLBZ | Glen Burnie Bancorp | 10.97 | 3.6 | 31.0 | 23.7 | 86.4 |
| GLOG | GasLog Ltd. | 14.05 | 4.3 | 1,128.6 | -75.7 | -324.9 |
| GLT | P.H. Glatfelter Co. | 15.28 | 3.4 | 674.9 | -4.1 | -13.8 |
| GNE | Genie Energy Ltd. | 7.62 | 3.9 | 207.6 | 12.9 | 50.7 |
| GNL | Global Net Lease, Inc. | 19.31 | 9.2 | 1,631.4 | 158.7 | 1,458.5 |
| GOOD | Gladstone Commercial Corp. | 22.99 | 6.5 | 732.5 | 432.1 | 2,819.5 |
| GORO | Gold Resource Corp. | 3.87 | 0.5 | 251.2 | 87.2 | 45.5 |
| GOV | Government Properties Income Trust | 0.00 | 0.0 | 0.0 | ||
| GROW | U.S. Global Investors, Inc. | 1.93 | 1.6 | 29.2 | -8.6 | -13.4 |
| GWB | Great Western Bancorp, Inc. (South Dakota) | 35.11 | 3.0 | 2,000.8 | 12.7 | 38.0 |
| GWRS | Global Water Resources, Inc. | 12.06 | 2.4 | 259.7 | 131.8 | 311.6 |
| HAFC | Hanmi Financial Corp. | 19.00 | 5.1 | 592.3 | 13.3 | 67.3 |
| HAS | Hasbro, Inc. | 100.02 | 2.6 | 12,622.6 | 40.6 | 106.4 |
| HBCP | Home Bancorp, Inc. | 38.95 | 2.1 | 366.4 | 11.5 | 23.7 |
| HCAP | Harvest Capital Credit Corp. | 9.90 | 10.8 | 60.1 | 27.2 | 292.3 |
| HCC | Warrior Met Coal, Inc. | 22.29 | 0.9 | 1,149.5 | 1.8 | 1.6 |
| HCFT | Hunt Companies Finance Trust, Inc. | 3.36 | 7.9 | 79.6 | 35.9 | 283.1 |
| HCP | HCP, Inc. | 37.52 | 3.9 | 18,426.4 | 18.2 | 71.8 |
| HFWA | Heritage Financial Corp. (Washington) | 27.65 | 2.5 | 1,019.8 | 15.8 | 38.9 |
| HGT | Hugoton Royalty Trust | 0.00 | 0.0 | 0.0 | ||
| HNRG | Hallador Energy Co. | 3.34 | 4.8 | 101.0 | 11.3 | 54.1 |
| HPT | Hospitality Properties Trust | 25.28 | 8.4 | 4,157.3 | 17.1 | 144.1 |
| HR | Healthcare Realty Trust, Inc. | 34.01 | 3.5 | 4,395.6 | 140.5 | 495.7 |
| HRL | Hormel Foods Corp. | 40.53 | 2.0 | 21,641.8 | 22.0 | 44.3 |
| HSBC | HSBC Holdings Plc | 39.21 | 6.5 | 158,881.3 | 11.2 | 73.0 |
| HSII | Heidrick & Struggles International, Inc. | 27.65 | 2.0 | 524.2 | 9.7 | 19.9 |
| HTBK | Heritage Commerce Corp. | 11.65 | 3.9 | 509.8 | 10.2 | 40.2 |
| HTGC | Hercules Capital, Inc. | 13.61 | 9.2 | 1,419.5 | 10.3 | 94.7 |
| HXL | Hexcel Corp. | 74.87 | 0.8 | 6,431.4 | 21.5 | 17.0 |
| IBCP | Independent Bank Corp. (Michigan) | 21.94 | 3.0 | 493.6 | 12.4 | 37.3 |
| IBTX | Independent Bank Group, Inc. | 52.48 | 1.5 | 2,254.0 | 12.3 | 18.2 |
| IDA | IDACORP, Inc. | 109.09 | 2.3 | 5,497.8 | 24.6 | 55.8 |
| INFY | Infosys Ltd. | 9.16 | 2.5 | 38,698.3 | 18.0 | 45.0 |
| INN | Summit Hotel Properties, Inc. | 12.13 | 5.9 | 1,275.2 | 13.9 | 82.7 |
| INT | World Fuel Services Corp. | 39.47 | 0.7 | 2,603.5 | 18.6 | 13.1 |
| IOSP | Innospec, Inc. | 92.18 | 1.0 | 2,257.1 | 24.5 | 25.2 |
| IRS | IRSA Inversiones y Representaciones SA | 5.06 | 0.0 | 296.3 | -0.9 | 0.0 |
| IRT | Independence Realty Trust, Inc. | 14.98 | 4.8 | 1,366.1 | 36.8 | 176.5 |
| ISBC | Investors Bancorp, Inc. (New Jersey) | 12.15 | 3.5 | 3,351.2 | 18.1 | 62.9 |
| ISDR | Issuer Direct Corp. | 10.75 | 0.5 | 41.5 | 72.3 | 33.6 |
| ITUB | Itaú Unibanco Holding SA | 8.88 | 6.5 | 41,581.4 | 12.8 | 82.8 |
| JBHT | J.B. Hunt Transport Services, Inc. | 117.34 | 0.9 | 12,528.2 | ||
| JEC | Jacobs Engineering Group, Inc. | 93.52 | 0.7 | 12,671.8 | -53.2 | -37.5 |
| JMP | JMP Group LLC | 3.35 | 0.0 | 64.7 | 17.8 | 0.0 |
| KAI | Kadant, Inc. | 87.22 | 1.0 | 982.1 | 15.1 | 15.6 |
| KALU | Kaiser Aluminum Corp. | 98.61 | 2.3 | 1,578.1 | 17.4 | 40.5 |
| KBH | KB Home | 35.99 | 0.5 | 3,209.7 | 13.1 | 6.0 |
| KKR | KKR & Co., Inc. | 27.47 | 2.0 | 23,145.8 | 10.0 | 19.9 |
| KMI | Kinder Morgan, Inc. | 20.32 | 4.4 | 46,000.4 | 22.4 | 99.1 |
| KMPR | Kemper Corp. | 73.60 | 0.0 | 4,888.5 | 12.8 | 0.0 |
| KMT | Kennametal, Inc. | 30.90 | 2.6 | 2,559.4 | 10.5 | 27.2 |
| KOF | Coca-Cola FEMSA SAB de CV | 57.37 | 0.0 | 3,011.0 | 15.5 | 0.0 |
| LAD | Lithia Motors, Inc. | 142.02 | 0.9 | 3,025.4 | 12.4 | 11.1 |
| LAND | Gladstone Land Corp. | 11.84 | 4.5 | 246.4 | ||
| LARK | Landmark Bancorp, Inc. (Kansas) | 22.76 | 3.4 | 99.6 | 9.7 | 33.3 |
| LAZ | Lazard Ltd. | 36.93 | 4.8 | 3,947.2 | 11.1 | 53.8 |
| LBAI | Lakeland Bancorp, Inc. | 15.75 | 3.0 | 795.2 | 11.9 | 35.5 |
| LBY | Libbey, Inc. | 1.98 | 0.0 | 44.2 | -0.8 | 0.0 |
| LCUT | Lifetime Brands, Inc. | 8.36 | 2.0 | 177.7 | -542.9 | -1,103.9 |
| LEN | Lennar Corp. | 61.61 | 0.3 | 19,568.5 | 10.2 | 2.6 |
| LION | Fidelity Southern Corp. | 30.97 | 1.5 | 856.5 | 22.1 | 34.3 |
| LKFN | Lakeland Financial Corp. (Indiana) | 45.69 | 2.4 | 1,170.7 | 13.6 | 32.2 |
| LNC | Lincoln National Corp. | 61.33 | 2.3 | 12,277.8 | 8.5 | 20.0 |
| LNN | Lindsay Corp. | 92.72 | 1.3 | 1,000.1 | 177.6 | 237.5 |
| LNT | Alliant Energy Corp. | 53.37 | 2.6 | 12,676.5 | 24.7 | 63.8 |
| LOB | Live Oak Bancshares, Inc. | 18.29 | 0.6 | 743.9 | 22.9 | 14.9 |
| LOGM | LogMeIn, Inc. | 67.27 | 1.9 | 3,335.4 | 154.8 | 286.8 |
| LOW | Lowe's Cos., Inc. | 112.47 | 1.8 | 86,804.2 | 35.1 | 62.1 |
| LPLA | LPL Financial Holdings, Inc. | 77.46 | 1.3 | 6,364.2 | 12.5 | 16.1 |
| LTC | LTC Properties, Inc. | 52.07 | 4.4 | 2,069.9 | 19.4 | 85.0 |
| LTXB | LegacyTexas Financial Group, Inc. | 45.10 | 2.0 | 2,165.8 | 13.6 | 27.2 |
| LXFR | Luxfer Holdings Plc | 16.35 | 3.0 | 450.6 | 120.4 | 365.7 |
| LYTS | LSI Industries, Inc. | 5.19 | 3.9 | 136.1 | -8.3 | -31.9 |
| MA | Mastercard, Inc. | 261.26 | 0.5 | 265,063.7 | 40.0 | 19.0 |
| MAIN | Main Street Capital Corp. | 42.38 | 5.6 | 2,675.7 | 16.5 | 93.0 |
| MAS | Masco Corp. | 44.27 | 1.1 | 12,814.2 | 18.1 | 19.6 |
| MBT | Mobile TeleSystems PJSC | 8.35 | 8.7 | 8,343.2 | 56.6 | 490.9 |
| MBTF | MBT Financial Corp. | 9.84 | 4.1 | 226.7 | 22.5 | 91.6 |
| MC | Moelis & Co. | 32.00 | 6.1 | 2,324.2 | 13.3 | 80.4 |
| MCBC | Macatawa Bank Corp. | 10.43 | 2.6 | 355.3 | 12.0 | 31.1 |
| MDC | M.D.C. Holdings, Inc. | 45.81 | 2.5 | 2,835.1 | 13.8 | 34.2 |
| MED | Medifast, Inc. | 105.63 | 2.6 | 1,250.2 | 17.6 | 45.4 |
| MIC | Macquarie Infrastructure Corp. | 39.96 | 10.0 | 3,447.0 | 33.6 | 336.6 |
| MINI | Mobile Mini, Inc. | 37.65 | 2.8 | 1,682.7 | -277.0 | -772.6 |
| MKTX | MarketAxess Holdings, Inc. | 340.65 | 0.5 | 12,861.9 | 68.1 | 37.2 |
| MMC | Marsh & McLennan Cos., Inc. | 99.05 | 1.7 | 50,150.1 | 33.8 | 58.0 |
| MMS | MAXIMUS, Inc. | 76.01 | 1.0 | 4,852.8 | 21.6 | 22.6 |
| MN | Manning & Napier, Inc. | 1.75 | 8.0 | 27.3 | 11.5 | 92.3 |
| MPB | Mid Penn Bancorp, Inc. | 25.16 | 2.5 | 213.3 | 13.8 | 34.6 |
| MRLN | Marlin Business Services Corp. | 24.03 | 2.3 | 294.2 | 12.6 | 29.4 |
| MS | Morgan Stanley | 45.38 | 2.8 | 75,002.7 | 9.6 | 26.3 |
| MSB | Mesabi Trust | 24.29 | 14.0 | 322.0 | 8.1 | 113.6 |
| MSBI | Midland States Bancorp, Inc. | 26.54 | 3.5 | 646.6 | 11.6 | 40.5 |
| MSCI | MSCI, Inc. | 216.38 | 1.1 | 18,327.2 | 32.1 | 34.4 |
| MSM | MSC Industrial Direct Co., Inc. | 73.99 | 3.3 | 4,084.3 | 13.9 | 46.5 |
| MWA | Mueller Water Products, Inc. | 11.63 | 1.7 | 1,830.0 | 37.8 | 65.0 |
| NBL | Noble Energy, Inc. | 20.22 | 2.2 | 9,670.3 | -10.5 | -23.4 |
| NBN | Northeast Bank (Maine) | 22.43 | 0.2 | 202.8 | 14.6 | 2.6 |
| NEWM | New Media Investment Group, Inc. | 8.90 | 17.0 | 538.3 | 597.3 | 10,134.2 |
| NFBK | Northfield Bancorp, Inc. (New Jersey) | 16.84 | 2.4 | 829.4 | 21.9 | 53.2 |
| NHI | National Health Investors, Inc. | 84.79 | 4.8 | 3,676.6 | 23.5 | 113.7 |
| NHTC | Natural Health Trends Corp. | 6.71 | 0.0 | 72.4 | 6.5 | 0.0 |
| NI | NiSource, Inc. | 28.27 | 2.8 | 10,554.5 | 92.7 | 259.0 |
| NNN | National Retail Properties, Inc. | 57.57 | 3.5 | 9,881.1 | 40.4 | 140.3 |
| NRE | NorthStar Realty Europe Corp. | 17.02 | 3.5 | 855.9 | 4.7 | 16.5 |
| NRG | NRG Energy, Inc. | 40.75 | 0.3 | 10,309.3 | 22.4 | 6.6 |
| NRT | North European Oil Royalty Trust | 5.97 | 13.6 | 54.9 | 7.4 | 100.8 |
| NTRI | 0.00 | 0.0 | 0.0 | |||
| NUE | Nucor Corp. | 53.14 | 3.0 | 16,109.8 | 7.5 | 22.3 |
| NVEC | NVE Corp. | 66.06 | 6.1 | 320.1 | 22.6 | 136.8 |
| NWBI | Northwest Bancshares, Inc. (Pennsylvania) | 17.47 | 4.1 | 1,863.1 | 16.3 | 66.4 |
| NWFL | Norwood Financial Corp. | 30.91 | 3.0 | 194.5 | 14.1 | 42.9 |
| NWN | Northwest Natural Holding Co. | 70.90 | 2.7 | 2,158.4 | 30.0 | 80.3 |
| NYCB | New York Community Bancorp, Inc. | 13.19 | 5.2 | 6,164.5 | 17.2 | 88.4 |
| NYRT | New York REIT, Inc. | 0.00 | 0.0 | 0.0 | ||
| O | Realty Income Corp. | 79.72 | 3.4 | 25,369.1 | 60.9 | 204.4 |
| OAK | Oaktree Capital Group LLC | 51.52 | 5.9 | 3,907.4 | 17.1 | 101.3 |
| OC | Owens Corning | 64.04 | 1.4 | 6,894.1 | 13.7 | 18.7 |
| OCFC | OceanFirst Financial Corp. | 23.99 | 2.8 | 1,229.3 | 12.8 | 35.3 |
| OFED | Oconee Federal Financial Corp. | 22.80 | 1.8 | 129.2 | 34.5 | 60.6 |
| OHI | Omega Healthcare Investors, Inc. | 44.41 | 5.9 | 9,694.3 | 34.8 | 206.8 |
| OPY | Oppenheimer Holdings, Inc. | 27.91 | 1.6 | 360.1 | 9.9 | 15.6 |
| ORC | Orchid Island Capital, Inc. | 5.84 | 16.6 | 368.2 | -20.6 | -341.4 |
| ORIT | Oritani Financial Corp. | 18.76 | 5.3 | 846.1 | 15.9 | 84.6 |
| ORRF | Orrstown Financial Services, Inc. | 22.41 | 2.5 | 251.5 | 18.3 | 45.7 |
| OSBC | Old Second Bancorp, Inc. | 12.43 | 0.3 | 371.6 | 10.3 | 3.3 |
| OSK | Oshkosh Corp. | 78.50 | 1.3 | 5,367.7 | 9.6 | 12.8 |
| OVBC | Ohio Valley Banc Corp. | 36.55 | 2.3 | 174.3 | 17.6 | 40.4 |
| PAC | Grupo Aeroportuario del Pacífico SAB de CV | 99.57 | 0.0 | 4,773.7 | 20.2 | 0.0 |
| PACW | PacWest Bancorp | 37.33 | 6.4 | 4,412.6 | 9.7 | 62.4 |
| PAYX | Paychex, Inc. | 83.27 | 2.8 | 29,806.0 | 28.4 | 80.4 |
| PBA | Pembina Pipeline Corp. | 35.88 | 4.8 | 18,352.6 | 15.6 | 75.6 |
| PBCT | People's United Financial, Inc. | 16.70 | 4.2 | 6,659.1 | 12.7 | 53.4 |
| PBF | PBF Energy, Inc. | 30.44 | 4.0 | 3,640.0 | 153.9 | 608.3 |
| PBHC | Pathfinder Bancorp, Inc. | 13.01 | 1.8 | 61.3 | 17.9 | 33.0 |
| PBT | Permian Basin Royalty Trust | 4.22 | 11.7 | 196.7 | 8.6 | 100.0 |
| PCTI | PCTEL, Inc. | 7.73 | 2.8 | 142.9 | -13.1 | -37.4 |
| PEBO | Peoples Bancorp, Inc. (Ohio) | 32.91 | 3.7 | 681.2 | 12.8 | 47.4 |
| PER | SandRidge Permian Trust | 1.68 | 24.4 | 88.2 | 4.1 | 99.7 |
| PETS | PetMed Express, Inc. | 27.37 | 3.9 | 552.2 | 21.0 | 83.0 |
| PFIN | P&F Industries, Inc. | 6.48 | 3.1 | 20.4 | 3.4 | 10.4 |
| PFLT | PennantPark Floating Rate Capital Ltd. | 11.51 | 9.9 | 446.3 | 29.6 | 293.6 |
| PFS | Provident Financial Services, Inc. | 25.04 | 3.5 | 1,668.2 | 12.9 | 45.2 |
| PG | Procter & Gamble Co. | 122.18 | 2.4 | 305,771.3 | 83.7 | 198.5 |
| PGC | Peapack-Gladstone Financial Corp. | 28.00 | 0.7 | 544.8 | 12.2 | 8.7 |
| PIR | Pier 1 Imports, Inc. | 7.33 | 0.0 | 31.3 | -0.1 | 0.0 |
| PKE | Park Aerospace Corp. | 16.41 | 2.4 | 335.5 | 33.5 | 81.9 |
| PKI | PerkinElmer, Inc. (United States) | 83.97 | 0.3 | 9,327.1 | 36.8 | 12.3 |
| PKOH | Park-Ohio Holdings Corp. | 31.50 | 1.6 | 393.1 | 8.1 | 12.8 |
| PMD | Psychemedics Corp. | 9.25 | 7.8 | 51.0 | 14.4 | 112.0 |
| PNC | The PNC Financial Services Group, Inc. | 145.46 | 2.7 | 64,767.1 | ||
| PNFP | Pinnacle Financial Partners, Inc. | 59.78 | 1.1 | 4,599.3 | 11.4 | 12.3 |
| PNM | PNM Resources, Inc. | 52.14 | 2.2 | 4,150.0 | -167.4 | -364.6 |
| PNR | Pentair Plc | 39.39 | 1.8 | 6,619.5 | 18.4 | 33.2 |
| POOL | Pool Corp. | 212.90 | 0.9 | 8,499.4 | 32.6 | 30.6 |
| PTR | PetroChina Co., Ltd. | 51.16 | 0.0 | 10,842.7 | 5.4 | 0.0 |
| PUB | People's Utah Bancorp | 29.24 | 1.5 | 550.5 | 12.9 | 19.8 |
| PZN | Pzena Investment Management, Inc. | 8.38 | 1.4 | 587.2 | 12.0 | 17.2 |
| PZZA | Papa John's International, Inc. | 56.56 | 1.6 | 1,811.1 | -69.1 | -109.2 |
| REG | Regency Centers Corp. | 69.65 | 3.3 | 11,694.7 | 40.7 | 133.1 |
| RELL | Richardson Electronics Ltd. | 5.59 | 4.3 | 73.4 | -9.4 | -40.5 |
| RGA | Reinsurance Group of America, Inc. | 157.55 | 1.5 | 9,888.0 | 12.7 | 19.3 |
| RGCO | RGC Resources, Inc. | 29.76 | 2.2 | 240.0 | 26.7 | 58.4 |
| RGR | Sturm, Ruger & Co., Inc. | 45.58 | 2.5 | 793.1 | 19.5 | 47.9 |
| RILY | B. Riley Financial, Inc. | 23.73 | 1.3 | 639.9 | 25.8 | 34.7 |
| RMAX | RE/MAX Holdings, Inc. | 33.26 | 2.5 | 593.1 | 21.6 | 53.2 |
| RMR | The RMR Group, Inc. | 47.10 | 2.8 | 1,471.2 | 10.3 | 28.3 |
| ROYT | Pacific Coast Oil Trust | 1.37 | 23.2 | 52.9 | 4.2 | 97.4 |
| RRR | Red Rock Resorts, Inc. | 21.16 | 1.9 | 2,502.5 | 47.1 | 88.3 |
| RTN | Raytheon Co. | 204.71 | 1.8 | 57,010.5 | 18.8 | 33.3 |
| RUTH | Ruth's Hospitality Group, Inc. | 19.76 | 2.4 | 593.9 | 13.9 | 33.8 |
| RY | Royal Bank of Canada | 81.13 | 3.7 | 117,532.7 | 12.2 | 45.1 |
| SAL | Salisbury Bancorp, Inc. | 38.16 | 2.9 | 107.8 | 10.7 | 31.3 |
| SAN | Banco Santander SA | 4.36 | 4.4 | 72,401.5 | 9.2 | 40.2 |
| SASR | Sandy Spring Bancorp, Inc. | 34.56 | 3.4 | 1,231.0 | 10.9 | 36.5 |
| SBBX | SB One Bancorp | 22.55 | 1.3 | 213.3 | 11.3 | 15.1 |
| SBFG | SB Financial Group, Inc. | 16.63 | 2.0 | 107.5 | 10.9 | 22.2 |
| SBR | Sabine Royalty Trust | 38.60 | 9.2 | 562.8 | 11.2 | 102.9 |
| SBRA | Sabra Health Care REIT, Inc. | 23.70 | 7.6 | 4,491.5 | 207.9 | 1,578.9 |
| SBSI | Southside Bancshares, Inc. | 35.18 | 3.4 | 1,187.3 | 16.1 | 55.2 |
| SC | Santander Consumer USA Holdings, Inc. | 25.39 | 3.2 | 8,784.7 | 9.4 | 29.8 |
| SCCO | Southern Copper Corp. | 35.66 | 4.5 | 27,319.9 | 18.9 | 85.8 |
| SCHN | Schnitzer Steel Industries, Inc. | 21.01 | 3.6 | 562.6 | 5.5 | 19.7 |
| SCHW | The Charles Schwab Corp. | 40.92 | 1.6 | 53,489.8 | 15.0 | 23.5 |
| SDR | Sandridge Mississippian Trust II | 0.43 | 39.7 | 21.4 | 2.5 | 99.7 |
| SDT | Sandridge Mississippian Trust I | 0.49 | 35.5 | 13.6 | 2.8 | 98.9 |
| SEB | Seaboard Corp. | 4,155.88 | 0.2 | 4,841.6 | 82.1 | 14.8 |
| SGC | Superior Group of Cos., Inc. | 16.16 | 2.5 | 246.5 | 15.2 | 37.7 |
| SHBI | Shore Bancshares, Inc. | 15.71 | 2.4 | 200.8 | 8.2 | 19.2 |
| SHLM | A. Schulman, Inc. | 0.00 | 0.0 | 0.0 | ||
| SIFI | SI Financial Group, Inc. | 14.86 | 1.6 | 178.8 | 16.4 | 26.5 |
| SIG | Signet Jewelers Ltd. | 16.22 | 8.4 | 847.7 | -3.9 | -32.4 |
| SIMO | Silicon Motion Technology Corp. | 37.86 | 0.0 | 1,387.8 | 17.1 | 0.0 |
| SIR | Select Income REIT | 0.00 | 0.0 | 0.0 | ||
| SIRI | Sirius XM Holdings, Inc. | 6.40 | 0.7 | 28,478.8 | 27.8 | 20.6 |
| SJR | Shaw Communications, Inc. | 19.96 | 4.5 | 10,270.7 | 17.7 | 79.3 |
| SJT | San Juan Basin Royalty Trust | 2.67 | 0.0 | 124.4 | 7.2 | 0.0 |
| SKIS | Peak Resorts, Inc. | 11.00 | 2.5 | 167.5 | -68.8 | -175.0 |
| SKT | Tanger Factory Outlet Centers, Inc. | 17.54 | 8.0 | 1,640.8 | 22.6 | 181.1 |
| SLP | Simulations Plus, Inc. | 34.07 | 0.7 | 593.8 | 75.7 | 53.6 |
| SM | SM Energy Co. | 7.25 | 1.3 | 847.6 | 17.4 | 23.2 |
| SMBC | Southern Missouri Bancorp, Inc. | 36.08 | 1.4 | 332.0 | 11.5 | 16.5 |
| SNH | Senior Housing Properties Trust | 9.80 | 13.5 | 2,329.8 | -29.1 | -392.6 |
| SNN | Smith & Nephew Plc | 43.52 | 1.6 | 19,016.9 | 27.3 | 44.3 |
| SONA | Southern National Bancorp of Virginia, Inc. | 15.55 | 2.2 | 375.4 | 11.7 | 25.6 |
| SONC | Sonic Corp. | 0.00 | 0.0 | 0.0 | ||
| SPG | Simon Property Group, Inc. | 154.51 | 5.2 | 102,413.3 | 22.0 | 115.6 |
| SRCE | 1st Source Corp. | 50.51 | 2.1 | 1,289.8 | 14.3 | 29.9 |
| SSB | South State Corp. | 77.30 | 1.9 | 2,671.4 | 15.2 | 29.0 |
| SSBI | Summit State Bank (California) | 12.34 | 3.9 | 73.2 | 14.3 | 55.7 |
| SSFN | Stewardship Financial Corp. | 15.75 | 0.8 | 137.2 | 19.5 | 14.8 |
| STAG | STAG Industrial, Inc. | 30.75 | 4.6 | 4,210.5 | ||
| STBA | S&T Bancorp, Inc. | 37.25 | 2.8 | 1,282.8 | 12.1 | 34.4 |
| STL | Sterling Bancorp (Montebello, New York) | 20.33 | 1.4 | 4,169.6 | 10.4 | 14.3 |
| STZ | Constellation Brands, Inc. | 196.81 | 1.5 | 37,715.8 | 47.7 | 72.2 |
| SXI | Standex International Corp. | 73.66 | 1.1 | 916.3 | 19.6 | 20.7 |
| SYF | Synchrony Financial | 34.97 | 2.4 | 23,200.5 | 6.3 | 15.4 |
| SYNL | Synalloy Corp. | 15.38 | 0.0 | 138.3 | 30.8 | 0.0 |
| SYX | Systemax, Inc. | 23.93 | 1.9 | 897.0 | 24.0 | 46.1 |
| T | AT&T, Inc. | 38.17 | 5.3 | 278,908.2 | 16.0 | 85.1 |
| TAIT | Taitron Components, Inc. | 2.66 | 4.3 | 15.3 | 11.1 | 47.8 |
| TBNK | Territorial Bancorp, Inc. | 29.00 | 3.0 | 280.5 | 12.7 | 38.7 |
| TECH | Bio-Techne Corp. | 200.26 | 0.6 | 7,638.7 | 78.8 | 50.3 |
| TESS | TESSCO Technologies, Inc. | 15.77 | 5.1 | 134.4 | 69.7 | 353.8 |
| THO | Thor Industries, Inc. | 60.16 | 2.6 | 3,334.1 | 24.8 | 63.9 |
| TILE | Interface, Inc. | 15.38 | 1.7 | 898.7 | 17.9 | 30.2 |
| TIPT | Tiptree, Inc. | 7.39 | 2.0 | 255.3 | 56.1 | 110.1 |
| TJX | The TJX Cos., Inc. | 60.36 | 1.4 | 73,196.8 | 24.0 | 33.8 |
| TK | Teekay Corp. | 5.07 | 0.0 | 511.0 | -3.3 | 0.0 |
| TMK | Torchmark Corp. | 88.10 | 0.8 | 9,685.8 | 13.7 | 10.3 |
| TMP | Tompkins Financial Corp. | 84.01 | 2.4 | 1,268.4 | 16.0 | 38.2 |
| TNK | Teekay Tankers Ltd. | 2.15 | 0.0 | 532.6 | -73.9 | 0.0 |
| TRCB | Two River Bancorp | 21.04 | 1.1 | 182.9 | 15.4 | 17.2 |
| TRGP | Targa Resources Corp. | 40.09 | 9.1 | 9,332.2 | -30.7 | -278.5 |
| TS | Tenaris SA | 20.68 | 0.0 | 12,307.1 | 12.7 | 0.0 |
| TSBK | Timberland Bancorp, Inc. (Washington) | 26.50 | 2.1 | 221.0 | 9.7 | 20.5 |
| TXN | Texas Instruments Incorporated | 128.57 | 2.3 | 120,035.5 | 23.1 | 52.6 |
| UBNK | United Financial Bancorp, Inc. | 14.51 | 3.3 | 735.8 | 21.4 | 71.1 |
| UBSH | 0.00 | 0.0 | 0.0 | |||
| UCFC | United Community Financial Corp. | 11.57 | 2.5 | 541.9 | 14.9 | 37.1 |
| UIHC | United Insurance Holdings Corp. | 12.71 | 1.9 | 542.1 | -33.5 | -64.0 |
| ULH | Universal Logistics Holdings, Inc. | 25.30 | 1.7 | 685.3 | 11.7 | 19.6 |
| UNB | Union Bankshares, Inc. (Vermont) | 33.35 | 3.7 | 149.0 | 19.9 | 73.4 |
| UNM | Unum Group | 28.96 | 3.6 | 6,042.0 | 11.6 | 41.8 |
| UPS | United Parcel Service, Inc. | 116.10 | 3.2 | 99,768.8 | 21.1 | 68.1 |
| UTL | UNITIL Corp. | 63.36 | 2.3 | 939.7 | 21.3 | 49.7 |
| UVV | Universal Corp. | 54.93 | 5.5 | 1,371.7 | 14.9 | 81.4 |
| VALU | Value Line, Inc. | 24.35 | 3.2 | 235.2 | 20.1 | 64.3 |
| VET | Vermilion Energy, Inc. | 15.39 | 13.5 | 2,357.9 | 8.9 | 120.4 |
| VIVO | Meridian Bioscience, Inc. | 9.99 | 0.0 | 427.1 | 16.5 | 0.0 |
| VNO | Vornado Realty Trust | 63.65 | 4.1 | 12,145.2 | 4.2 | 17.1 |
| VOC | VOC Energy Trust | 5.24 | 13.8 | 89.1 | 7.2 | 100.0 |
| VRTS | Virtus Investment Partners, Inc. | 98.16 | 2.2 | 690.4 | 10.0 | 22.1 |
| VSEC | VSE Corp. | 33.97 | 1.0 | 372.7 | 10.4 | 10.1 |
| VZ | Verizon Communications, Inc. | 60.77 | 4.0 | 251,344.7 | 15.9 | 62.9 |
| WAB | Westinghouse Air Brake Technologies Corp. | 70.54 | 0.7 | 13,522.4 | 38.9 | 26.5 |
| WABC | Westamerica Bancorporation | 65.89 | 2.5 | 1,777.8 | 22.5 | 55.4 |
| WAFD | Washington Federal, Inc. | 36.72 | 2.2 | 2,906.9 | 14.1 | 30.3 |
| WAYN | Wayne Savings Bancshares, Inc. | 22.40 | 3.2 | 62.3 | 9.5 | 30.7 |
| WBS | Webster Financial Corp. | 44.05 | 3.2 | 4,015.4 | 10.4 | 33.3 |
| WCFB | WCF Bancorp, Inc. | 8.38 | 2.4 | 21.5 | -275.7 | -657.9 |
| WCN | Waste Connections, Inc. | 93.50 | 0.7 | 24,544.7 | 44.2 | 29.4 |
| WDR | Waddell & Reed Financial, Inc. | 15.34 | 6.5 | 1,121.0 | 7.5 | 48.7 |
| WETF | WisdomTree Investments, Inc. | 4.90 | 2.4 | 766.2 | 39.6 | 96.3 |
| WGO | Winnebago Industries, Inc. | 44.11 | 1.0 | 1,351.4 | 12.7 | 12.5 |
| WMK | Weis Markets, Inc. | 36.54 | 3.4 | 980.7 | 15.8 | 53.3 |
| WRK | WestRock Co. | 37.65 | 4.8 | 9,688.9 | 11.6 | 55.1 |
| WSBF | Waterstone Financial, Inc. | 17.30 | 2.8 | 475.6 | 15.2 | 42.0 |
| WSFS | WSFS Financial Corp. | 44.89 | 1.0 | 2,403.5 | 14.1 | 14.0 |
| WSM | Williams-Sonoma, Inc. | 71.23 | 2.6 | 5,557.5 | 16.1 | 41.1 |
| WSR | Whitestone REIT | 13.98 | 8.2 | 562.5 | 30.7 | 250.4 |
| WST | West Pharmaceutical Services, Inc. | 138.82 | 0.4 | 10,237.8 | 44.9 | 19.4 |
| WSTG | Wayside Technology Group, Inc. | 14.62 | 4.7 | 65.9 | 10.3 | 48.1 |
| WTBA | West Bancorporation, Inc. | 22.58 | 3.6 | 369.9 | 13.2 | 47.3 |
| WTFC | Wintrust Financial Corp. | 65.48 | 1.4 | 3,731.0 | 10.9 | 15.6 |
| WWD | Woodward, Inc. | 106.60 | 0.6 | 6,592.8 | 24.7 | 14.6 |
| WWW | Wolverine World Wide, Inc. | 28.93 | 1.2 | 2,483.4 | 15.3 | 18.9 |
| WYNN | Wynn Resorts Ltd. | 115.70 | 2.8 | 12,451.2 | 15.0 | 42.0 |
| ZION | Zions Bancorporation NA | 48.08 | 2.5 | 8,508.4 | 11.0 | 27.3 |
| Ticker | Name | Price | Dividend Yield | Market Cap ($M) | P/E Ratio | Payout Ratio |
Keep reading this article to learn more about how you can use our list of stocks that pay dividends in November to improve your investing outcomes.
How To Use The List of Stocks That Pay Dividends in November to Find Investment Ideas
Having an Excel database that contains the names, tickers, and financial data for every stock that pays dividends in November can be extremely powerful.
This database becomes even more useful when combined with a working knowledge of Microsoft Excel.
With that in mind, this tutorial will demonstrate how you can implement two actionable investing screens to our list of stocks that pay dividends in November.
The first screen that we’ll implement is for stocks that pay dividends in november with dividend yields above 4% and dividend payout ratios below 70%.
Screen 1: Dividend Yields Above 4%, Dividend Payout Ratios Below 70%
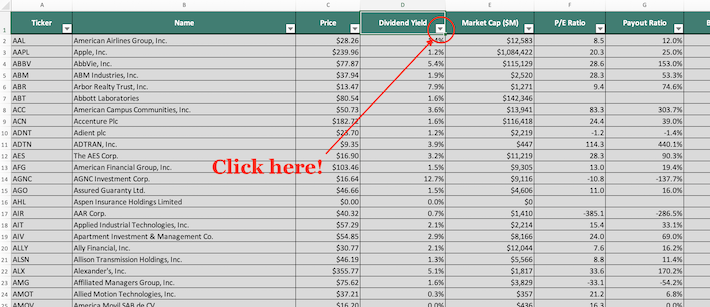
Step 1: Download your free list of stocks that pay dividends in November by clicking here. Apply Excel’s Filter function to each column in the spreadsheet.
Step 2: Click the filter icon at the top of the dividend yield column, as shown below.
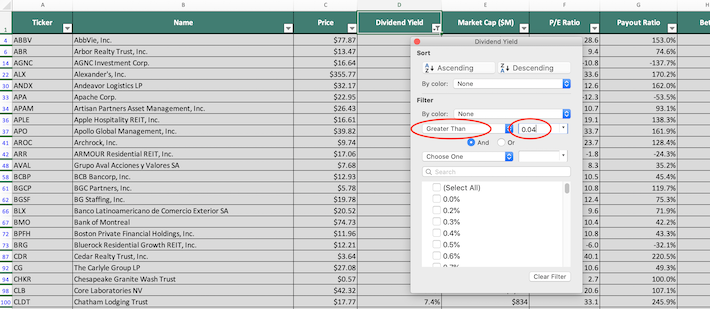
Step 3: Change the filter setting to “Greater Than” and input 0.04 into the field beside it. Since dividend yield is measured in percentage points, this will filter for stocks that pay dividends in November with dividend yields above 4%.
Step 4: Close out of the filter window (by clicking the exit button, not by clicking the “Clear Filter” button in the bottom right corner). Next, click the filter icon at the top of the payout ratio column, as shown below.
Step 5: Change the primary filter setting to “Less Than” and input 0.7 into the field beside it. This will filter for stocks that pay dividends in November that have payout ratios below 70%.
Additionally, change the secondary filter setting to “Greater Than” and input 0 into the field beside it. This will filter for stocks with non-negative payout ratios, which is important because it excludes companies with negative earnings.

The remainder of the stocks that show in this Excel sheet are stocks that pay dividends in November with dividend yields above 4% and payout ratios below 70%.
The next filter that we’ll demonstrate how to implement is for stocks that pay dividends in November with market capitalizations below $5 billion and price-to-earnings ratios below 10.
Screen 2: Market Capitalizations Below $5 Billion and Price-to-Earnings Ratios Below 10
Step 1: Download your free list of stocks that pay dividends in November by clicking here. Apply Excel’s Filter function to each column in the spreadsheet.
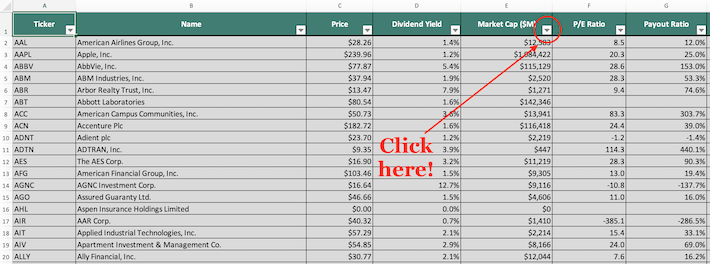
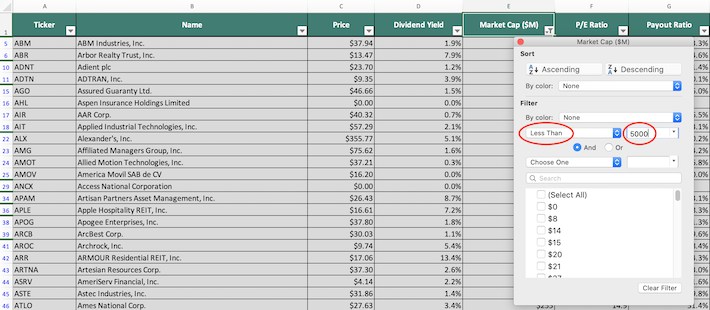
Step 2: Click the filter icon at the top of the market capitalization column, as shown below.
Step 3: Change the filter setting to “Less Than” and input 5000 into the field beside it. Since market capitalization is measured in millions of dollars in this spreadsheet, this is equivalent to filtering for stocks with market capitalizations below $5 billion.
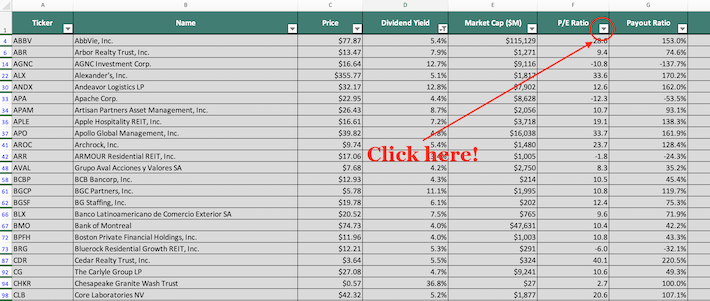
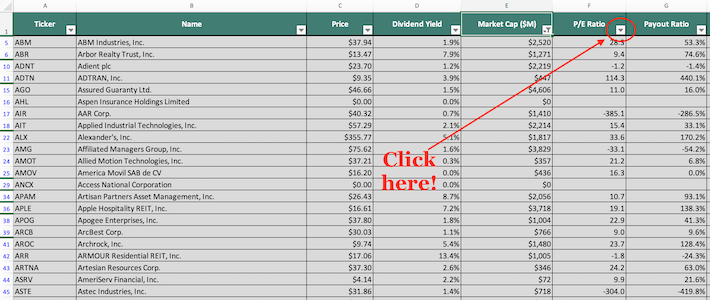
Step 4: Close out of the filter window (by clicking the exit button, not by clicking the “Clear Filter” button in the bottom right corner). Next, click the filter icon at the top of the price-to-earnings ratio column, as shown below.
Step 5: Change the filter setting to “Less Than” and input 10 into the field beside it. This will filter for stocks that pay dividends in November with price-to-earnings ratios below 10.
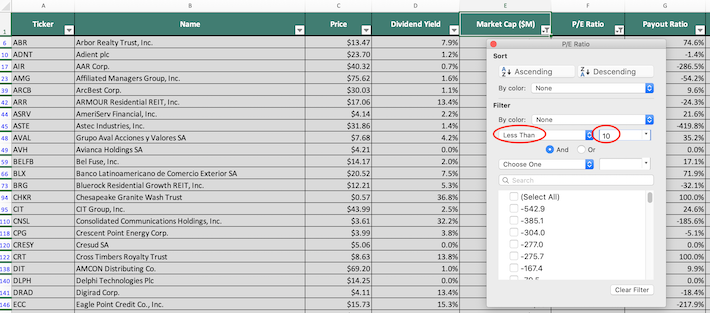
The remaining stocks in this spreadsheet are stocks that pay dividends in November with market capitalizations below $5 billion and price-to-earnings below 10.
You now have a solid, fundamental understanding of how to use our list of stocks that pay dividends in November to find investment ideas.
To conclude this article, we’ll introduce other investing resources that you can use to improve your investing outcomes.
Final Thoughts: Other Useful Investing Databases
Having a list of stocks that pay dividends in November is very useful, but it becomes tremendously more useful when combined with similar lists to the other 11 months of the calendar year.
You can access databases for every non-November calendar month at the links below:
- January Dividend Stocks
- February Dividend Stocks
- March Dividend Stocks
- April Dividend Stocks
- May Dividend Stocks
- June Dividend Stocks
- July Dividend Stocks
- August Dividend Stocks
- September Dividend Stocks
- October Dividend Stocks
- December Dividend Stocks
Having a similar level of sector diversification is also important.
Fortunately, Sure Dividend also provides databases for each of the ten major sectors within the stock market. You can access these stock market databases below:
- The Complete List of Dividend-Paying Technology Stocks
- The Complete List of Dividend-Paying Consumer Cyclical Stocks
- The Complete List of Dividend-Paying Consumer Staples Stocks
- The Complete List of Dividend-Paying Energy Stocks
- The Complete List of Dividend-Paying Utility Stocks
- The Complete List of Dividend-Paying Industrial Stocks
- The Complete List of Dividend-Paying Telecommunications Stocks
- The Complete List of Dividend-Paying Materials Stocks
- The Complete List of Dividend-Paying Financial Sector Stocks
- The Complete List of Dividend-Paying Healthcare Stocks
Once your diversification needs are met, you should focus on investing in the best opportunities available (without any heed to diversification).
Our research suggests that the best investmetn opportunities are among stocks with long histories of steadily increasing their dividend payments.
With that in mind, we have created the following stock market databases for your use:
- The Dividend Aristocrats: S&P 500 stocks with 25+ years of consecutive dividend increases
- The Dividend Achievers: dividend stocks with 10+ years of consecutive dividend increases
- The Dividend Kings: dividend stocks with 50+ years of consecutive dividend increases
This trend – that dividend growth stocks deliver excellent performance when purchased at attractive prices – is really the basis of our research philosophy at Sure Dividend. In fact, we publish three month research publications focused on this belief:
- The Sure Dividend Newsletter: “normal” dividend growth stocks
- The Sure Retirement Newsletter: high yield (4%+) dividend stocks