


Updated weekly on Wednesdays
One of the unique challenges that retirees face is creating an investment portfolio that creates a roughly equal amount of dividend income each month.
This challenge can be overcome by selectively investing similar amounts in securities that pay dividends in each calendar month.
With that in mind, Sure Dividend has created a database of stocks that pay dividends in January. You can access the database below:
The January-paying dividend stocks list available for download above contains the following metrics for each stock:
- Name
- Ticker
- Stock price
- Dividend yield
- Market capitalization
- P/E Ratio
- Payout Ratio
- Beta
Additionally, you can find and sort January paying dividend stocks using the table below.
| A | Agilent Technologies, Inc. | 76.15 | 0.9 | 23,566.0 | 22.5 | 19.4 |
| AAN | Aaron's, Inc. | 77.13 | 0.2 | 5,209.9 | 25.6 | 4.7 |
| AAP | Advance Auto Parts, Inc. | 166.41 | 0.1 | 11,879.5 | 27.6 | 4.0 |
| ABCB | Ameris Bancorp | 44.08 | 1.0 | 3,064.4 | 15.3 | 15.6 |
| ABEV | Ambev SA | 4.37 | 1.9 | 68,754.5 | 23.3 | 43.5 |
| AC | Associated Capital Group, Inc. | 39.45 | 0.5 | 888.2 | -35.5 | -18.0 |
| ACRE | Ares Commercial Real Estate Corp. | 15.40 | 8.4 | 444.6 | 11.5 | 96.9 |
| ACU | Acme United Corp. | 20.83 | 2.3 | 69.8 | 13.6 | 31.4 |
| ADC | Agree Realty Corp. | 77.77 | 2.9 | 3,298.5 | 42.9 | 124.2 |
| ADP | Automatic Data Processing, Inc. | 162.48 | 1.9 | 70,467.4 | 30.8 | 59.8 |
| AET | Aetna Inc. | 0.00 | 0.0 | 0.0 | ||
| AFG | American Financial Group, Inc. | 102.48 | 4.5 | 9,217.3 | 12.8 | 58.2 |
| AFSI | AmTrust Financial Services, Inc. | 0.00 | 0.0 | 0.0 | ||
| AGNC | AGNC Investment Corp. | 16.65 | 13.3 | 9,121.2 | -10.8 | -144.2 |
| AGR | Avangrid, Inc. | 49.96 | 3.5 | 15,335.9 | 27.1 | 96.0 |
| AHH | Armada Hoffler Properties, Inc. | 18.28 | 4.5 | 1,288.2 | 57.1 | 259.5 |
| AHT | Ashford Hospitality Trust, Inc. | 2.60 | 13.8 | 265.5 | -1.4 | -19.7 |
| AI | Arlington Asset Investment Corp. | 5.68 | 21.1 | 208.2 | -4.7 | -99.7 |
| AIMC | Altra Industrial Motion Corp. | 30.82 | 2.7 | 1,997.7 | 23.3 | 64.1 |
| AIN | Albany International Corp. | 81.58 | 0.9 | 2,504.5 | 24.1 | 21.3 |
| AKR | Acadia Realty Trust | 27.93 | 4.0 | 2,420.0 | 63.4 | 254.1 |
| AL | Air Lease Corp. | 44.75 | 1.2 | 4,997.5 | 8.8 | 10.3 |
| ALB | Albemarle Corp. | 63.74 | 2.3 | 6,755.5 | 12.4 | 27.9 |
| ALCO | Alico, Inc. | 31.82 | 0.8 | 237.9 | 10.8 | 8.2 |
| ALEX | Alexander & Baldwin, Inc. | 24.44 | 2.8 | 1,765.6 | -15.3 | -43.1 |
| ALG | Alamo Group, Inc. | 124.18 | 0.4 | 1,462.2 | 19.1 | 7.4 |
| ALL | The Allstate Corp. | 106.60 | 1.8 | 35,091.9 | 13.7 | 25.3 |
| ALOT | AstroNova, Inc. | 15.86 | 1.8 | 111.8 | 17.3 | 30.6 |
| AMH | American Homes 4 Rent | 26.35 | 0.8 | 7,917.5 | 109.6 | 83.2 |
| AMT | American Tower Corp. | 210.75 | 1.7 | 93,295.9 | 63.3 | 108.4 |
| ANDE | The Andersons, Inc. | 18.73 | 3.6 | 610.6 | 15.0 | 54.5 |
| ANH | Anworth Mortgage Asset Corp. | 3.41 | 13.8 | 336.8 | -3.5 | -48.6 |
| APH | Amphenol Corp. | 101.19 | 0.9 | 30,098.8 | 25.7 | 23.8 |
| APLE | Apple Hospitality REIT, Inc. | 16.38 | 7.9 | 3,667.0 | 18.9 | 149.9 |
| APTS | Preferred Apartment Communities, Inc. | 14.37 | 7.3 | 651.4 | -8.9 | -65.0 |
| AQN | Algonquin Power & Utilities Corp. | 13.39 | 9.3 | 6,977.7 | 19.4 | 180.1 |
| ARE | Alexandria Real Estate Equities, Inc. | 158.88 | 2.5 | 18,111.5 | 150.1 | 372.2 |
| ARI | Apollo Commercial Real Estate Finance, Inc. | 18.16 | 10.1 | 2,788.2 | 13.7 | 138.7 |
| ARKR | Ark Restaurants Corp. | 20.75 | 4.8 | 72.6 | 17.0 | 82.0 |
| ARR | ARMOUR Residential REIT, Inc. | 16.62 | 14.3 | 978.8 | -1.4 | -20.6 |
| ATNI | ATN International, Inc. | 61.82 | 1.1 | 989.4 | 12,121.6 | 13,333.3 |
| AUY | Yamana Gold, Inc. | 3.51 | 2.8 | 3,345.5 | 22.3 | 62.2 |
| AVAL | Grupo Aval Acciones y Valores SA | 7.99 | 6.1 | 2,842.9 | 8.7 | 52.7 |
| AVB | AvalonBay Communities, Inc. | 216.99 | 2.8 | 30,304.2 | 32.8 | 91.2 |
| AVD | American Vanguard Corp. | 13.89 | 0.6 | 419.5 | 19.5 | 11.2 |
| AXS | AXIS Capital Holdings Ltd. | 61.62 | 2.6 | 5,172.8 | 47.4 | 123.1 |
| BANC | Banc of California, Inc. | 13.87 | 2.7 | 708.3 | -375.9 | -1,026.1 |
| BANF | BancFirst Corp. (Oklahoma) | 58.51 | 2.1 | 1,910.0 | 14.5 | 30.2 |
| BANR | Banner Corp. | 56.42 | 2.9 | 1,930.3 | 13.0 | 37.1 |
| BANX | StoneCastle Financial Corp. | 22.05 | 6.7 | 148.1 | 15.2 | 102.3 |
| BAX | Baxter International, Inc. | 77.85 | 1.1 | 39,746.8 | 25.7 | 27.1 |
| BBBY | Bed Bath & Beyond, Inc. | 14.78 | 5.6 | 1,870.6 | -2.6 | -14.4 |
| BBD | Banco Bradesco SA | 9.15 | 6.1 | 36,784.4 | 13.5 | 82.2 |
| BBDO | Banco Bradesco SA | 8.44 | 14.1 | 34,284.0 | 12.5 | 176.4 |
| BBGI | Beasley Broadcast Group, Inc. | 2.90 | 6.9 | 80.8 | 7.7 | 53.3 |
| BCE | BCE, Inc. | 47.02 | 11.6 | 42,448.5 | 19.1 | 222.4 |
| BCPC | Balchem Corp. | 101.80 | 0.5 | 3,293.9 | 41.9 | 19.4 |
| BDC | Belden, Inc. | 56.33 | 0.4 | 2,560.3 | 13.9 | 4.9 |
| BDGE | Bridge Bancorp, Inc. | 32.52 | 3.5 | 645.3 | 12.6 | 44.7 |
| BDN | Brandywine Realty Trust | 14.94 | 5.1 | 2,626.6 | 19.2 | 97.8 |
| BEN | Franklin Resources, Inc. | 28.41 | 3.7 | 14,309.2 | 12.0 | 44.1 |
| BFS | Saul Centers, Inc. | 55.13 | 3.8 | 1,268.0 | 31.2 | 119.8 |
| BGG | Briggs & Stratton Corp. | 7.31 | 6.4 | 308.9 | -5.6 | -35.7 |
| BGS | B&G Foods, Inc. | 15.40 | 12.3 | 1,006.8 | 5.7 | 69.8 |
| BHR | Braemar Hotels & Resorts, Inc. | 9.32 | 6.9 | 306.7 | -10.4 | -71.4 |
| BKE | The Buckle, Inc. | 21.88 | 9.1 | 1,077.0 | 11.4 | 104.2 |
| BKS | Barnes & Noble, Inc. | 6.49 | 6.9 | 475.1 | 125.5 | 870.4 |
| BKSC | Bank of South Carolina Corp. | 18.60 | 3.9 | 102.9 | 14.4 | 56.6 |
| BKTI | BK Technologies Corp. | 3.46 | 1.7 | 44.0 | -19.6 | -34.0 |
| BKU | BankUnited, Inc. | 34.83 | 2.4 | 3,326.5 | 12.7 | 30.5 |
| BNS | The Bank of Nova Scotia | 57.48 | 6.1 | 70,249.1 | 11.4 | 69.0 |
| BOCH | Bank of Commerce Holdings | 11.00 | 1.6 | 200.3 | 12.4 | 20.3 |
| BOOM | DMC Global, Inc. | 45.20 | 0.4 | 671.8 | 12.3 | 5.0 |
| BPOP | Popular, Inc. | 55.31 | 2.1 | 5,367.7 | 8.9 | 18.4 |
| BPT | BP Prudhoe Bay Royalty Trust | 8.15 | 27.4 | 174.4 | 2.0 | 54.0 |
| BR | Broadridge Financial Solutions, Inc. | 124.75 | 1.6 | 14,278.0 | 30.0 | 47.9 |
| BRC | Brady Corp. | 57.99 | 1.5 | 3,073.4 | 23.2 | 34.3 |
| BRG | Bluerock Residential Growth REIT, Inc. | 11.85 | 5.5 | 282.4 | -5.9 | -32.1 |
| BRT | BRT Apartments Corp. | 16.85 | 4.9 | 267.9 | -15.8 | -76.8 |
| BRX | Brixmor Property Group, Inc. | 21.07 | 5.3 | 6,275.6 | 17.8 | 94.4 |
| BSMX | Banco Santander Mexico SA Institucion de Banca Multiple | 6.98 | 5.3 | 4,638.5 | 8.8 | 46.9 |
| BXMT | Blackstone Mortgage Trust, Inc. | 36.00 | 6.9 | 4,834.4 | 15.2 | 104.5 |
| BXP | Boston Properties, Inc. | 132.68 | 2.9 | 20,508.1 | 38.8 | 111.1 |
| BXS | BancorpSouth Bank | 30.86 | 2.9 | 3,184.0 | 14.4 | 40.9 |
| BYD | Boyd Gaming Corp. | 27.25 | 1.0 | 3,028.6 | 19.8 | 18.9 |
| CAC | Camden National Corp. (Maine) | 44.22 | 2.7 | 681.4 | 12.4 | 33.7 |
| CAH | Cardinal Health, Inc. | 50.28 | 3.8 | 14,702.1 | 11.1 | 42.3 |
| CAL | Caleres, Inc. | 22.45 | 1.2 | 917.7 | -68.1 | -84.6 |
| CARO | Carolina Financial Corp. | 37.31 | 1.2 | 830.1 | 13.4 | 15.5 |
| CASH | Meta Financial Group, Inc. | 32.53 | 0.6 | 1,232.2 | 13.1 | 8.0 |
| CATO | The Cato Corp. | 17.33 | 7.6 | 429.2 | 12.6 | 96.1 |
| CB | Chubb Ltd. | 148.24 | 2.0 | 67,560.2 | 18.0 | 36.0 |
| CBL | CBL & Associates Properties, Inc. | 1.55 | 9.7 | 310.4 | -1.5 | -14.7 |
| CBS | CBS Corp. | 35.85 | 2.0 | 13,431.8 | 4.4 | 8.8 |
| CBU | Community Bank System, Inc. | 68.57 | 2.3 | 3,543.4 | 21.2 | 47.9 |
| CCJ | Cameco Corp. | 9.02 | 0.9 | 3,609.7 | 31.9 | 28.0 |
| CCMP | Cabot Microelectronics Corp. | 160.62 | 1.0 | 4,606.6 | 40.5 | 42.3 |
| CCO | Clear Channel Outdoor Holdings, Inc. | 2.48 | 0.0 | 1,165.0 | -4.2 | 0.0 |
| CCU | Cia Cervecerias Unidas SA | 20.21 | 7.2 | 3,744.9 | 8.0 | 57.8 |
| CFFI | C&F Financial Corp. | 50.20 | 2.9 | 171.9 | 9.4 | 27.8 |
| CHCO | City Holding Co. | 79.47 | 2.7 | 1,303.1 | 16.8 | 45.6 |
| CHDN | Churchill Downs, Inc. | 133.78 | 1.2 | 5,355.2 | 29.0 | 35.3 |
| CHH | Choice Hotels International, Inc. | 87.62 | 1.0 | 4,880.2 | 22.7 | 22.3 |
| CHMG | Chemung Financial Corp. | 42.94 | 2.4 | 209.3 | 12.2 | 29.5 |
| CHMI | Cherry Hill Mortgage Investment Corp. | 13.43 | 15.0 | 230.6 | -3.4 | -51.7 |
| CHSP | Chesapeake Lodging Trust | 27.17 | 4.4 | 1,651.0 | 17.4 | 76.8 |
| CIB | Bancolombia SA | 51.64 | 2.4 | 6,598.1 | 11.8 | 27.7 |
| CIGI | Colliers International Group, Inc. | 65.92 | 0.1 | 2,841.0 | 27.5 | 3.8 |
| CIM | Chimera Investment Corp. | 20.29 | 9.9 | 3,797.4 | 22.2 | 218.5 |
| CINF | Cincinnati Financial Corp. | 110.73 | 2.0 | 18,090.4 | 19.7 | 39.3 |
| CIO | City Office REIT, Inc. | 13.41 | 7.0 | 731.5 | -33.9 | -238.0 |
| CLDT | Chatham Lodging Trust | 17.87 | 8.0 | 838.5 | 33.3 | 266.3 |
| CLI | Mack-Cali Realty Corp. | 22.02 | 3.6 | 1,994.0 | 8.2 | 29.9 |
| CLNY | Colony Capital, Inc. | 5.60 | 7.9 | 2,731.1 | -2.6 | -20.4 |
| CM | Canadian Imperial Bank of Commerce | 85.96 | 6.5 | 38,289.8 | 10.0 | 64.8 |
| CMA | Comerica, Inc. | 66.44 | 3.9 | 9,574.0 | 8.3 | 32.7 |
| CMC | Commercial Metals Co. | 19.26 | 3.1 | 2,278.5 | 11.5 | 35.6 |
| CMCSA | Comcast Corp. | 45.44 | 3.7 | 206,718.1 | 16.6 | 60.7 |
| CMCT | CIM Commercial Trust Corp. | 14.71 | 98.2 | 214.8 | 0.7 | 64.6 |
| CME | CME Group, Inc. | 200.66 | 2.3 | 71,855.3 | 39.0 | 91.4 |
| CMFN | CM Finance, Inc. | 7.03 | 14.2 | 95.7 | -16.6 | -236.4 |
| CMO | Capstead Mortgage Corp. | 7.81 | 5.1 | 738.9 | -8.5 | -43.3 |
| CNMD | CONMED Corp. | 98.98 | 0.8 | 2,811.5 | 98.9 | 79.6 |
| CNQ | Canadian Natural Resources Ltd. | 25.77 | 5.7 | 30,639.3 | 8.5 | 48.2 |
| CODI | Compass Diversified Holdings | 19.78 | 7.3 | 1,184.8 | -30.1 | -218.8 |
| COHU | Cohu, Inc. | 16.63 | 1.4 | 683.4 | -7.4 | -10.6 |
| CONE | CyrusOne, Inc. | 74.97 | 2.5 | 8,486.0 | -109.4 | -274.3 |
| COR | CoreSite Realty Corp. | 119.18 | 3.9 | 4,396.7 | 55.8 | 217.1 |
| CP | Canadian Pacific Railway Ltd. | 225.88 | 2.3 | 31,085.6 | 18.1 | 41.3 |
| CPB | Campbell Soup Co. | 46.56 | 3.0 | 14,023.3 | 52.5 | 157.8 |
| CPG | Crescent Point Energy Corp. | 3.94 | 3.0 | 2,166.9 | -1.3 | -4.0 |
| CPHC | Canterbury Park Holding Corp. | 12.30 | 2.3 | 56.8 | 11.1 | 25.3 |
| CPK | Chesapeake Utilities Corp. | 93.51 | 1.7 | 1,533.9 | 25.4 | 42.1 |
| CPT | Camden Property Trust | 113.27 | 2.8 | 10,967.6 | 68.9 | 192.9 |
| CRT | Cross Timbers Royalty Trust | 8.77 | 12.5 | 52.6 | 7.3 | 92.1 |
| CRWS | Crown Crafts, Inc. | 5.70 | 5.6 | 57.7 | 9.9 | 55.4 |
| CSB | VictoryShares US Small Cap High Div Volatility Wtd ETF | 45.92 | 0.0 | 0.0 | ||
| CSCO | Cisco Systems, Inc. | 47.17 | 2.9 | 200,181.5 | 17.9 | 52.5 |
| CSPI | CSP, Inc. | 13.12 | 4.6 | 54.5 | -39.9 | -182.6 |
| CSWC | Capital Southwest Corp. | 22.12 | 8.7 | 391.5 | 13.5 | 117.8 |
| CTBI | Community Trust Bancorp, Inc. (Kentucky) | 43.78 | 4.2 | 778.3 | 12.1 | 50.7 |
| CTRE | CareTrust REIT, Inc. | 23.50 | 3.7 | 2,245.6 | 31.3 | 117.2 |
| CUBE | CubeSmart | 32.25 | 4.0 | 6,242.1 | 34.8 | 138.2 |
| CUZ | Cousins Properties, Inc. | 39.08 | 1.8 | 5,735.5 | 112.2 | 206.1 |
| CVA | Covanta Holding Corp. | 14.08 | 7.1 | 1,844.5 | 260.7 | 1,851.9 |
| CVBF | CVB Financial Corp. | 21.17 | 3.2 | 2,967.1 | 14.8 | 47.6 |
| CVG | Convergys Corporation | 0.00 | 0.0 | 0.0 | ||
| CWCO | Consolidated Water Co. Ltd. | 16.77 | 2.0 | 252.0 | 20.9 | 42.3 |
| CXP | Columbia Property Trust, Inc. | 20.16 | 4.0 | 2,356.7 | -368.6 | -1,462.5 |
| CXW | CoreCivic, Inc. | 15.60 | 11.2 | 1,857.9 | 10.3 | 115.4 |
| CY | Cypress Semiconductor Corp. | 23.25 | 1.9 | 8,586.6 | 29.3 | 55.5 |
| DCT | DCT Industrial Trust Inc. | 0.00 | 0.0 | 0.0 | ||
| DDR | DDR Corp. | 0.00 | 0.0 | 0.0 | ||
| DEI | Douglas Emmett, Inc. | 42.79 | 2.4 | 8,701.3 | 61.7 | 150.1 |
| DG | Dollar General Corp. | 162.64 | 0.8 | 41,809.5 | 26.0 | 20.0 |
| DGX | Quest Diagnostics, Inc. | 100.39 | 2.1 | 13,522.2 | 18.6 | 39.2 |
| DHR | Danaher Corp. | 136.21 | 0.5 | 97,837.1 | 39.9 | 19.6 |
| DIN | Dine Brands Global, Inc. | 71.68 | 4.7 | 1,231.1 | 12.4 | 58.8 |
| DIS | The Walt Disney Co. | 130.53 | 0.7 | 235,134.1 | 16.4 | 11.0 |
| DIT | AMCON Distributing Co. | 74.10 | 1.6 | 43.9 | 10.2 | 16.2 |
| DL | China Distance Education Holdings Ltd. | 6.50 | 0.0 | 220.1 | 12.7 | 0.0 |
| DLR | Digital Realty Trust, Inc. | 132.28 | 3.2 | 27,559.6 | 121.2 | 389.4 |
| DOC | Physicians Realty Trust | 18.08 | 5.1 | 3,350.5 | 65.2 | 332.0 |
| DOX | Amdocs Ltd. | 65.26 | 1.7 | 8,842.3 | 22.5 | 38.2 |
| DRH | DiamondRock Hospitality Co. | 10.05 | 5.0 | 2,012.0 | 22.2 | 110.4 |
| DTE | DTE Energy Co. | 125.68 | 6.2 | 23,775.6 | 21.0 | 130.9 |
| DVCR | Diversicare Healthcare Services, Inc. | 2.75 | 2.0 | 18.4 | -0.5 | -1.0 |
| DX | Dynex Capital, Inc. | 15.26 | 8.5 | 376.2 | -1.5 | -12.6 |
| DXC | DXC Technology Co. | 28.09 | 3.6 | 7,358.5 | 6.6 | 23.8 |
| DXR | Daxor Corp. | 9.16 | 0.0 | 34.3 | 173.8 | 0.0 |
| EARN | Ellington Residential Mortgage REIT | 10.84 | 11.4 | 135.1 | -669.1 | -7,654.3 |
| EBSB | Meridian Bancorp, Inc. | 19.44 | 1.4 | 1,036.1 | 16.0 | 23.0 |
| ECC | Eagle Point Credit Co., Inc. | 15.53 | 18.0 | 377.6 | -14.1 | -254.3 |
| ECL | Ecolab, Inc. | 191.59 | 1.0 | 55,130.4 | 36.9 | 35.5 |
| ECOL | US Ecology, Inc. | 65.42 | 1.1 | 1,444.5 | 28.4 | 31.2 |
| EHC | Encompass Health Corp. | 67.35 | 2.0 | 6,657.6 | 20.7 | 42.1 |
| EIX | Edison International | 64.56 | 3.8 | 23,118.3 | -84.8 | -321.8 |
| ELS | Equity LifeStyle Properties, Inc. | 68.87 | 3.5 | 12,539.0 | ||
| EME | EMCOR Group, Inc. | 88.49 | 0.4 | 5,037.0 | 16.1 | 5.7 |
| EMN | Eastman Chemical Co. | 78.15 | 3.2 | 10,706.1 | ||
| ENSG | The Ensign Group, Inc. | 41.76 | 0.5 | 2,229.4 | 21.4 | 9.7 |
| EOG | EOG Resources, Inc. | 71.05 | 1.4 | 41,234.4 | 11.5 | 16.4 |
| EPR | EPR Properties | 78.29 | 6.2 | 6,071.9 | 23.1 | 142.7 |
| EQR | Equity Residential | 87.45 | 2.6 | 32,472.5 | 40.2 | 103.2 |
| ERF | Enerplus Corp. | 6.16 | 2.1 | 1,420.7 | 4.4 | 9.4 |
| ERIE | Erie Indemnity Co. | 184.26 | 2.0 | 8,511.3 | 26.9 | 52.5 |
| ESE | ESCO Technologies, Inc. | 82.70 | 0.4 | 2,148.6 | 25.3 | 9.8 |
| ESS | Essex Property Trust, Inc. | 323.39 | 2.4 | 21,370.3 | 52.0 | 124.0 |
| ETH | Ethan Allen Interiors, Inc. | 19.38 | 9.2 | 515.3 | 20.1 | 184.7 |
| EVRG | Evergy, Inc. | 63.09 | 3.0 | 14,855.6 | 26.7 | 80.5 |
| EXP | Eagle Materials, Inc. | 95.83 | 0.4 | 3,945.5 | 105.7 | 45.0 |
| FBNC | First Bancorp (North Carolina) | 37.92 | 1.2 | 1,122.6 | ||
| FCNCA | First Citizens BancShares, Inc. (North Carolina) | 497.03 | 0.3 | 5,546.9 | 13.2 | 4.2 |
| FCPT | Four Corners Property Trust, Inc. | 28.32 | 4.1 | 1,937.6 | 25.7 | 104.4 |
| FDX | FedEx Corp. | 158.40 | 1.6 | 41,328.1 | 92.8 | 152.3 |
| FFBC | First Financial Bancorp (Ohio) | 23.87 | 4.6 | 2,415.0 | 11.4 | 52.7 |
| FFIN | First Financial Bankshares, Inc. | 34.76 | 1.9 | 4,757.8 | 29.1 | 54.9 |
| FHN | First Horizon National Corp. (Tennessee) | 16.23 | 3.3 | 5,056.7 | 12.4 | 41.1 |
| FISI | Financial Institutions, Inc. | 30.74 | 3.2 | 491.7 | 12.4 | 39.9 |
| FITB | Fifth Third Bancorp | 29.44 | 3.1 | 21,155.1 | 9.5 | 29.5 |
| FLIC | The First of Long Island Corp. | 23.67 | 2.9 | 584.0 | 14.3 | 41.8 |
| FLR | Fluor Corp. | 19.63 | 4.2 | 2,780.3 | -5.7 | -23.9 |
| FLS | Flowserve Corp. | 49.22 | 1.5 | 6,456.2 | 31.2 | 48.1 |
| FLXS | Flexsteel Industries, Inc. | 15.01 | 5.9 | 118.9 | -4.9 | -28.5 |
| FMBI | First Midwest Bancorp, Inc. (Illinois) | 20.65 | 2.5 | 2,294.0 | 11.9 | 29.6 |
| FMC | FMC Corp. | 84.03 | 1.9 | 10,960.3 | 21.6 | 41.1 |
| FNLC | The First Bancorp, Inc. (Maine) | 28.14 | 4.2 | 306.6 | 12.1 | 50.7 |
| FPI | Farmland Partners, Inc. | 6.64 | 3.0 | 196.6 | 46.6 | 140.3 |
| FR | First Industrial Realty Trust, Inc. | 41.70 | 2.2 | 5,274.5 | 27.4 | 59.6 |
| FRT | Federal Realty Investment Trust | 138.68 | 3.0 | 10,481.6 | 42.0 | 124.5 |
| FSV | FirstService Corp. | 88.61 | 0.3 | 3,082.3 | -13.4 | -4.5 |
| FULT | Fulton Financial Corp. | 17.14 | 3.2 | 2,816.5 | 12.3 | 39.3 |
| GBL | GAMCO Investors, Inc. | 15.98 | 0.5 | 442.6 | 4.4 | 2.2 |
| GE | General Electric Co. | 9.07 | 0.4 | 79,154.5 | -3.7 | -1.6 |
| GEF | Greif, Inc. | 40.23 | 4.3 | 1,959.1 | 16.3 | 70.5 |
| GES | Guess?, Inc. | 17.43 | 3.9 | 1,143.6 | 85.8 | 332.2 |
| GGP | 0.00 | 0.0 | 0.0 | |||
| GLNG | Golar LNG Ltd. | 15.00 | 2.9 | 1,558.0 | -3.8 | -11.0 |
| GNL | Global Net Lease, Inc. | 19.41 | 11.0 | 1,639.9 | 159.5 | 1,750.2 |
| GNTX | Gentex Corp. | 28.10 | 1.6 | 7,133.7 | 16.8 | 27.3 |
| GOOD | Gladstone Commercial Corp. | 22.59 | 7.7 | 719.8 | 424.6 | 3,289.5 |
| GORO | Gold Resource Corp. | 3.96 | 0.6 | 259.7 | 89.2 | 52.5 |
| GPC | Genuine Parts Co. | 103.66 | 2.9 | 15,061.1 | 18.9 | 55.0 |
| GPK | Graphic Packaging Holding Co. | 15.62 | 1.9 | 4,565.6 | 21.0 | 40.0 |
| GPMT | Granite Point Mortgage Trust, Inc. | 18.61 | 9.0 | 1,020.8 | 12.8 | 116.0 |
| GPS | Gap, Inc. | 17.20 | 5.6 | 6,463.6 | 7.0 | 39.4 |
| GPT | Gramercy Property Trust | 0.00 | 0.0 | 0.0 | ||
| GROW | U.S. Global Investors, Inc. | 2.05 | 1.7 | 31.0 | -9.2 | -15.6 |
| GSBC | Great Southern Bancorp, Inc. (Missouri) | 60.50 | 3.4 | 859.8 | 11.7 | 39.8 |
| GSK | GlaxoSmithKline Plc | 44.19 | 4.6 | 109,861.6 | 19.0 | 86.6 |
| GTY | Getty Realty Corp. | 33.14 | 5.3 | 1,365.4 | 28.1 | 150.0 |
| GVA | Granite Construction, Inc. | 23.55 | 2.0 | 1,202.6 | -10.5 | -21.1 |
| GWRS | Global Water Resources, Inc. | 12.15 | 2.4 | 261.7 | 132.8 | 312.7 |
| GZT | Gazit-Globe Ltd. | 8.05 | 5.2 | 1,515.0 | 33.8 | 176.6 |
| HASI | Hannon Armstrong Sustainable Infrastructure Capital, Inc. | 29.36 | 4.5 | 1,928.6 | 33.5 | 152.4 |
| HBAN | Huntington Bancshares, Inc. | 14.58 | 4.9 | 15,057.6 | 11.3 | 55.7 |
| HBNC | Horizon Bancorp, Inc. (Indiana) | 18.29 | 2.4 | 822.5 | 12.6 | 30.4 |
| HCAP | Harvest Capital Credit Corp. | 9.85 | 10.2 | 59.8 | 27.0 | 275.8 |
| HCFT | Hunt Companies Finance Trust, Inc. | 3.33 | 8.4 | 78.9 | 35.6 | 299.1 |
| HCKT | The Hackett Group, Inc. | 16.76 | 2.1 | 500.4 | 26.0 | 54.4 |
| HECO | Strategy Shares EcoLogical Strategy ETF | 40.45 | 0.0 | 0.0 | ||
| HEI | HEICO Corp. | 120.51 | 0.1 | 16,166.8 | 51.9 | 6.0 |
| HFBC | HopFed Bancorp, Inc. | 19.53 | 1.5 | 129.9 | 23.5 | 36.1 |
| HGT | Hugoton Royalty Trust | 0.00 | 0.0 | 0.0 | ||
| HIFR | InfraREIT, Inc. | 21.11 | 3.6 | 928.9 | 14.9 | 53.1 |
| HIFS | Hingham Institution for Savings | 189.15 | 1.1 | 402.7 | 12.5 | 13.5 |
| HIG | The Hartford Financial Services Group, Inc. | 56.46 | 2.7 | 20,414.9 | 12.5 | 33.1 |
| HPE | Hewlett-Packard Enterprise Co. | 16.43 | 3.5 | 21,451.0 | -158.4 | -549.7 |
| HPQ | HP, Inc. | 17.63 | 3.6 | 26,126.1 | 6.4 | 23.4 |
| HRB | H&R Block, Inc. | 24.93 | 4.1 | 5,003.9 | 11.8 | 48.3 |
| HST | Host Hotels & Resorts, Inc. | 16.70 | 5.1 | 12,189.4 | 11.3 | 57.3 |
| HT | Hersha Hospitality Trust | 14.08 | 8.0 | 552.9 | -26.2 | -208.6 |
| HTA | Healthcare Trust of America, Inc. | 30.35 | 4.1 | 12,572.5 | 170.7 | 700.2 |
| HUM | Humana, Inc. | 289.37 | 0.9 | 39,090.7 | 15.7 | 14.7 |
| HURC | Hurco Cos., Inc. | 34.05 | 1.4 | 230.4 | 9.8 | 13.5 |
| HWBK | Hawthorn Bancshares, Inc. | 23.62 | 1.9 | 148.2 | 10.7 | 19.9 |
| IBKC | IBERIABANK Corp. | 74.59 | 2.3 | 3,951.8 | 9.6 | 21.9 |
| IDCC | InterDigital, Inc. | 56.12 | 2.5 | 1,749.4 | 67.5 | 168.2 |
| IEX | IDEX Corp. | 159.36 | 1.2 | 12,087.0 | 28.3 | 34.2 |
| IFF | International Flavors & Fragrances, Inc. | 120.19 | 2.4 | 12,833.3 | 34.8 | 85.2 |
| IHC | Independence Holding Co. | 38.79 | 0.9 | 576.0 | 19.0 | 17.2 |
| IHT | InnSuites Hospitality Trust | 1.58 | 1.3 | 14.7 | -1.3 | -1.6 |
| IIIN | Insteel Industries, Inc. | 19.79 | 0.6 | 381.2 | 68.0 | 41.2 |
| IMKTA | Ingles Markets, Inc. | 39.92 | 1.7 | 565.9 | 9.9 | 16.4 |
| IMO | Imperial Oil Ltd. | 25.06 | 5.7 | 19,351.6 | 8.4 | 47.3 |
| INBK | First Internet Bancorp | 22.89 | 1.0 | 228.0 | 10.7 | 11.2 |
| INDB | Independent Bank Corp. (Massachusetts) | 82.99 | 2.0 | 2,852.1 | 17.5 | 35.9 |
| INGR | Ingredion, Inc. | 80.67 | 3.1 | 5,373.7 | 14.0 | 43.5 |
| INT | World Fuel Services Corp. | 40.35 | 0.8 | 2,608.7 | 19.0 | 15.3 |
| INTU | Intuit, Inc. | 258.61 | 0.8 | 67,257.7 | 43.2 | 32.4 |
| IPAR | Inter Parfums, Inc. | 75.06 | 1.5 | 2,360.7 | 40.5 | 59.3 |
| IRET | Investors Real Estate Trust | 75.93 | 3.7 | 975.6 | ||
| IRM | Iron Mountain, Inc. | 33.66 | 7.3 | 9,664.0 | 33.0 | 239.8 |
| IRT | Independence Realty Trust, Inc. | 15.11 | 4.8 | 1,372.4 | 37.1 | 177.2 |
| ISTR | Investar Holding Corp. | 24.29 | 0.9 | 241.2 | 14.3 | 12.8 |
| ITRN | Ituran Location & Control Ltd. | 24.70 | 3.8 | 518.1 | 9.2 | 34.9 |
| ITUB | Itaú Unibanco Holding SA | 9.19 | 8.1 | 44,356.7 | 13.2 | 106.8 |
| ITW | Illinois Tool Works, Inc. | 169.94 | 2.4 | 54,971.9 | 22.3 | 53.3 |
| IVC | Invacare Corp. | 7.14 | 0.7 | 241.8 | -6.0 | -4.2 |
| IVR | Invesco Mortgage Capital, Inc. | 15.60 | 11.3 | 2,227.7 | -15.4 | -175.2 |
| JCAP | Jernigan Capital, Inc. | 18.98 | 7.4 | 422.1 | 8.4 | 62.2 |
| JCI | Johnson Controls International Plc | 42.67 | 2.4 | 33,952.8 | 67.5 | 164.6 |
| JCS | Communications Systems, Inc. | 4.56 | 1.8 | 42.5 | 62.0 | 108.8 |
| JJSF | J&J Snack Foods Corp. | 190.62 | 1.0 | 3,591.5 | 38.9 | 40.8 |
| JMP | JMP Group LLC | 3.35 | 6.6 | 64.7 | -95.4 | -626.8 |
| JOUT | Johnson Outdoors, Inc. | 59.89 | 1.0 | 598.6 | 13.9 | 13.8 |
| JPM | JPMorgan Chase & Co. | 126.51 | 2.6 | 404,514.5 | 12.4 | 32.5 |
| KAMN | Kaman Corp. | 58.88 | 1.4 | 1,642.9 | 31.3 | 42.5 |
| KAR | KAR Auction Services, Inc. | 26.16 | 4.7 | 3,489.0 | 12.6 | 59.6 |
| KBAL | Kimball International, Inc. | 20.60 | 2.0 | 760.9 | 19.3 | 39.3 |
| KBR | KBR, Inc. | 26.01 | 1.5 | 3,684.7 | 19.4 | 29.8 |
| KDP | Keurig Dr Pepper, Inc. | 27.59 | 2.2 | 38,896.6 | 40.2 | 87.2 |
| KIM | Kimco Realty Corp. | 20.96 | 6.7 | 8,849.9 | 27.9 | 186.6 |
| KMB | Kimberly-Clark Corp. | 131.88 | 3.1 | 45,209.3 | 22.5 | 69.7 |
| KMG | KMG Chemicals, Inc. | 0.00 | 0.0 | 0.0 | ||
| KRC | Kilroy Realty Corp. | 82.08 | 2.3 | 8,287.1 | 29.6 | 67.8 |
| KRG | Kite Realty Group Trust | 17.51 | 7.3 | 1,470.5 | -62.8 | -455.4 |
| KS | KapStone Paper and Packaging Corporation | 0.00 | 0.0 | 0.0 | ||
| KSU | Kansas City Southern | 143.65 | 1.0 | 14,238.6 | 25.1 | 25.2 |
| KW | Kennedy-Wilson Holdings, Inc. | 22.69 | 3.7 | 3,217.0 | 36.2 | 134.9 |
| KWR | Quaker Chemical Corp. | 155.48 | 1.0 | 2,746.9 | 36.4 | 35.4 |
| LADR | Ladder Capital Corp. | 17.18 | 9.3 | 2,057.0 | 11.9 | 110.0 |
| LAMR | Lamar Advertising Co. | 81.25 | 4.7 | 8,135.5 | 22.5 | 105.6 |
| LAND | Gladstone Land Corp. | 11.96 | 5.2 | 248.9 | ||
| LECO | Lincoln Electric Holdings, Inc. | 91.89 | 2.6 | 5,676.9 | 18.5 | 47.8 |
| LEG | Leggett & Platt, Inc. | 46.16 | 3.4 | 6,068.7 | 20.7 | 70.0 |
| LHO | LaSalle Hotel Properties | 0.00 | 0.0 | 0.0 | ||
| LII | Lennox International, Inc. | 245.10 | 1.1 | 9,513.2 | 26.8 | 30.6 |
| LM | Legg Mason, Inc. | 36.51 | 4.0 | 3,178.4 | -55.3 | -223.5 |
| LMNR | Limoneira Co. | 19.41 | 1.5 | 345.0 | -50.8 | -78.5 |
| LOAN | Manhattan Bridge Capital, Inc. | 6.18 | 9.7 | 59.7 | 13.4 | 130.5 |
| LPT | Liberty Property Trust | 57.50 | 2.8 | 9,063.5 | 20.1 | 56.9 |
| LRCX | Lam Research Corp. | 281.25 | 1.6 | 40,745.0 | 19.9 | 31.4 |
| LSI | Life Storage, Inc. | 103.67 | 3.9 | 4,836.2 | 23.1 | 89.3 |
| LSTR | Landstar System, Inc. | 117.96 | 0.7 | 4,674.7 | 19.2 | 14.1 |
| LTC | LTC Properties, Inc. | 51.16 | 5.2 | 2,033.7 | 19.1 | 99.1 |
| LUV | Southwest Airlines Co. | 57.64 | 1.2 | 30,982.5 | 12.9 | 15.2 |
| LXP | Lexington Realty Trust | 10.70 | 4.5 | 2,651.1 | 8.8 | 39.8 |
| M | Macy's, Inc. | 15.45 | 19.5 | 4,772.7 | 4.7 | 91.0 |
| MAA | Mid-America Apartment Communities, Inc. | 134.95 | 2.8 | 15,390.2 | 65.1 | 185.3 |
| MAIN | Main Street Capital Corp. | 43.10 | 7.8 | 2,721.1 | 16.8 | 131.7 |
| MANU | Manchester United Plc | 17.08 | 1.1 | 695.0 | 114.5 | 120.3 |
| MCK | McKesson Corp. | 145.48 | 1.4 | 26,899.8 | 48.2 | 65.9 |
| MDLZ | Mondelez International, Inc. | 52.41 | 2.0 | 75,583.1 | 20.6 | 41.8 |
| MDT | Medtronic Plc | 106.22 | 2.0 | 142,512.2 | 32.2 | 63.1 |
| MDU | MDU Resources Group, Inc. | 28.01 | 2.2 | 5,575.6 | 19.1 | 41.3 |
| MEI | Methode Electronics, Inc. | 34.04 | 1.3 | 1,262.6 | 13.3 | 17.1 |
| MELI | MercadoLibre, Inc. | 540.03 | 0.0 | 26,844.9 | 1,747.1 | 0.0 |
| MERC | Mercer International, Inc. | 12.33 | 4.3 | 804.6 | 5.4 | 23.3 |
| MFA | MFA Financial, Inc. | 7.53 | 10.6 | 3,392.7 | 10.7 | 113.4 |
| MFNC | Mackinac Financial Corp. | 15.80 | 3.2 | 169.7 | 12.8 | 40.4 |
| MGP | MGM Growth Properties LLC | 30.88 | 6.0 | 2,865.6 | 30.5 | 182.4 |
| MGRC | McGrath RentCorp | 69.99 | 2.1 | 1,697.5 | 19.4 | 40.7 |
| MHLD | Maiden Holdings Ltd. | 0.60 | 8.3 | 49.8 | -0.1 | -0.9 |
| MITT | AG Mortgage Investment Trust, Inc. | 15.10 | 12.9 | 494.3 | 26.5 | 342.5 |
| MKC | McCormick & Co., Inc. | 160.22 | 1.4 | 21,295.2 | 30.1 | 42.9 |
| MLHR | Herman Miller, Inc. | 46.21 | 1.7 | 2,716.1 | 15.8 | 27.5 |
| MO | Altria Group, Inc. | 45.99 | 7.0 | 85,913.9 | 13.6 | 96.1 |
| MORN | Morningstar, Inc. | 149.70 | 0.7 | 6,401.6 | 38.3 | 28.7 |
| MPB | Mid Penn Bancorp, Inc. | 25.80 | 3.6 | 218.7 | 12.2 | 44.5 |
| MPW | Medical Properties Trust, Inc. | 20.41 | 4.9 | 9,108.8 | 7.8 | 38.5 |
| MPWR | Monolithic Power Systems, Inc. | 154.53 | 1.0 | 6,684.6 | 63.7 | 62.1 |
| MRK | Merck & Co., Inc. | 82.20 | 2.7 | 210,463.2 | 22.8 | 61.2 |
| MRVL | Marvell Technology Group Ltd. | 25.23 | 1.0 | 16,775.1 | -39.5 | -37.7 |
| MSI | Motorola Solutions, Inc. | 162.82 | 1.4 | 27,118.6 | 25.9 | 36.3 |
| MSL | MidSouth Bancorp, Inc. (Louisiana) | 11.44 | 0.3 | 191.4 | -4.9 | -1.3 |
| MSM | MSC Industrial Direct Co., Inc. | 74.84 | 4.5 | 4,134.0 | 14.3 | 64.9 |
| MTGE | MTGE Investment Corp. | 0.00 | 0.0 | 0.0 | ||
| MTN | Vail Resorts, Inc. | 237.14 | 2.9 | 9,559.9 | 31.7 | 90.3 |
| MTR | Mesa Royalty Trust | 7.87 | 14.2 | 14.7 | 6.5 | 92.5 |
| MTSC | MTS Systems Corp. | 57.40 | 2.1 | 1,109.8 | 22.5 | 47.1 |
| MVC | MVC Capital, Inc. | 8.82 | 7.0 | 156.3 | 14.0 | 98.3 |
| MVO | MV Oil Trust | 6.80 | 15.4 | 78.2 | 5.0 | 76.9 |
| MYE | Myers Industries, Inc. | 16.96 | 3.2 | 602.0 | -108.4 | -345.3 |
| NATH | Nathan's Famous, Inc. | 73.70 | 1.6 | 311.5 | 14.0 | 22.8 |
| NBR | Nabors Industries Ltd. | 1.68 | 5.3 | 621.5 | -0.9 | -4.9 |
| NDRO | Enduro Royalty Trust | 0.00 | 0.0 | 0.0 | ||
| NDSN | Nordson Corp. | 156.02 | 0.9 | 8,969.6 | 28.0 | 25.6 |
| NEU | NewMarket Corp. | 476.13 | 1.9 | 5,327.4 | 20.0 | 37.9 |
| NFG | National Fuel Gas Co. | 45.51 | 3.8 | 3,928.2 | 13.3 | 50.2 |
| NGG | National Grid Plc | 57.65 | 5.4 | 40,130.7 | 19.9 | 106.4 |
| NGHC | National General Holdings Corp. | 22.25 | 0.8 | 2,513.4 | 10.8 | 8.2 |
| NHI | National Health Investors, Inc. | 84.19 | 4.9 | 3,650.6 | 23.4 | 115.1 |
| NJR | New Jersey Resources Corp. | 43.76 | 2.7 | 3,937.5 | 28.7 | 78.1 |
| NKE | NIKE, Inc. | 90.85 | 1.0 | 141,819.6 | 33.1 | 32.1 |
| NLY | Annaly Capital Management, Inc. | 8.89 | 12.4 | 12,946.2 | -2.7 | -33.1 |
| NOA | North American Construction Group Ltd. | 10.95 | 0.9 | 299.7 | 14.6 | 13.3 |
| NRC | National Research Corp. | 57.09 | 2.2 | 1,414.1 | 46.6 | 103.3 |
| NRZ | New Residential Investment Corp. | 15.68 | 12.8 | 6,515.4 | 18.7 | 238.2 |
| NSU | Nevsun Resources Ltd. | 4.44 | 0.0 | 1,375.3 | -19.3 | 0.0 |
| NTAP | NetApp, Inc. | 55.86 | 3.2 | 13,289.8 | 14.0 | 44.3 |
| NTP | Nam Tai Property, Inc. | 9.16 | 0.8 | 349.8 | -23.2 | -17.8 |
| NTRS | Northern Trust Corp. | 102.53 | 3.1 | 21,724.3 | 15.2 | 46.6 |
| NYMT | New York Mortgage Trust, Inc. | 6.20 | 12.9 | 1,628.3 | 11.5 | 148.8 |
| NYRT | New York REIT, Inc. | 0.00 | 0.0 | 0.0 | ||
| NYT | The New York Times Co. | 31.57 | 0.6 | 5,239.3 | 38.5 | 23.2 |
| O | Realty Income Corp. | 80.88 | 3.6 | 25,738.3 | 61.7 | 223.2 |
| OC | Owens Corning | 62.63 | 1.4 | 6,854.7 | 13.6 | 19.0 |
| OFC | Corporate Office Properties Trust, Inc. | 29.87 | 3.7 | 3,343.9 | 20.1 | 73.9 |
| OFG | OFG Bancorp | 21.44 | 1.6 | 1,100.9 | 14.9 | 24.3 |
| OGE | OGE Energy Corp. | 42.74 | 3.5 | 8,555.5 | 21.0 | 72.8 |
| OHAI | OHA Investment Corp. | 1.32 | 6.1 | 26.6 | -2.4 | -14.6 |
| OLP | One Liberty Properties, Inc. | 28.01 | 6.4 | 556.9 | 30.7 | 197.4 |
| OMC | Omnicom Group, Inc. | 77.00 | 3.3 | 16,765.4 | 12.9 | 42.7 |
| ORC | Orchid Island Capital, Inc. | 5.61 | 18.5 | 353.8 | -15.4 | -285.4 |
| ORCL | Oracle Corp. | 54.64 | 1.7 | 179,356.9 | 17.3 | 28.8 |
| ORI | Old Republic International Corp. | 22.24 | 8.1 | 6,743.2 | 9.9 | 79.6 |
| ORM | Owens Realty Mortgage, Inc. | 21.75 | 3.5 | 184.5 | 27.6 | 96.5 |
| OXY | Occidental Petroleum Corp. | 42.28 | 7.4 | 37,818.6 | 8.4 | 61.8 |
| OZK | Bank OZK | 29.00 | 3.2 | 3,729.4 | 8.5 | 27.5 |
| PB | Prosperity Bancshares, Inc. | 73.28 | 2.9 | 5,012.1 | 15.5 | 44.3 |
| PBA | Pembina Pipeline Corp. | 35.45 | 6.6 | 18,132.7 | 15.4 | 101.8 |
| PBT | Permian Basin Royalty Trust | 4.05 | 12.3 | 188.8 | 8.2 | 100.8 |
| PCAR | PACCAR, Inc. | 77.51 | 4.6 | 26,795.2 | 11.1 | 50.8 |
| PDCO | Patterson Cos., Inc. | 17.18 | 6.1 | 1,641.6 | 13.6 | 82.4 |
| PDM | Piedmont Office Realty Trust, Inc. | 21.07 | 4.0 | 2,650.2 | 22.2 | 88.4 |
| PEB | Pebblebrook Hotel Trust | 26.04 | 5.8 | 3,401.7 | -42.7 | -249.3 |
| PEGA | Pegasystems, Inc. | 75.36 | 0.2 | 5,956.3 | -113.8 | -18.1 |
| PEGI | Pattern Energy Group, Inc. | 27.25 | 6.2 | 2,683.9 | -42.5 | -263.5 |
| PEP | PepsiCo, Inc. | 136.57 | 2.8 | 190,437.3 | 15.5 | 42.7 |
| PF | Pinnacle Foods Inc. | 0.00 | 0.0 | 0.0 | ||
| PFBC | Preferred Bank (California) | 53.00 | 2.3 | 812.2 | 10.5 | 23.7 |
| PFLT | PennantPark Floating Rate Capital Ltd. | 11.51 | 9.9 | 446.3 | 29.6 | 293.6 |
| PGRE | Paramount Group, Inc. | 13.26 | 3.0 | 3,104.3 | 64.8 | 195.5 |
| PHM | PulteGroup, Inc. | 39.47 | 1.1 | 10,696.4 | 12.0 | 13.4 |
| PIR | Pier 1 Imports, Inc. | 6.32 | 0.0 | 27.0 | -0.1 | 0.0 |
| PK | Park Hotels & Resorts, Inc. | 23.83 | 9.9 | 5,719.2 | 17.0 | 167.2 |
| PKBK | Parke Bancorp, Inc. | 24.22 | 2.5 | 260.9 | 8.9 | 22.0 |
| PKG | Packaging Corporation of America | 112.51 | 2.8 | 10,650.5 | 13.9 | 39.1 |
| PLCE | The Children's Place, Inc. | 80.59 | 2.7 | 1,266.4 | 19.3 | 51.8 |
| PLPC | Preformed Line Products Co. | 54.03 | 1.5 | 271.8 | 11.3 | 16.7 |
| PM | Philip Morris International, Inc. | 82.09 | 5.6 | 127,722.2 | 17.1 | 95.6 |
| PMT | PennyMac Mortgage Investment Trust | 22.58 | 8.3 | 1,982.7 | 9.0 | 74.7 |
| POL | PolyOne Corp. | 32.15 | 3.1 | 2,472.8 | 18.5 | 56.4 |
| POR | Portland General Electric Co. | 56.07 | 2.7 | 5,011.1 | 25.1 | 66.9 |
| PPL | PPL Corp. | 32.94 | 5.0 | 23,790.8 | 13.4 | 66.8 |
| PRA | ProAssurance Corp. | 39.53 | 4.4 | 2,127.3 | 42.5 | 186.8 |
| PRIM | Primoris Services Corp. | 21.02 | 1.1 | 1,077.2 | 12.7 | 14.4 |
| QADA | QAD, Inc. | 44.91 | 0.6 | 913.7 | -58.7 | -37.7 |
| QCRH | QCR Holdings, Inc. | 41.26 | 0.6 | 651.5 | 11.8 | 6.9 |
| QSR | Restaurant Brands International, Inc. | 65.76 | 6.0 | 32,157.3 | ||
| QTS | QTS Realty Trust, Inc. | 53.19 | 3.3 | 2,948.3 | -617.1 | -2,007.0 |
| RAVN | Raven Industries, Inc. | 34.42 | 1.5 | 1,231.9 | 32.7 | 49.6 |
| RBC | Regal Beloit Corp. | 75.57 | 1.9 | 3,169.0 | 12.5 | 24.2 |
| RBCAA | Republic Bancorp, Inc. (Kentucky) | 43.88 | 2.4 | 919.4 | 11.8 | 27.8 |
| RCI | Rogers Communications, Inc. | 47.38 | 6.3 | 24,217.8 | 15.5 | 97.5 |
| RCL | Royal Caribbean Cruises Ltd. | 112.20 | 2.6 | 23,512.7 | 12.7 | 32.6 |
| RESI | Front Yard Residential Corp. | 12.44 | 4.8 | 669.6 | -5.3 | -25.6 |
| REXR | Rexford Industrial Realty, Inc. | 47.90 | 1.5 | 5,257.0 | 118.7 | 177.2 |
| RF | Regions Financial Corp. | 16.52 | 4.4 | 15,925.3 | 10.9 | 48.3 |
| RFIL | RF Industries Ltd. | 6.17 | 1.3 | 57.9 | 18.0 | 23.4 |
| RGLD | Royal Gold, Inc. | 119.58 | 0.9 | 7,843.5 | 83.3 | 73.9 |
| RHP | Ryman Hospitality Properties, Inc. | 84.98 | 4.2 | 4,371.6 | 16.7 | 70.0 |
| RJF | Raymond James Financial, Inc. | 84.80 | 1.6 | 11,685.4 | 11.6 | 18.5 |
| RL | Ralph Lauren Corp. | 97.72 | 2.7 | 7,547.9 | 17.8 | 47.8 |
| RLJ | RLJ Lodging Trust | 16.62 | 7.9 | 2,860.9 | 21.3 | 169.2 |
| RNST | Renasant Corp. | 35.03 | 2.5 | 2,012.6 | 11.8 | 28.9 |
| ROP | Roper Technologies, Inc. | 332.95 | 0.6 | 34,627.5 | 29.9 | 16.6 |
| ROYT | Pacific Coast Oil Trust | 1.32 | 19.3 | 50.9 | 4.0 | 78.0 |
| RPAI | Retail Properties of America, Inc. | 13.42 | 6.2 | 2,867.3 | 43.3 | 267.4 |
| RPM | RPM International, Inc. | 72.08 | 2.0 | 9,347.3 | 31.0 | 60.6 |
| RPT | RPT Realty | 14.04 | 6.3 | 1,125.3 | 94.9 | 594.6 |
| RSG | Republic Services, Inc. | 86.04 | 2.2 | 27,597.4 | 26.5 | 59.6 |
| RVSB | Riverview Bancorp, Inc. | 7.35 | 2.3 | 167.0 | 9.6 | 22.2 |
| SAH | Sonic Automotive, Inc. | 34.04 | 1.4 | 1,468.3 | 12.2 | 16.4 |
| SAIC | Science Applications International Corp. | 80.51 | 1.8 | 4,764.6 | 28.4 | 50.1 |
| SBR | Sabine Royalty Trust | 38.15 | 9.5 | 556.2 | 11.1 | 104.9 |
| SCG | SCANA Corporation | 0.00 | 0.0 | 0.0 | ||
| SCIX | Global X Scientific Beta Asia ex-Japan ETF | 24.31 | 0.0 | 0.0 | ||
| SCS | Steelcase, Inc. | 17.78 | 3.2 | 2,081.1 | 15.4 | 49.5 |
| SCVL | Shoe Carnival, Inc. | 34.35 | 1.0 | 504.6 | 13.0 | 12.5 |
| SEIC | SEI Investments Co. | 60.05 | 1.1 | 9,022.9 | 18.8 | 20.6 |
| SFBS | ServisFirst Bancshares, Inc. | 35.26 | 2.2 | 1,889.2 | 13.1 | 28.7 |
| SFNC | Simmons First National Corp. | 24.76 | 3.2 | 2,395.1 | 9.7 | 31.0 |
| SGA | Saga Communications, Inc. | 30.22 | 4.8 | 179.7 | 12.7 | 61.2 |
| SHO | Sunstone Hotel Investors, Inc. | 13.75 | 5.0 | 3,089.6 | 14.7 | 74.0 |
| SJR | Shaw Communications, Inc. | 20.11 | 7.9 | 10,393.3 | 18.7 | 147.3 |
| SJT | San Juan Basin Royalty Trust | 2.58 | 12.0 | 120.3 | 7.0 | 83.6 |
| SKYW | Sky West, Inc. | 59.34 | 0.8 | 3,021.5 | 9.4 | 7.3 |
| SLB | Schlumberger NV | 35.02 | 7.1 | 48,481.3 | -4.9 | -34.9 |
| SLCA | U.S. Silica Holdings, Inc. | 6.04 | 3.2 | 574.7 | -1.7 | -5.5 |
| SLD | Sutherland Asset Management Corporation | 0.00 | 0.0 | 0.0 | ||
| SLG | SL Green Realty Corp. | 82.26 | 4.1 | 7,055.8 | 38.5 | 159.2 |
| SNHY | 0.00 | 0.0 | 0.0 | |||
| SNV | Synovus Financial Corp. | 34.47 | 3.3 | 5,111.2 | 10.1 | 33.5 |
| SNX | SYNNEX Corp. | 119.47 | 1.3 | 6,101.9 | 13.6 | 17.1 |
| SOHO | Sotherly Hotels, Inc. | 6.50 | 7.8 | 92.4 | -9.6 | -75.1 |
| SPR | Spirit AeroSystems Holdings, Inc. | 77.84 | 0.8 | 8,062.0 | 12.0 | 9.2 |
| SR | Spire, Inc. (Missouri) | 83.09 | 2.9 | 4,221.7 | 22.0 | 62.8 |
| SRC | Spirit Realty Capital, Inc. | 48.66 | 5.1 | 4,384.7 | 25.8 | 132.3 |
| SRE | Sempra Energy | 141.17 | 2.7 | 38,758.4 | 20.0 | 53.9 |
| SRG | Seritage Growth Properties | 43.86 | 1.1 | 1,670.0 | -14.4 | -16.5 |
| SSD | Simpson Manufacturing Co., Inc. | 80.48 | 1.2 | 3,365.8 | 29.6 | 35.4 |
| STAG | STAG Industrial, Inc. | 30.92 | 5.8 | 4,233.8 | ||
| STLD | Steel Dynamics, Inc. | 30.84 | 2.9 | 6,797.0 | 8.4 | 24.7 |
| STN | Stantec, Inc. | 21.53 | 2.7 | 2,384.8 | 41.4 | 111.0 |
| STOR | STORE Capital Corp. | 39.10 | 3.4 | 9,031.2 | 39.5 | 135.2 |
| STT | State Street Corp. | 67.12 | 2.9 | 24,406.4 | 13.1 | 37.7 |
| STWD | Starwood Property Trust, Inc. | 24.36 | 7.9 | 6,857.0 | 18.1 | 142.3 |
| STX | Seagate Technology Plc | 57.75 | 4.4 | 15,254.4 | 8.0 | 35.1 |
| SUI | Sun Communities, Inc. | 158.57 | 1.9 | 14,380.4 | 99.7 | 186.2 |
| SUP | Superior Industries International, Inc. | 2.97 | 9.1 | 74.6 | -101.7 | -924.7 |
| SYK | Stryker Corp. | 213.72 | 1.0 | 79,740.0 | 22.5 | 21.9 |
| SYX | Systemax, Inc. | 24.58 | 28.4 | 921.4 | 24.6 | 698.9 |
| SYY | Sysco Corp. | 78.86 | 2.0 | 40,376.9 | 24.3 | 48.0 |
| TAC | TransAlta Corp. | 5.84 | 5.4 | 1,662.7 | -8.0 | -43.7 |
| TCFC | The Community Financial Corp. (Maryland) | 32.94 | 1.5 | 183.9 | 12.2 | 18.5 |
| TD | The Toronto-Dominion Bank | 57.58 | 5.0 | 104,270.5 | 12.1 | 60.7 |
| TEO | Telecom Argentina SA | 9.15 | 14.3 | 1,156.1 | 10.8 | 154.5 |
| TG | Tredegar Corp. | 20.05 | 2.2 | 668.1 | 25.4 | 57.0 |
| TGNA | TEGNA, Inc. | 15.93 | 2.2 | 3,451.3 | 8.4 | 18.4 |
| THFF | First Financial Corp. (Indiana) | 43.15 | 2.4 | 594.0 | 11.8 | 28.3 |
| THO | Thor Industries, Inc. | 67.62 | 2.3 | 3,722.3 | 27.9 | 64.7 |
| TIF | Tiffany & Co. | 129.72 | 1.7 | 15,670.0 | 28.1 | 48.9 |
| TMO | Thermo Fisher Scientific, Inc. | 299.90 | 0.2 | 120,102.8 | 33.5 | 8.3 |
| TOL | Toll Brothers, Inc. | 39.98 | 1.1 | 5,597.5 | 8.4 | 9.3 |
| TOT | Total SA | 52.87 | 5.5 | 137,564.0 | 12.6 | 68.9 |
| TOWN | TowneBank | 28.54 | 2.4 | 2,056.6 | 14.7 | 35.1 |
| TPR | Tapestry, Inc. | 26.13 | 5.2 | 7,521.0 | 11.8 | 60.7 |
| TR | Tootsie Roll Industries, Inc. | 33.58 | 1.1 | 2,200.7 | 35.2 | 37.8 |
| TRN | Trinity Industries, Inc. | 19.53 | 3.3 | 2,412.0 | 17.8 | 58.0 |
| TRNO | Terreno Realty Corp. | 54.86 | 1.8 | 3,587.9 | 56.8 | 102.8 |
| TRP | TC Energy Corp. | 50.38 | 10.1 | 47,239.7 | 14.8 | 149.3 |
| TRST | TrustCo Bank Corp. NY | 8.51 | 3.2 | 824.8 | 13.7 | 44.0 |
| TSE | Trinseo SA | 45.62 | 3.5 | 1,792.0 | 13.9 | 48.7 |
| TSLX | TPG Specialty Lending, Inc. | 21.23 | 8.4 | 1,406.9 | 10.1 | 84.5 |
| TSS | Total System Services, Inc. | 133.27 | 0.4 | 23,587.2 | 38.9 | 15.2 |
| TTC | The Toro Co. | 74.21 | 1.2 | 7,910.9 | 28.8 | 34.9 |
| TU | TELUS Corp. | 35.24 | 6.3 | 21,202.4 | 16.0 | 100.8 |
| TUP | Tupperware Brands Corp. | 16.82 | 8.9 | 820.7 | 6.2 | 54.9 |
| TWI | Titan International, Inc. | 2.97 | 0.7 | 181.1 | -8.4 | -5.6 |
| TXT | Textron, Inc. | 47.03 | 0.2 | 10,735.2 | 12.8 | 2.7 |
| TYPE | Monotype Imaging Holdings, Inc. | 19.84 | 1.8 | 833.3 | 31.9 | 56.0 |
| UBA | Urstadt Biddle Properties, Inc. | 23.87 | 4.6 | 951.3 | 38.0 | 175.2 |
| UBFO | United Security Bancshares (California) | 10.17 | 4.3 | 172.4 | 10.6 | 45.9 |
| UBP | Urstadt Biddle Properties, Inc. | 18.94 | 5.2 | 754.9 | 30.9 | 160.0 |
| UBSI | United Bankshares, Inc. (West Virginia) | 40.15 | 3.4 | 4,077.5 | 15.7 | 53.3 |
| UCBI | United Community Banks, Inc. | 30.93 | 2.1 | 2,441.1 | 13.7 | 29.2 |
| UDR | UDR, Inc. | 49.05 | 2.8 | 23,386.8 | 85.5 | 235.2 |
| UFS | Domtar Corp. | 37.66 | 4.7 | 2,356.9 | 11.5 | 54.5 |
| UGI | UGI Corp. | 47.46 | 2.4 | 9,917.2 | 24.9 | 60.2 |
| UHAL | AMERCO | 406.74 | 0.4 | 7,975.4 | 21.2 | 7.8 |
| UMBF | UMB Financial Corp. | 66.84 | 1.8 | 3,279.7 | 16.5 | 29.7 |
| UMPQ | Umpqua Holdings Corp. | 16.15 | 5.2 | 3,556.4 | 10.2 | 52.9 |
| UNF | UniFirst Corp. | 205.18 | 0.2 | 3,912.2 | 21.0 | 4.6 |
| UNIT | Uniti Group, Inc. | 7.58 | 9.8 | 1,479.5 | 25.9 | 253.3 |
| USB | U.S. Bancorp | 57.02 | 2.7 | 89,578.4 | 13.1 | 35.1 |
| UTMD | Utah Medical Products, Inc. | 97.34 | 1.1 | 362.1 | ||
| UVSP | Univest Financial Corp. | 25.78 | 3.1 | 757.2 | 11.0 | 34.2 |
| VAC | Marriott Vacations Worldwide Corp. | 110.07 | 1.6 | 4,791.0 | 135.7 | 222.0 |
| VCOYY | Viña Concha y Toro S.A. | 0.00 | 0.0 | 0.0 | ||
| VER | VEREIT, Inc. | 9.79 | 5.6 | 10,452.7 | 40.1 | 225.0 |
| VET | Vermilion Energy, Inc. | 15.43 | 19.4 | 2,394.1 | 8.9 | 172.6 |
| VIA | Viacom, Inc. | 23.73 | 3.4 | 9,572.6 | 5.9 | 19.7 |
| VIAB | Viacom, Inc. | 21.53 | 3.7 | 8,685.1 | 5.3 | 19.7 |
| VLGEA | Village Super Market, Inc. | 25.79 | 3.9 | 371.0 | 13.1 | 50.7 |
| VLY | Valley National Bancorp | 11.76 | 3.7 | 3,928.6 | 11.7 | 43.4 |
| VMI | Valmont Industries, Inc. | 136.02 | 1.1 | 2,942.5 | 21.8 | 24.0 |
| VTR | Ventas, Inc. | 64.64 | 4.9 | 24,083.9 | 48.3 | 236.9 |
| VVI | Viad Corp. | 61.35 | 0.6 | 1,254.9 | 51.2 | 33.1 |
| WASH | Washington Trust Bancorp, Inc. | 51.03 | 3.8 | 884.8 | 12.5 | 48.1 |
| WBK | Westpac Banking Corp. | 19.84 | 6.7 | 69,104.6 | 13.2 | 87.6 |
| WDC | Western Digital Corp. | 62.73 | 3.2 | 18,646.0 | -24.2 | -77.2 |
| WDFC | WD-40 Co. | 183.18 | 1.3 | 2,510.3 | 45.5 | 60.6 |
| WERN | Werner Enterprises, Inc. | 38.24 | 10.7 | 2,660.9 | ||
| WEYS | Weyco Group, Inc. | 24.79 | 3.8 | 247.4 | 11.7 | 44.4 |
| WGO | Winnebago Industries, Inc. | 48.46 | 0.9 | 1,626.8 | 13.7 | 11.7 |
| WHG | Westwood Holdings Group, Inc. | 28.86 | 10.0 | 258.2 | 18.6 | 185.6 |
| WHLR | Wheeler Real Estate Investment Trust, Inc. | 1.77 | 0.0 | 17.2 | -0.5 | 0.0 |
| WIRE | Encore Wire Corp. (Delaware) | 57.23 | 0.1 | 1,237.0 | 16.5 | 2.2 |
| WLTW | Willis Towers Watson Plc | 183.38 | 1.4 | 23,654.9 | 28.2 | 39.2 |
| WMC | Western Asset Mortgage Capital Corp. | 9.85 | 12.6 | 524.3 | 10.8 | 135.7 |
| WMT | Walmart, Inc. | 119.22 | 2.2 | 339,095.1 | 26.7 | 59.2 |
| WPC | W.P. Carey, Inc. | 91.30 | 4.5 | 15,592.9 | 32.2 | 145.8 |
| WRE | Washington Real Estate Investment Trust | 30.06 | 5.0 | 2,415.3 | 7.2 | 35.7 |
| WSBC | WesBanco, Inc. | 37.55 | 3.2 | 2,053.6 | 12.3 | 40.0 |
| WSO | Watsco, Inc. | 174.71 | 3.7 | 6,670.7 | ||
| WSR | Whitestone REIT | 14.08 | 9.4 | 566.5 | 30.9 | 292.1 |
| XAN | Exantas Capital Corp. | 11.58 | 7.3 | 369.0 | 14.4 | 105.4 |
| XEL | Xcel Energy, Inc. | 62.44 | 2.6 | 32,157.3 | 24.9 | 63.7 |
| XHR | Xenia Hotels & Resorts, Inc. | 20.87 | 5.3 | 2,350.8 | 17.0 | 89.7 |
| XL | XL Group Ltd | 0.00 | 0.0 | 0.0 | ||
| XRAY | Dentsply Sirona, Inc. | 53.35 | 0.7 | 11,960.2 | 110.6 | 75.1 |
| XRX | Xerox Holdings Corp. | 30.79 | 1.6 | 6,813.3 | 13.6 | 22.0 |
| YORW | York Water Co. | 43.27 | 1.6 | 561.5 | 40.0 | 64.0 |
| ZBH | Zimmer Biomet Holdings, Inc. | 135.95 | 0.7 | 27,912.6 | -77.2 | -54.5 |
| Ticker | Name | Price | Dividend Yield | Market Cap ($M) | P/E Ratio | Payout Ratio |
Keep reading this article to learn more about using the January-paying dividend stocks list to improve your investing outcomes.
How To Use The January Dividend Stocks List To Find Investment Ideas
Having a spreadsheet database that contains the names, tickers, and financial information of every stock that pays dividends in January can be extremely useful.
This document becomes even more powerful when combined with a fundamental knowledge of how to use Microsoft Excel to identify individual investment opportunities.
With this in mind, this tutorial will demonstrate how you can use the Excel list available for download above to find high-quality stocks that pay dividends in the month of January.
More specifically, we’ll show you how to apply two screens. The first screen is to find blue-chip stocks with dividend yields above 2% and market capitalizations above $20 billion.
Screen 1: Dividend Yields Above 2% and Market Capitalizations Below $20 Billion
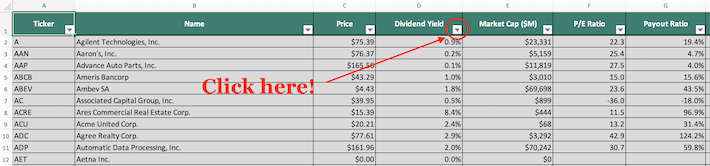
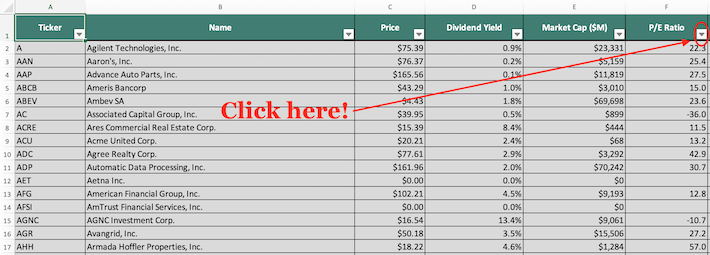
Step 1: Download the January-paying dividend stocks list by clicking here. Apply Excel’s filter function to every column in the spreadsheet.
Step 2: Click the filter icon at the top of the dividend yield column, as shown below.
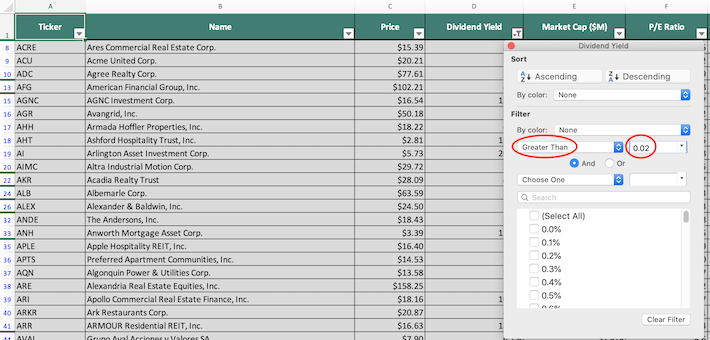
Step 3: Change the filter setting to “Greater Than” and input 0.02 into the field beside it. Since dividend yield is measured as a percent, this will filter for January-paying dividend stocks with yields above 2%.
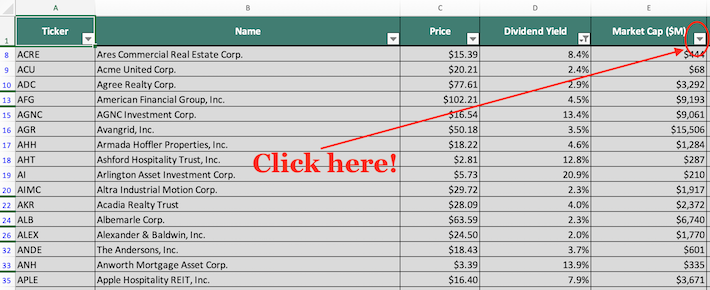
Step 4: Close out of the filter window (by clicking the exit button, not by clicking the “Clear Filter” button in the bottom right corner). Next, click the filter icon at the top of the market capitalization column, as shown below.
Step 5: Change the filter setting to “Greater Than” and input 20000 into the field beside it. Since market capitalizations is measured in millions in this document, this is equivalent to filtering for January-paying dividend stocks with market capitalizations above $20 billion.
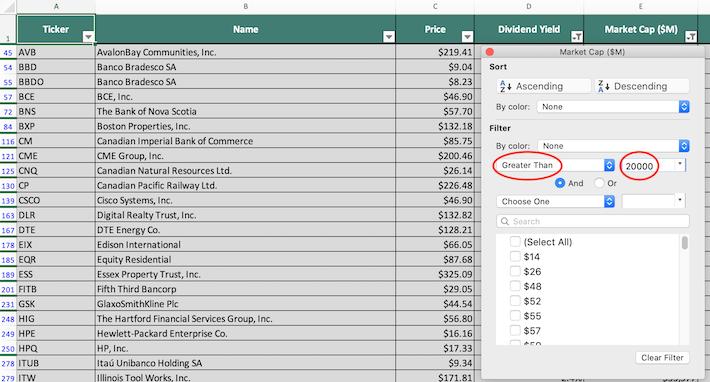
The remaining stocks in this spreadsheet are stocks that pay dividends in January that have dividend yields above 2% and market capitalizations above $20 billion.
The next screen that we’ll demonstrate excludes overvalued stocks by screening for January dividend stocks with price-to-earnings ratios below 20 and dividend yields above 3%.
Screen 2: Price-to-Earnings Ratios Below 20 and Dividend Yields Above 3%
Step 1: Download the January-paying dividend stocks list by clicking here. Apply Excel’s filter function to every column in the spreadsheet.
Step 2: Click the filter icon at the top of the price-to-earnings ratio column, as shown below.
Step 3: Change the filter setting to “Less Than” and input 20 into the field beside it, as shown below. This will filter for stocks that pay dividends in January with price-to-earnings ratios less than 20.

Step 4: Close out of the filter window (by clicking the exit button, not by clicking the “Clear Filter” button in the bottom right corner). Next, click the filter icon at the top of the dividend yield column, as shown below.
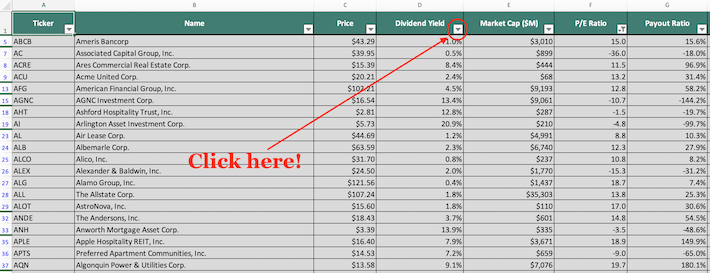
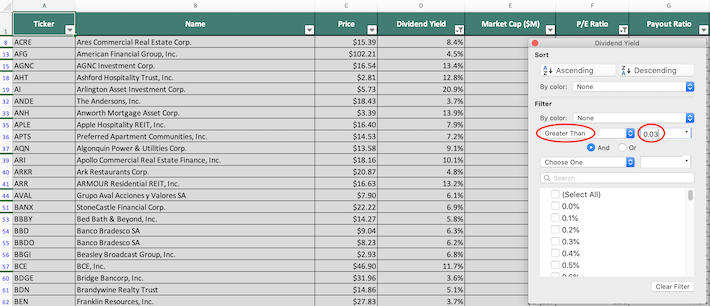
Step 5: Change the filter setting to “Greater Than” and input 0.03 into the field beside it, as shown below. This will filter for stocks that pay dividends in January with dividend yields above 3%.
You now have a solid, fundamental understanding of how to use the January-paying dividend stocks list to find investment ideas.
The remainder of this article will discuss other useful investing resources that can assist you along your journey in the world of equity investing.
Other Useful Investing Databases
Having an Excel document that contains the name, tickers, and financial information for all stocks that pay dividends in January is useful – but it becomes far more useful when combined with other databases for the other months of the calendar year.
You can access our other calendar month databases below:
- The Complete List of Stocks That Pay Dividends in February
- The Complete List of Stocks That Pay Dividends in March
- The Complete List of Stocks That Pay Dividends in April
- The Complete List of Stocks That Pay Dividends in May
- The Complete List of Stocks That Pay Dividends in June
- The Complete List of Stocks That Pay Dividends in July
- The Complete List of Stocks That Pay Dividends in August
- The Complete List of Stocks That Pay Dividends in September
- The Complete List of Stocks That Pay Dividends in October
- The Complete List of Stocks That Pay Dividends in November
- The Complete List of Stocks That Pay Dividends in December
If you are interested in finding high-quality dividend growth stocks suitable for long-term investment but don’t necessarily need these companies to pay dividends in January, the following Sure Dividend databases will be useful:
- The Dividend Aristocrats List: a group of elite S&P 500 stocks with 25+ years of consecutive dividend increases.
- The Dividend Achievers List: the Dividend Achievers are composed of stocks with 10+ years of consecutive dividend increases.
- The Dividend Kings List: considered to be the best-of-the-best among dividend growth stocks, the Dividend Kings are a group of exceptional dividend stocks with 50+ years of consecutive dividend increases.
- The Blue Chip Stocks List: our list of Blue Chip Stocks is updated monthly and contains stocks
- The Monthly Dividend Stocks List: monthly dividend stocks are ideal for investors looking to generate consistent portfolio income. Our list of monthly dividend stocks is updated monthly and currently contains more than 40 securities.
- The High Dividend Stocks List: high dividend stocks are suited for investors that need income now (as opposed to growth later).
Alternatively, you may be looking to invest in stocks from a certain sector of the stock market (instead of stocks that pay dividends during a particular calendar month). If this is the case, the following Sure Dividend databases are excellent resources:
- The Complete List of Dividend-Paying Industrial Stocks
- The Complete List of Dividend-Paying Materials Stocks
- The Complete List of Dividend-Paying Utility Stocks
- The Complete List of Dividend-Paying Telecommunications Stocks
- The Complete List of Dividend-Paying Technology Stocks
- The Complete List of Dividend-Paying Consumer Staples Stocks
- The Complete List of Dividend-Paying Consumer Cyclical Stocks
- The Complete List of Dividend-Paying Healthcare Stocks
- The Complete List of Dividend-Paying Energy Stocks
- The Complete List of Dividend-Paying Financial Stocks
The major domestic stock market indices are another solid resource for finding investment ideas. Sure Dividend compiles the following stock market databases and updates them monthly:
- The Complete List of S&P 500 Stocks
- The Complete List of Russell 2000 Stocks
- The Complete List of Dow Jones Industrial Average Stocks
- The Complete List of NASDAQ-100 Stocks
You may also wish to explore international stock markets for more unique investment ideas. Sure Dividend maintains the following databases of international stocks for your research purposes:
- The Complete List of S&P/TSX Composite Stocks: the S&P/TSX Composite Index is the most widely-quoted index of Canadian equities.
- The Complete List of TSX 60 Stocks: the TSX 60 Index contains the 60 largest companies on the Toronto Stock Exchange and is a useful alternative index for Canadian equities.
- The Complete List of DAX Index Stocks: the DAX Index is a widely-quoted index of German equities that consists of the 30 largest companies that trade on the Frankfurt Stock Exchange.
- The Complete List of Nikkei 225 Stocks: the Nikkei 225 is a price-weighted index of Japanese equities and is the country’s most well-known equity index.
- The Complete List of FTSE 100 Stocks: the FTSE 100 is comprised of the 100 largest companies on the London Stock Exchange.
A last resource to find investing ideas (and learn about investing in general) is by studying the portfolios and strategies of the world’s best investors. With that in mind, you may find the following articles to be useful: