


Spreadsheet data updated daily
In order for retirees to generate dividend income that remains relatively stable on a month-to-month basis, it is necessary for them to understand what stocks pay dividends in which months.
That’s where Sure Dividend comes in. We’ve created a database of every stock that pays dividends in April, which you can download below:
The database of stocks that pay dividends in April available for download above contains the following metrivcs for every security in the list:
- Name
- Ticker
- Stock price
- Dividend yield
- Market capitalization
- P/E Ratio
- Payout Ratio
- Beta
Additionally, you can find and sort April paying dividend stocks using the table below.
| A | Agilent Technologies, Inc. | 76.17 | 0.9 | 23,572.2 | 22.5 | 19.4 |
| AAME | Atlantic American Corp. | 2.25 | 0.9 | 45.4 | 99.1 | 88.1 |
| AAN | Aaron's, Inc. | 78.14 | 0.2 | 5,278.1 | 26.0 | 4.7 |
| AAP | Advance Auto Parts, Inc. | 164.35 | 0.1 | 11,732.5 | 27.3 | 4.0 |
| ABCB | Ameris Bancorp | 44.04 | 1.0 | 3,061.7 | 15.2 | 15.6 |
| ACRE | Ares Commercial Real Estate Corp. | 15.50 | 8.4 | 447.5 | 11.6 | 96.9 |
| ACU | Acme United Corp. | 20.57 | 2.3 | 69.0 | 13.4 | 31.4 |
| ADC | Agree Realty Corp. | 78.44 | 2.9 | 3,326.9 | 43.3 | 124.2 |
| ADP | Automatic Data Processing, Inc. | 162.83 | 1.9 | 70,619.2 | 30.8 | 59.8 |
| AEO | American Eagle Outfitters, Inc. | 16.18 | 3.4 | 2,733.8 | 10.5 | 35.8 |
| AET | Aetna Inc. | 0.00 | 0.0 | 0.0 | ||
| AFG | American Financial Group, Inc. | 103.37 | 4.5 | 9,297.3 | 12.9 | 58.2 |
| AFSI | AmTrust Financial Services, Inc. | 0.00 | 0.0 | 0.0 | ||
| AGI | Alamos Gold, Inc. | 5.02 | 0.6 | 1,992.6 | -82.3 | -48.3 |
| AGNC | AGNC Investment Corp. | 16.65 | 16.2 | 9,121.2 | -10.8 | -175.4 |
| AGR | Avangrid, Inc. | 49.99 | 3.5 | 15,447.2 | 27.1 | 95.4 |
| AGX | Argan, Inc. | 38.59 | 2.6 | 603.3 | 374.7 | 970.9 |
| AHH | Armada Hoffler Properties, Inc. | 18.36 | 4.5 | 1,293.8 | 57.4 | 259.5 |
| AHT | Ashford Hospitality Trust, Inc. | 2.60 | 13.8 | 265.5 | -1.4 | -19.7 |
| AI | Arlington Asset Investment Corp. | 5.80 | 20.7 | 212.6 | -4.8 | -99.7 |
| AIMC | Altra Industrial Motion Corp. | 31.21 | 2.7 | 2,013.2 | 23.6 | 64.4 |
| AIN | Albany International Corp. | 81.83 | 0.9 | 2,512.2 | 24.2 | 21.3 |
| AKR | Acadia Realty Trust | 28.02 | 4.0 | 2,427.8 | 63.6 | 254.1 |
| AL | Air Lease Corp. | 44.83 | 1.2 | 5,006.4 | 8.9 | 10.3 |
| ALB | Albemarle Corp. | 63.03 | 4.6 | 6,680.3 | 12.2 | 56.5 |
| ALCO | Alico, Inc. | 32.05 | 0.7 | 239.6 | 10.9 | 8.2 |
| ALG | Alamo Group, Inc. | 127.78 | 0.4 | 1,510.1 | 19.7 | 7.4 |
| ALL | The Allstate Corp. | 108.22 | 1.8 | 35,625.2 | 13.9 | 25.3 |
| AMH | American Homes 4 Rent | 26.36 | 0.8 | 7,920.5 | 109.7 | 83.2 |
| AMOT | Allied Motion Technologies, Inc. | 38.20 | 0.3 | 366.7 | 21.7 | 6.8 |
| AMT | American Tower Corp. | 216.16 | 1.7 | 95,690.8 | 64.9 | 108.4 |
| ANDE | The Andersons, Inc. | 18.90 | 3.6 | 616.1 | 15.1 | 54.5 |
| ANH | Anworth Mortgage Asset Corp. | 3.43 | 13.7 | 338.7 | -3.5 | -48.6 |
| ANW | Aegean Marine Petroleum Network Inc. | 0.00 | 0.0 | 0.0 | ||
| APH | Amphenol Corp. | 100.98 | 0.9 | 30,036.3 | 25.6 | 23.8 |
| APLE | Apple Hospitality REIT, Inc. | 16.37 | 7.9 | 3,664.7 | 18.9 | 149.9 |
| APTS | Preferred Apartment Communities, Inc. | 14.35 | 7.3 | 650.5 | -8.9 | -65.0 |
| AQN | Algonquin Power & Utilities Corp. | 13.55 | 9.3 | 6,946.7 | 19.7 | 183.1 |
| ARCO | Arcos Dorados Holdings, Inc. | 7.38 | 1.5 | 1,510.1 | 26.3 | 39.1 |
| ARE | Alexandria Real Estate Equities, Inc. | 156.31 | 2.5 | 17,818.6 | 147.7 | 372.2 |
| ARI | Apollo Commercial Real Estate Finance, Inc. | 18.16 | 10.1 | 2,788.2 | 13.7 | 138.7 |
| ARKR | Ark Restaurants Corp. | 21.09 | 4.7 | 73.8 | 17.3 | 82.0 |
| ARR | ARMOUR Residential REIT, Inc. | 16.70 | 14.2 | 983.5 | -1.5 | -20.6 |
| ATNI | ATN International, Inc. | 61.41 | 1.1 | 982.9 | 12,041.2 | 13,333.3 |
| AU | AngloGold Ashanti Ltd. | 20.34 | 0.3 | 8,308.7 | 39.2 | 13.1 |
| AUY | Yamana Gold, Inc. | 3.51 | 2.8 | 3,345.5 | 22.3 | 62.2 |
| AVAL | Grupo Aval Acciones y Valores SA | 8.13 | 7.0 | 2,910.5 | 8.8 | 62.0 |
| AVB | AvalonBay Communities, Inc. | 215.31 | 2.8 | 30,069.5 | 32.6 | 91.2 |
| AVD | American Vanguard Corp. | 13.99 | 0.6 | 422.5 | 19.6 | 11.2 |
| AXS | AXIS Capital Holdings Ltd. | 62.00 | 2.6 | 5,204.7 | 47.7 | 123.1 |
| BANC | Banc of California, Inc. | 13.79 | 2.8 | 701.7 | -373.7 | -1,029.8 |
| BANF | BancFirst Corp. (Oklahoma) | 58.79 | 2.1 | 1,919.1 | 14.5 | 30.2 |
| BANR | Banner Corp. | 56.64 | 2.8 | 1,937.8 | 13.1 | 37.1 |
| BAX | Baxter International, Inc. | 77.86 | 1.1 | 39,751.9 | 25.7 | 27.1 |
| BBBY | Bed Bath & Beyond, Inc. | 14.80 | 5.6 | 1,873.2 | -2.6 | -14.4 |
| BBD | Banco Bradesco SA | 8.89 | 3.3 | 36,383.7 | 13.1 | 43.8 |
| BBDO | Banco Bradesco SA | 8.28 | 14.4 | 33,760.9 | 12.2 | 175.7 |
| BBGI | Beasley Broadcast Group, Inc. | 2.87 | 7.0 | 80.0 | 7.6 | 53.3 |
| BBVA | Banco Bilbao Vizcaya Argentaria SA | 5.38 | 11.5 | 35,787.2 | 7.0 | 80.6 |
| BBY | Best Buy Co., Inc. | 73.90 | 2.6 | 19,478.0 | 13.1 | 34.7 |
| BCE | BCE, Inc. | 47.49 | 11.6 | 42,610.5 | 19.3 | 223.8 |
| BCRH | Blue Capital Reinsurance Holdings Ltd. | 6.88 | 26.3 | 60.4 | -2.1 | -55.1 |
| BCS | Barclays Plc | 8.58 | 4.1 | 37,707.2 | 9.1 | 37.3 |
| BDC | Belden, Inc. | 55.41 | 0.4 | 2,518.5 | 13.7 | 4.9 |
| BDGE | Bridge Bancorp, Inc. | 32.54 | 3.5 | 645.7 | 12.6 | 44.7 |
| BDN | Brandywine Realty Trust | 15.06 | 5.0 | 2,647.7 | 19.4 | 97.8 |
| BEN | Franklin Resources, Inc. | 28.12 | 3.7 | 14,163.1 | 11.9 | 44.1 |
| BFS | Saul Centers, Inc. | 56.02 | 3.8 | 1,288.5 | 31.7 | 119.8 |
| BGG | Briggs & Stratton Corp. | 7.50 | 6.3 | 315.2 | -5.7 | -35.9 |
| BGS | B&G Foods, Inc. | 15.75 | 12.1 | 1,029.7 | 5.8 | 69.8 |
| BIG | Big Lots, Inc. | 22.58 | 5.3 | 881.0 | 7.3 | 38.9 |
| BKE | The Buckle, Inc. | 21.78 | 9.2 | 1,072.1 | 11.3 | 104.2 |
| BKS | Barnes & Noble, Inc. | 6.49 | 6.9 | 475.1 | 125.5 | 870.4 |
| BKSC | Bank of South Carolina Corp. | 18.63 | 3.9 | 103.0 | 14.4 | 56.6 |
| BKTI | BK Technologies Corp. | 3.46 | 1.7 | 44.0 | -19.6 | -34.0 |
| BKU | BankUnited, Inc. | 35.09 | 2.4 | 3,336.0 | 12.8 | 30.7 |
| BNS | The Bank of Nova Scotia | 57.56 | 6.1 | 70,383.4 | 11.4 | 69.0 |
| BOCH | Bank of Commerce Holdings | 11.30 | 1.6 | 205.8 | 12.7 | 20.3 |
| BOOM | DMC Global, Inc. | 45.61 | 0.4 | 668.0 | 12.4 | 5.0 |
| BPOP | Popular, Inc. | 56.11 | 2.0 | 5,426.7 | 9.0 | 18.5 |
| BPT | BP Prudhoe Bay Royalty Trust | 8.17 | 27.3 | 174.8 | 2.0 | 54.0 |
| BR | Broadridge Financial Solutions, Inc. | 124.60 | 1.6 | 14,260.8 | 29.9 | 47.9 |
| BRC | Brady Corp. | 58.36 | 1.5 | 3,093.0 | 23.4 | 34.3 |
| BRG | Bluerock Residential Growth REIT, Inc. | 11.91 | 5.5 | 283.9 | -5.9 | -32.1 |
| BRT | BRT Apartments Corp. | 16.75 | 4.9 | 266.3 | -15.7 | -76.8 |
| BRX | Brixmor Property Group, Inc. | 21.41 | 10.6 | 6,376.9 | 18.0 | 190.4 |
| BUSE | First Busey Corp. | 26.61 | 3.2 | 1,468.8 | 14.2 | 44.7 |
| BXMT | Blackstone Mortgage Trust, Inc. | 36.26 | 6.8 | 4,869.3 | 15.3 | 104.5 |
| BXP | Boston Properties, Inc. | 133.30 | 2.9 | 20,603.9 | 39.0 | 111.1 |
| BXS | BancorpSouth Bank | 31.36 | 2.8 | 3,235.6 | 14.6 | 40.9 |
| BYD | Boyd Gaming Corp. | 27.35 | 1.0 | 3,039.7 | 19.9 | 18.9 |
| CAC | Camden National Corp. (Maine) | 44.48 | 2.7 | 685.4 | 12.5 | 33.7 |
| CAH | Cardinal Health, Inc. | 51.23 | 3.7 | 14,979.9 | 11.3 | 42.3 |
| CAL | Caleres, Inc. | 22.59 | 1.2 | 919.8 | -68.5 | -85.0 |
| CARO | Carolina Financial Corp. | 37.20 | 1.2 | 827.7 | 13.4 | 15.5 |
| CASH | Meta Financial Group, Inc. | 32.05 | 0.6 | 1,217.1 | 12.9 | 8.0 |
| CB | Chubb Ltd. | 148.63 | 2.0 | 67,738.0 | 18.1 | 36.0 |
| CBL | CBL & Associates Properties, Inc. | 1.54 | 9.7 | 308.4 | -1.5 | -14.7 |
| CBS | CBS Corp. | 36.19 | 2.0 | 13,559.2 | 4.4 | 8.8 |
| CBU | Community Bank System, Inc. | 68.83 | 2.3 | 3,556.8 | 21.3 | 47.9 |
| CCMP | Cabot Microelectronics Corp. | 155.41 | 1.1 | 4,564.2 | 39.2 | 41.4 |
| CFFI | C&F Financial Corp. | 50.30 | 2.9 | 172.2 | 9.4 | 27.8 |
| CHCO | City Holding Co. | 80.21 | 2.7 | 1,315.2 | 16.9 | 45.6 |
| CHH | Choice Hotels International, Inc. | 87.24 | 1.0 | 4,859.0 | 22.6 | 22.3 |
| CHMG | Chemung Financial Corp. | 43.02 | 2.4 | 209.7 | 12.2 | 29.5 |
| CHMI | Cherry Hill Mortgage Investment Corp. | 13.49 | 15.0 | 231.6 | -3.5 | -51.7 |
| CHS | Chico's FAS, Inc. | 3.64 | 9.5 | 429.1 | -41.7 | -398.1 |
| CHSP | Chesapeake Lodging Trust | 27.17 | 4.4 | 1,651.0 | 17.4 | 76.8 |
| CI | Cigna Corp. | 177.98 | 0.0 | 67,206.8 | 16.1 | 0.4 |
| CIB | Bancolombia SA | 52.31 | 2.3 | 6,683.5 | 11.9 | 27.7 |
| CIM | Chimera Investment Corp. | 20.43 | 9.8 | 3,823.6 | 22.3 | 218.5 |
| CINF | Cincinnati Financial Corp. | 111.38 | 2.0 | 18,196.6 | 19.8 | 39.3 |
| CIO | City Office REIT, Inc. | 13.45 | 7.0 | 733.7 | -34.1 | -238.0 |
| CKX | CKX Lands, Inc. | 9.57 | 0.0 | 18.6 | 72.9 | 0.0 |
| CLDT | Chatham Lodging Trust | 17.77 | 8.0 | 833.8 | 33.1 | 266.3 |
| CLI | Mack-Cali Realty Corp. | 22.08 | 3.6 | 1,999.4 | 8.2 | 29.9 |
| CLNY | Colony Capital, Inc. | 5.67 | 7.8 | 2,765.3 | -2.6 | -20.4 |
| CM | Canadian Imperial Bank of Commerce | 86.06 | 6.5 | 38,334.3 | 10.0 | 64.8 |
| CMA | Comerica, Inc. | 66.98 | 3.9 | 9,651.8 | 8.4 | 32.7 |
| CMC | Commercial Metals Co. | 19.68 | 3.0 | 2,321.0 | 11.7 | 35.7 |
| CMCSA | Comcast Corp. | 45.35 | 3.7 | 206,308.7 | 16.6 | 60.7 |
| CMFN | CM Finance, Inc. | 7.03 | 14.2 | 95.7 | -16.6 | -236.4 |
| CMO | Capstead Mortgage Corp. | 7.83 | 5.1 | 740.8 | -8.5 | -43.3 |
| CNMD | CONMED Corp. | 99.64 | 0.8 | 2,819.1 | 99.5 | 79.9 |
| CNQ | Canadian Natural Resources Ltd. | 25.98 | 5.6 | 30,912.1 | 8.6 | 48.2 |
| CODI | Compass Diversified Holdings | 20.25 | 7.1 | 1,213.0 | -30.8 | -218.8 |
| COHU | Cohu, Inc. | 16.70 | 1.4 | 686.3 | -7.4 | -10.6 |
| CONE | CyrusOne, Inc. | 74.00 | 2.5 | 8,379.6 | -108.0 | -274.1 |
| COR | CoreSite Realty Corp. | 120.45 | 3.9 | 4,443.5 | 56.4 | 217.1 |
| CP | Canadian Pacific Railway Ltd. | 224.31 | 2.3 | 31,048.6 | 17.9 | 41.1 |
| CPB | Campbell Soup Co. | 46.49 | 3.0 | 14,002.2 | 52.4 | 157.8 |
| CPG | Crescent Point Energy Corp. | 4.04 | 3.0 | 2,205.2 | -1.4 | -4.0 |
| CPHC | Canterbury Park Holding Corp. | 12.24 | 2.3 | 56.6 | 11.0 | 25.3 |
| CPK | Chesapeake Utilities Corp. | 93.55 | 1.7 | 1,534.6 | 25.4 | 42.1 |
| CPT | Camden Property Trust | 113.45 | 2.8 | 10,985.0 | 69.0 | 192.9 |
| CRT | Cross Timbers Royalty Trust | 8.78 | 12.5 | 52.7 | 7.4 | 92.1 |
| CRWS | Crown Crafts, Inc. | 5.80 | 5.5 | 58.7 | 10.0 | 55.4 |
| CSB | VictoryShares US Small Cap High Div Volatility Wtd ETF | 46.11 | 0.0 | 0.0 | ||
| CSCO | Cisco Systems, Inc. | 47.24 | 2.9 | 200,478.5 | 18.0 | 52.5 |
| CSWC | Capital Southwest Corp. | 22.01 | 8.8 | 389.5 | 13.4 | 117.8 |
| CTBI | Community Trust Bancorp, Inc. (Kentucky) | 44.06 | 4.2 | 783.3 | 12.1 | 50.7 |
| CTRE | CareTrust REIT, Inc. | 23.57 | 3.7 | 2,252.3 | 31.4 | 117.2 |
| CTS | CTS Corp. | 27.18 | 0.6 | 886.1 | 20.5 | 12.0 |
| CUBE | CubeSmart | 31.95 | 4.0 | 6,184.1 | 34.5 | 138.2 |
| CUZ | Cousins Properties, Inc. | 39.44 | 1.8 | 5,788.3 | 113.3 | 206.1 |
| CVA | Covanta Holding Corp. | 14.53 | 6.9 | 1,903.4 | 269.1 | 1,851.9 |
| CVBF | CVB Financial Corp. | 21.34 | 3.2 | 2,991.0 | 14.9 | 47.6 |
| CVG | Convergys Corporation | 0.00 | 0.0 | 0.0 | ||
| CW | Curtiss-Wright Corp. | 129.99 | 0.5 | 5,554.5 | 19.2 | 9.4 |
| CWCO | Consolidated Water Co. Ltd. | 17.15 | 2.0 | 257.7 | 21.3 | 42.3 |
| CXW | CoreCivic, Inc. | 15.47 | 11.3 | 1,842.4 | 10.2 | 115.4 |
| CY | Cypress Semiconductor Corp. | 23.26 | 1.9 | 8,597.7 | 29.4 | 55.5 |
| DCT | DCT Industrial Trust Inc. | 0.00 | 0.0 | 0.0 | ||
| DDR | DDR Corp. | 0.00 | 0.0 | 0.0 | ||
| DEI | Douglas Emmett, Inc. | 42.97 | 2.4 | 8,737.9 | 62.0 | 150.1 |
| DEO | Diageo Plc | 162.14 | 2.2 | 93,919.2 | 24.0 | 51.8 |
| DG | Dollar General Corp. | 160.62 | 0.8 | 41,290.3 | 25.7 | 20.0 |
| DGX | Quest Diagnostics, Inc. | 100.96 | 2.1 | 13,599.0 | 18.7 | 39.2 |
| DHR | Danaher Corp. | 137.27 | 0.5 | 98,598.4 | 40.2 | 19.6 |
| DIN | Dine Brands Global, Inc. | 73.11 | 4.6 | 1,255.7 | 12.7 | 58.8 |
| DOC | Physicians Realty Trust | 18.35 | 5.0 | 3,400.6 | 66.2 | 332.0 |
| DOX | Amdocs Ltd. | 65.50 | 1.7 | 8,919.8 | 22.6 | 38.0 |
| DRH | DiamondRock Hospitality Co. | 9.98 | 5.0 | 1,998.0 | 22.0 | 110.4 |
| DSW | DSW, Inc. | 22.51 | 4.4 | 1,765.5 | -86.2 | -383.0 |
| DTE | DTE Energy Co. | 126.59 | 6.2 | 23,947.8 | 21.2 | 130.9 |
| DVCR | Diversicare Healthcare Services, Inc. | 2.70 | 2.0 | 18.0 | -0.5 | -1.0 |
| DX | Dynex Capital, Inc. | 15.40 | 8.4 | 379.7 | -1.5 | -12.6 |
| DXC | DXC Technology Co. | 27.86 | 3.6 | 7,298.3 | 6.6 | 23.8 |
| EARN | Ellington Residential Mortgage REIT | 10.89 | 11.4 | 135.8 | -672.2 | -7,654.3 |
| EBSB | Meridian Bancorp, Inc. | 19.62 | 1.4 | 1,045.7 | 16.1 | 23.0 |
| EC | Ecopetrol SA | 18.18 | 7.1 | 37,375.1 | 10.0 | 70.9 |
| ECC | Eagle Point Credit Co., Inc. | 15.49 | 18.1 | 376.6 | -14.1 | -254.3 |
| ECL | Ecolab, Inc. | 194.52 | 0.9 | 55,973.5 | 37.5 | 35.5 |
| ECOL | US Ecology, Inc. | 64.90 | 1.1 | 1,433.1 | 28.1 | 31.2 |
| EHC | Encompass Health Corp. | 63.72 | 3.5 | 6,286.6 | 19.6 | 68.0 |
| EIX | Edison International | 65.40 | 3.7 | 23,419.1 | -85.9 | -321.8 |
| ELS | Equity LifeStyle Properties, Inc. | 68.83 | 3.5 | 12,531.7 | ||
| EME | EMCOR Group, Inc. | 90.55 | 0.4 | 5,083.0 | 16.4 | 5.8 |
| EMN | Eastman Chemical Co. | 78.15 | 3.2 | 10,706.1 | ||
| ENSG | The Ensign Group, Inc. | 41.81 | 0.5 | 2,232.1 | 21.4 | 9.7 |
| EOG | EOG Resources, Inc. | 71.81 | 1.4 | 41,675.4 | 11.6 | 16.4 |
| EPR | EPR Properties | 78.73 | 6.1 | 6,106.0 | 23.3 | 142.7 |
| EQR | Equity Residential | 87.57 | 2.6 | 32,517.1 | 40.3 | 103.2 |
| ERF | Enerplus Corp. | 6.37 | 2.5 | 1,469.1 | 4.6 | 11.5 |
| ERIE | Erie Indemnity Co. | 186.91 | 1.9 | 8,633.7 | 27.2 | 52.5 |
| ERJ | Embraer SA | 17.58 | 0.1 | 3,263.6 | -41.5 | -2.5 |
| ESE | ESCO Technologies, Inc. | 83.51 | 0.4 | 2,169.7 | 25.6 | 9.8 |
| ESLT | Elbit Systems Ltd. | 165.52 | 1.1 | 7,076.5 | 42.1 | 44.8 |
| ESS | Essex Property Trust, Inc. | 323.22 | 2.4 | 21,359.0 | 52.0 | 124.0 |
| ETH | Ethan Allen Interiors, Inc. | 19.71 | 9.0 | 524.0 | 20.5 | 184.7 |
| EVBN | Evans Bancorp, Inc. | 37.02 | 2.8 | 182.1 | ||
| EVRG | Evergy, Inc. | 63.55 | 3.0 | 14,963.9 | 26.9 | 80.5 |
| FBNC | First Bancorp (North Carolina) | 38.19 | 1.2 | 1,130.6 | ||
| FCNCA | First Citizens BancShares, Inc. (North Carolina) | 500.11 | 0.3 | 5,581.2 | 13.3 | 4.2 |
| FCPT | Four Corners Property Trust, Inc. | 28.41 | 4.0 | 1,943.8 | 25.8 | 104.4 |
| FDX | FedEx Corp. | 158.01 | 1.6 | 41,226.4 | 92.6 | 152.3 |
| FFIN | First Financial Bankshares, Inc. | 34.85 | 3.2 | 4,779.6 | 29.2 | 94.7 |
| FHN | First Horizon National Corp. (Tennessee) | 16.36 | 6.7 | 5,087.8 | 12.5 | 84.0 |
| FISI | Financial Institutions, Inc. | 30.90 | 3.2 | 494.2 | 12.5 | 39.9 |
| FITB | Fifth Third Bancorp | 29.63 | 3.1 | 21,291.6 | 9.5 | 29.5 |
| FLIC | The First of Long Island Corp. | 23.74 | 2.9 | 585.7 | 14.4 | 41.8 |
| FLR | Fluor Corp. | 19.56 | 4.3 | 2,751.0 | -5.6 | -24.1 |
| FLS | Flowserve Corp. | 50.00 | 1.5 | 6,558.5 | 31.7 | 48.1 |
| FLXS | Flexsteel Industries, Inc. | 16.20 | 5.4 | 128.3 | -5.2 | -28.5 |
| FMBH | First Mid Bancshares, Inc. | 35.00 | 3.2 | 583.2 | 12.6 | 40.3 |
| FMBI | First Midwest Bancorp, Inc. (Illinois) | 21.01 | 2.5 | 2,310.5 | 12.1 | 29.9 |
| FMC | FMC Corp. | 84.91 | 1.9 | 11,075.1 | 21.8 | 41.1 |
| FNLC | The First Bancorp, Inc. (Maine) | 28.29 | 4.2 | 308.2 | 12.2 | 50.7 |
| FOX | Fox Corp. | 32.05 | 1.4 | 19,891.2 | 12.5 | 17.9 |
| FOXA | Fox Corp. | 32.84 | 1.4 | 20,381.5 | 12.8 | 17.9 |
| FPI | Farmland Partners, Inc. | 6.74 | 3.0 | 199.5 | 47.3 | 140.3 |
| FR | First Industrial Realty Trust, Inc. | 41.70 | 2.2 | 5,274.5 | 27.4 | 59.6 |
| FRT | Federal Realty Investment Trust | 138.98 | 3.0 | 10,504.3 | 42.1 | 124.5 |
| FSV | FirstService Corp. | 88.63 | 0.3 | 3,069.4 | -13.4 | -4.6 |
| FTI | TechnipFMC Plc | 20.27 | 3.2 | 9,050.2 | -4.3 | -13.9 |
| FULT | Fulton Financial Corp. | 17.22 | 3.2 | 2,839.5 | 12.3 | 39.2 |
| GBCI | Glacier Bancorp, Inc. | 43.43 | 3.2 | 4,003.4 | 18.5 | 58.7 |
| GE | General Electric Co. | 9.07 | 0.4 | 79,154.5 | -3.7 | -1.6 |
| GEF | Greif, Inc. | 40.18 | 4.4 | 1,939.3 | 16.2 | 71.1 |
| GES | Guess?, Inc. | 17.25 | 3.9 | 1,122.6 | 84.9 | 334.9 |
| GFF | Griffon Corp. | 21.17 | 1.4 | 990.8 | -119.9 | -164.3 |
| GGP | 0.00 | 0.0 | 0.0 | |||
| GIL | Gildan Activewear, Inc. | 25.94 | 4.6 | 5,269.4 | 18.1 | 83.9 |
| GLNG | Golar LNG Ltd. | 14.73 | 3.0 | 1,519.5 | -3.7 | -11.1 |
| GNL | Global Net Lease, Inc. | 19.35 | 11.0 | 1,634.8 | 159.0 | 1,750.2 |
| GNTX | Gentex Corp. | 28.39 | 1.6 | 7,273.9 | 16.9 | 27.0 |
| GOOD | Gladstone Commercial Corp. | 22.73 | 7.7 | 724.3 | 427.3 | 3,289.5 |
| GORO | Gold Resource Corp. | 3.99 | 0.6 | 271.5 | 89.9 | 50.6 |
| GPC | Genuine Parts Co. | 103.26 | 2.9 | 15,003.0 | 18.9 | 55.0 |
| GPK | Graphic Packaging Holding Co. | 15.53 | 1.9 | 4,516.2 | 20.9 | 40.3 |
| GPMT | Granite Point Mortgage Trust, Inc. | 18.70 | 9.0 | 1,025.8 | 12.9 | 116.0 |
| GPT | Gramercy Property Trust | 0.00 | 0.0 | 0.0 | ||
| GROW | U.S. Global Investors, Inc. | 1.88 | 1.9 | 28.4 | -8.4 | -15.6 |
| GSBC | Great Southern Bancorp, Inc. (Missouri) | 60.71 | 3.4 | 862.9 | 11.8 | 39.8 |
| GSK | GlaxoSmithKline Plc | 45.02 | 4.5 | 110,331.7 | 19.4 | 87.9 |
| GTY | Getty Realty Corp. | 33.49 | 5.3 | 1,379.8 | 28.4 | 150.0 |
| GVA | Granite Construction, Inc. | 24.06 | 2.2 | 1,110.1 | -10.7 | -23.4 |
| GWRS | Global Water Resources, Inc. | 12.33 | 2.3 | 265.6 | 134.8 | 312.7 |
| GZT | Gazit-Globe Ltd. | 8.05 | 5.2 | 1,515.0 | 33.8 | 176.6 |
| HASI | Hannon Armstrong Sustainable Infrastructure Capital, Inc. | 29.51 | 4.5 | 1,938.5 | 33.7 | 152.4 |
| HBAN | Huntington Bancshares, Inc. | 14.46 | 5.0 | 14,933.7 | 11.2 | 55.7 |
| HBNC | Horizon Bancorp, Inc. (Indiana) | 18.32 | 2.4 | 823.8 | 12.7 | 30.4 |
| HCAP | Harvest Capital Credit Corp. | 9.78 | 10.3 | 59.4 | 26.8 | 275.8 |
| HCC | Warrior Met Coal, Inc. | 22.65 | 20.3 | 1,185.1 | 1.8 | 36.2 |
| HCFT | Hunt Companies Finance Trust, Inc. | 3.32 | 8.4 | 78.6 | 35.5 | 299.1 |
| HFBC | HopFed Bancorp, Inc. | 19.53 | 1.5 | 129.9 | 23.5 | 36.1 |
| HIFR | InfraREIT, Inc. | 21.11 | 3.6 | 928.9 | 14.9 | 53.1 |
| HIFS | Hingham Institution for Savings | 189.55 | 1.1 | 403.5 | 12.5 | 13.5 |
| HIG | The Hartford Financial Services Group, Inc. | 56.81 | 2.6 | 20,541.4 | 12.5 | 33.1 |
| HIHO | Highway Holdings Ltd. | 1.77 | 2.8 | 6.7 | -8.3 | -23.3 |
| HPE | Hewlett-Packard Enterprise Co. | 16.46 | 3.5 | 21,490.2 | -158.7 | -549.7 |
| HPQ | HP, Inc. | 17.60 | 3.6 | 26,081.6 | 6.4 | 23.4 |
| HRB | H&R Block, Inc. | 24.91 | 4.1 | 4,999.9 | 11.8 | 48.3 |
| HRTG | Heritage Insurance Holdings, Inc. | 13.64 | 1.8 | 407.2 | 21.2 | 37.3 |
| HSBC | HSBC Holdings Plc | 37.97 | 6.7 | 153,856.7 | 10.9 | 73.0 |
| HST | Host Hotels & Resorts, Inc. | 16.61 | 5.1 | 12,123.7 | 11.2 | 57.3 |
| HT | Hersha Hospitality Trust | 14.01 | 8.0 | 550.2 | -26.1 | -208.6 |
| HTA | Healthcare Trust of America, Inc. | 30.55 | 8.2 | 12,655.4 | 171.8 | 1,408.9 |
| HTLD | Heartland Express, Inc. | 22.32 | 0.4 | 1,829.7 | 22.5 | 8.1 |
| HUM | Humana, Inc. | 295.84 | 0.9 | 39,964.7 | 16.1 | 14.7 |
| HURC | Hurco Cos., Inc. | 34.55 | 1.4 | 233.8 | 9.9 | 13.5 |
| HWBK | Hawthorn Bancshares, Inc. | 23.48 | 1.9 | 147.4 | 10.6 | 19.9 |
| HWKN | Hawkins, Inc. | 41.09 | 2.2 | 438.2 | 17.4 | 38.8 |
| IBKC | IBERIABANK Corp. | 75.72 | 2.3 | 3,987.1 | 9.7 | 22.1 |
| IBOC | International Bancshares Corp. | 41.48 | 2.5 | 2,723.5 | 12.9 | 32.7 |
| IFF | International Flavors & Fragrances, Inc. | 122.23 | 2.4 | 13,051.1 | 35.4 | 85.2 |
| IGT | International Game Technology Plc | 13.47 | 5.9 | 2,753.7 | -79.9 | -474.8 |
| IMKTA | Ingles Markets, Inc. | 39.77 | 1.6 | 567.8 | 9.9 | 16.3 |
| IMO | Imperial Oil Ltd. | 25.13 | 5.7 | 19,305.8 | 8.4 | 47.5 |
| INBK | First Internet Bancorp | 22.86 | 1.0 | 227.7 | 10.7 | 11.2 |
| INDB | Independent Bank Corp. (Massachusetts) | 84.40 | 2.0 | 2,900.6 | 17.8 | 35.9 |
| INGR | Ingredion, Inc. | 81.35 | 3.1 | 5,428.4 | 14.1 | 43.4 |
| INT | World Fuel Services Corp. | 39.87 | 0.8 | 2,606.8 | 18.8 | 15.1 |
| INTU | Intuit, Inc. | 258.49 | 0.8 | 67,226.5 | 43.1 | 32.4 |
| IPAR | Inter Parfums, Inc. | 75.57 | 1.5 | 2,376.8 | 40.8 | 59.3 |
| IRET | Investors Real Estate Trust | 75.65 | 3.7 | 972.0 | ||
| IRM | Iron Mountain, Inc. | 33.83 | 7.2 | 9,712.8 | 33.2 | 239.8 |
| IROQ | IF Bancorp, Inc. | 20.80 | 1.3 | 68.1 | 20.3 | 26.8 |
| IRT | Independence Realty Trust, Inc. | 15.15 | 4.8 | 1,379.7 | 37.2 | 176.8 |
| ISTR | Investar Holding Corp. | 24.97 | 0.9 | 248.0 | 14.7 | 12.8 |
| ITRN | Ituran Location & Control Ltd. | 24.77 | 3.8 | 522.1 | 9.2 | 34.7 |
| ITT | ITT, Inc. | 61.12 | 1.2 | 5,378.6 | 17.8 | 21.0 |
| ITUB | Itaú Unibanco Holding SA | 8.90 | 8.2 | 43,638.9 | 12.8 | 105.2 |
| ITW | Illinois Tool Works, Inc. | 172.43 | 4.8 | 55,777.3 | 22.6 | 109.4 |
| IVC | Invacare Corp. | 7.73 | 0.6 | 260.3 | -6.5 | -4.2 |
| IVR | Invesco Mortgage Capital, Inc. | 15.75 | 11.2 | 2,249.1 | -15.6 | -175.2 |
| JCAP | Jernigan Capital, Inc. | 18.85 | 7.4 | 419.2 | 8.4 | 62.2 |
| JCI | Johnson Controls International Plc | 43.36 | 2.4 | 34,501.9 | 68.6 | 164.6 |
| JCS | Communications Systems, Inc. | 4.55 | 1.8 | 42.4 | 61.9 | 108.8 |
| JJSF | J&J Snack Foods Corp. | 193.06 | 1.0 | 3,637.4 | 39.4 | 40.8 |
| JMP | JMP Group LLC | 3.32 | 6.6 | 64.2 | -94.6 | -626.8 |
| JOUT | Johnson Outdoors, Inc. | 60.63 | 1.0 | 598.6 | 14.1 | 14.0 |
| JPM | JPMorgan Chase & Co. | 126.43 | 2.6 | 404,258.7 | 12.4 | 32.5 |
| KAMN | Kaman Corp. | 59.31 | 1.3 | 1,653.5 | 31.5 | 42.5 |
| KAR | KAR Auction Services, Inc. | 26.52 | 4.7 | 3,539.8 | 12.7 | 59.6 |
| KBAL | Kimball International, Inc. | 20.76 | 2.0 | 766.8 | 19.4 | 39.3 |
| KBR | KBR, Inc. | 28.10 | 1.5 | 3,697.4 | 21.0 | 32.1 |
| KDP | Keurig Dr Pepper, Inc. | 27.64 | 2.2 | 38,882.6 | 40.3 | 87.4 |
| KIM | Kimco Realty Corp. | 21.12 | 6.6 | 8,917.5 | 28.2 | 186.6 |
| KMB | Kimberly-Clark Corp. | 132.94 | 3.1 | 45,572.6 | 22.6 | 69.7 |
| KO | The Coca-Cola Co. | 53.41 | 3.7 | 228,834.6 | 29.5 | 110.0 |
| KRC | Kilroy Realty Corp. | 82.66 | 2.3 | 8,345.7 | 29.8 | 67.8 |
| KRG | Kite Realty Group Trust | 17.53 | 7.2 | 1,472.2 | -62.9 | -455.4 |
| KS | KapStone Paper and Packaging Corporation | 0.00 | 0.0 | 0.0 | ||
| KSU | Kansas City Southern | 143.63 | 1.0 | 14,236.6 | 25.1 | 25.2 |
| KW | Kennedy-Wilson Holdings, Inc. | 22.89 | 3.7 | 3,262.6 | 36.6 | 134.1 |
| KWR | Quaker Chemical Corp. | 157.01 | 1.0 | 2,773.9 | 36.8 | 35.4 |
| LADR | Ladder Capital Corp. | 17.10 | 9.3 | 2,047.4 | 11.8 | 110.0 |
| LAND | Gladstone Land Corp. | 11.84 | 5.3 | 246.4 | ||
| LECO | Lincoln Electric Holdings, Inc. | 94.32 | 2.5 | 5,827.0 | 19.0 | 47.8 |
| LEG | Leggett & Platt, Inc. | 51.57 | 3.0 | 6,779.9 | 23.1 | 70.0 |
| LHO | LaSalle Hotel Properties | 0.00 | 0.0 | 0.0 | ||
| LII | Lennox International, Inc. | 249.06 | 1.1 | 9,565.6 | 27.2 | 30.9 |
| LM | Legg Mason, Inc. | 36.64 | 4.0 | 3,178.4 | -55.5 | -224.3 |
| LMAT | LeMaitre Vascular, Inc. | 35.89 | 1.1 | 707.9 | 36.5 | 42.0 |
| LMNR | Limoneira Co. | 19.51 | 1.5 | 346.4 | -51.0 | -78.6 |
| LOAN | Manhattan Bridge Capital, Inc. | 6.15 | 9.8 | 59.4 | 13.4 | 130.5 |
| LPT | Liberty Property Trust | 58.30 | 2.8 | 9,189.6 | 20.4 | 56.9 |
| LSI | Life Storage, Inc. | 103.90 | 3.8 | 4,846.9 | 23.2 | 89.3 |
| LTC | LTC Properties, Inc. | 51.26 | 5.2 | 2,037.7 | 19.1 | 99.1 |
| LXP | Lexington Realty Trust | 10.80 | 4.5 | 2,675.8 | 8.9 | 39.8 |
| M | Macy's, Inc. | 15.27 | 19.8 | 4,717.1 | 4.6 | 91.0 |
| MAA | Mid-America Apartment Communities, Inc. | 135.42 | 2.8 | 15,443.8 | 65.4 | 185.3 |
| MAIN | Main Street Capital Corp. | 43.22 | 7.8 | 2,728.7 | 16.9 | 131.7 |
| MCK | McKesson Corp. | 149.40 | 1.3 | 27,624.7 | 49.5 | 65.9 |
| MDLZ | Mondelez International, Inc. | 52.83 | 2.0 | 76,188.8 | 20.7 | 41.8 |
| MDT | Medtronic Plc | 107.55 | 1.9 | 144,296.6 | 32.6 | 63.1 |
| MDU | MDU Resources Group, Inc. | 28.05 | 2.2 | 5,583.6 | 19.1 | 41.3 |
| MEI | Methode Electronics, Inc. | 34.40 | 1.3 | 1,275.2 | 13.4 | 17.1 |
| MERC | Mercer International, Inc. | 12.29 | 4.3 | 806.6 | 5.4 | 23.2 |
| MFA | MFA Financial, Inc. | 7.56 | 10.6 | 3,406.2 | 10.7 | 113.4 |
| MFNC | Mackinac Financial Corp. | 15.82 | 3.2 | 169.9 | 12.8 | 40.4 |
| MGP | MGM Growth Properties LLC | 30.99 | 6.0 | 2,875.8 | 30.6 | 182.4 |
| MGRC | McGrath RentCorp | 71.06 | 2.1 | 1,723.4 | 19.7 | 40.7 |
| MHLD | Maiden Holdings Ltd. | 0.60 | 8.4 | 49.5 | -0.1 | -0.9 |
| MITT | AG Mortgage Investment Trust, Inc. | 15.33 | 12.7 | 501.8 | 26.9 | 342.5 |
| MKC | McCormick & Co., Inc. | 162.42 | 1.4 | 21,587.6 | 30.6 | 42.9 |
| MLHR | Herman Miller, Inc. | 47.40 | 3.5 | 2,799.3 | 16.2 | 56.0 |
| MO | Altria Group, Inc. | 46.38 | 7.0 | 86,642.5 | 13.8 | 96.1 |
| MORN | Morningstar, Inc. | 152.16 | 0.7 | 6,550.0 | 39.0 | 28.5 |
| MOV | Movado Group, Inc. | 26.25 | 3.0 | 603.7 | 9.2 | 28.1 |
| MPW | Medical Properties Trust, Inc. | 20.51 | 4.9 | 9,153.5 | 7.8 | 38.5 |
| MPWR | Monolithic Power Systems, Inc. | 153.00 | 1.0 | 6,614.3 | 63.1 | 62.1 |
| MRK | Merck & Co., Inc. | 85.10 | 2.6 | 217,888.3 | 23.7 | 61.2 |
| MRVL | Marvell Technology Group Ltd. | 24.78 | 1.0 | 16,481.6 | -38.8 | -37.7 |
| MSI | Motorola Solutions, Inc. | 164.75 | 1.4 | 27,440.1 | 26.2 | 36.3 |
| MSL | MidSouth Bancorp, Inc. (Louisiana) | 11.44 | 0.3 | 191.4 | -4.9 | -1.3 |
| MTGE | MTGE Investment Corp. | 0.00 | 0.0 | 0.0 | ||
| MTN | Vail Resorts, Inc. | 232.40 | 2.9 | 9,401.1 | 31.0 | 90.0 |
| MTR | Mesa Royalty Trust | 8.20 | 13.6 | 15.3 | 6.8 | 92.5 |
| MTSC | MTS Systems Corp. | 57.43 | 2.1 | 1,110.4 | 22.6 | 47.1 |
| MVC | MVC Capital, Inc. | 8.79 | 7.1 | 155.8 | 13.9 | 98.3 |
| MVO | MV Oil Trust | 6.79 | 15.5 | 78.1 | 5.0 | 76.9 |
| MYE | Myers Industries, Inc. | 17.16 | 3.1 | 609.1 | -109.7 | -345.3 |
| NBR | Nabors Industries Ltd. | 2.02 | 5.0 | 650.6 | -1.1 | -5.6 |
| NDRO | Enduro Royalty Trust | 0.00 | 0.0 | 0.0 | ||
| NEU | NewMarket Corp. | 485.51 | 1.9 | 5,432.4 | 20.4 | 37.9 |
| NFG | National Fuel Gas Co. | 45.99 | 3.7 | 3,969.6 | 13.4 | 50.2 |
| NGHC | National General Holdings Corp. | 22.53 | 0.8 | 2,550.8 | 10.9 | 8.2 |
| NJR | New Jersey Resources Corp. | 43.86 | 2.7 | 3,946.5 | 28.8 | 78.1 |
| NKE | NIKE, Inc. | 89.28 | 1.0 | 139,368.8 | 32.5 | 32.1 |
| NLY | Annaly Capital Management, Inc. | 8.94 | 12.3 | 13,019.0 | -2.7 | -33.1 |
| NOA | North American Construction Group Ltd. | 12.14 | 0.9 | 304.4 | 16.1 | 14.5 |
| NRZ | New Residential Investment Corp. | 15.80 | 12.7 | 6,565.2 | 18.8 | 238.2 |
| NTAP | NetApp, Inc. | 55.47 | 3.2 | 13,197.0 | 13.9 | 44.3 |
| NTP | Nam Tai Property, Inc. | 9.04 | 0.8 | 345.3 | -22.9 | -17.8 |
| NTRS | Northern Trust Corp. | 102.35 | 3.1 | 21,686.1 | 15.1 | 46.6 |
| NVO | Novo Nordisk A/S | 54.97 | 2.3 | 98,421.4 | 22.9 | 51.6 |
| NVS | Novartis AG | 87.10 | 3.2 | 202,228.9 | 17.6 | 56.6 |
| NWS | News Corp. | 14.33 | 1.4 | 8,427.8 | 54.0 | 75.4 |
| NWSA | News Corp. | 13.96 | 1.4 | 8,210.2 | 52.6 | 75.4 |
| NYMT | New York Mortgage Trust, Inc. | 6.21 | 12.9 | 1,630.9 | 11.5 | 148.8 |
| NYT | The New York Times Co. | 31.25 | 0.6 | 5,236.0 | 38.1 | 23.0 |
| O | Realty Income Corp. | 80.85 | 3.6 | 25,728.7 | 61.7 | 223.2 |
| OBCI | Ocean Bio-Chem, Inc. | 3.39 | 1.5 | 31.8 | 11.0 | 16.2 |
| OC | Owens Corning | 61.79 | 1.4 | 6,752.4 | 13.4 | 19.0 |
| OFC | Corporate Office Properties Trust, Inc. | 29.26 | 3.8 | 3,275.7 | 19.6 | 73.9 |
| OFG | OFG Bancorp | 21.51 | 1.6 | 1,104.5 | 14.9 | 24.3 |
| OGE | OGE Energy Corp. | 42.86 | 3.5 | 8,579.5 | 21.0 | 72.8 |
| OHAI | OHA Investment Corp. | 1.28 | 6.3 | 25.8 | -2.3 | -14.6 |
| OLP | One Liberty Properties, Inc. | 28.18 | 6.4 | 560.3 | 30.9 | 197.4 |
| OMC | Omnicom Group, Inc. | 77.19 | 3.3 | 16,806.7 | 12.9 | 42.7 |
| ORC | Orchid Island Capital, Inc. | 5.63 | 18.5 | 355.0 | -15.5 | -285.4 |
| ORM | Owens Realty Mortgage, Inc. | 21.75 | 3.5 | 184.5 | 27.6 | 96.5 |
| OXY | Occidental Petroleum Corp. | 42.33 | 7.4 | 37,863.3 | 8.4 | 61.8 |
| OZK | Bank OZK | 29.45 | 3.2 | 3,787.3 | 8.6 | 27.5 |
| PB | Prosperity Bancshares, Inc. | 73.06 | 2.9 | 4,997.1 | 15.4 | 44.3 |
| PBA | Pembina Pipeline Corp. | 35.28 | 6.6 | 18,045.7 | 15.4 | 101.8 |
| PBT | Permian Basin Royalty Trust | 4.14 | 14.0 | 193.0 | 8.4 | 117.6 |
| PDCO | Patterson Cos., Inc. | 17.44 | 6.0 | 1,666.4 | 13.8 | 82.4 |
| PEB | Pebblebrook Hotel Trust | 25.89 | 5.9 | 3,382.1 | -42.5 | -249.3 |
| PEGA | Pegasystems, Inc. | 75.01 | 0.2 | 5,935.7 | -113.3 | -18.1 |
| PEGI | Pattern Energy Group, Inc. | 27.72 | 6.1 | 2,730.1 | -43.3 | -263.5 |
| PF | Pinnacle Foods Inc. | 0.00 | 0.0 | 0.0 | ||
| PFBC | Preferred Bank (California) | 52.85 | 2.3 | 814.4 | 10.4 | 23.6 |
| PFLT | PennantPark Floating Rate Capital Ltd. | 11.48 | 9.9 | 445.1 | 29.6 | 293.6 |
| PGRE | Paramount Group, Inc. | 13.38 | 3.0 | 3,132.4 | 65.4 | 195.5 |
| PHM | PulteGroup, Inc. | 39.00 | 1.1 | 10,569.0 | 11.9 | 13.4 |
| PK | Park Hotels & Resorts, Inc. | 23.71 | 9.9 | 5,690.4 | 16.9 | 167.2 |
| PKBK | Parke Bancorp, Inc. | 24.14 | 2.5 | 260.0 | 8.9 | 22.0 |
| PKG | Packaging Corporation of America | 111.58 | 2.8 | 10,562.5 | 13.8 | 39.1 |
| PLCE | The Children's Place, Inc. | 81.82 | 2.7 | 1,267.0 | 19.6 | 52.6 |
| PLPC | Preformed Line Products Co. | 55.61 | 1.4 | 279.7 | 11.6 | 16.7 |
| PM | Philip Morris International, Inc. | 81.85 | 5.6 | 127,348.8 | 17.0 | 95.6 |
| PMT | PennyMac Mortgage Investment Trust | 22.76 | 8.3 | 1,998.5 | 9.0 | 74.7 |
| POL | PolyOne Corp. | 32.76 | 3.0 | 2,519.7 | 18.8 | 56.4 |
| POR | Portland General Electric Co. | 56.20 | 2.7 | 5,022.7 | 25.1 | 66.9 |
| PPL | PPL Corp. | 32.97 | 5.0 | 23,812.5 | 13.4 | 66.8 |
| PRA | ProAssurance Corp. | 39.78 | 4.4 | 2,138.6 | 42.7 | 187.0 |
| PRIM | Primoris Services Corp. | 21.22 | 1.1 | 1,081.8 | 12.8 | 14.5 |
| PXD | Pioneer Natural Resources Co. | 127.12 | 0.6 | 21,247.3 | 23.9 | 14.3 |
| QCRH | QCR Holdings, Inc. | 41.42 | 0.6 | 654.0 | 11.9 | 6.9 |
| QSR | Restaurant Brands International, Inc. | 64.62 | 6.1 | 31,669.1 | ||
| QTS | QTS Realty Trust, Inc. | 54.34 | 3.2 | 3,012.1 | -630.4 | -2,007.0 |
| RAVN | Raven Industries, Inc. | 34.43 | 1.5 | 1,237.0 | 32.7 | 49.4 |
| RBC | Regal Beloit Corp. | 75.80 | 1.9 | 3,178.7 | 12.5 | 24.2 |
| RBCAA | Republic Bancorp, Inc. (Kentucky) | 44.31 | 2.3 | 928.4 | 11.9 | 27.8 |
| RCI | Rogers Communications, Inc. | 46.20 | 6.4 | 23,957.4 | 15.1 | 96.1 |
| RCL | Royal Caribbean Cruises Ltd. | 113.27 | 2.5 | 23,737.0 | 12.8 | 32.6 |
| RESI | Front Yard Residential Corp. | 12.19 | 4.9 | 656.1 | -5.2 | -25.6 |
| REXR | Rexford Industrial Realty, Inc. | 48.04 | 1.5 | 5,272.4 | 119.1 | 177.2 |
| RF | Regions Financial Corp. | 16.47 | 4.4 | 15,877.1 | 10.9 | 48.3 |
| RFIL | RF Industries Ltd. | 5.97 | 1.3 | 56.1 | 17.4 | 23.4 |
| RGLD | Royal Gold, Inc. | 120.89 | 0.9 | 7,929.4 | 84.3 | 73.9 |
| RHP | Ryman Hospitality Properties, Inc. | 84.83 | 4.2 | 4,363.9 | 16.7 | 70.0 |
| RILY | B. Riley Financial, Inc. | 24.37 | 4.1 | 657.1 | 26.5 | 108.6 |
| RIO | Rio Tinto Plc | 53.37 | 11.9 | 67,226.4 | 6.7 | 80.1 |
| RJF | Raymond James Financial, Inc. | 84.85 | 1.6 | 11,692.3 | 11.6 | 18.5 |
| RL | Ralph Lauren Corp. | 96.10 | 2.7 | 7,422.8 | 17.5 | 47.8 |
| RLJ | RLJ Lodging Trust | 16.61 | 7.9 | 2,859.1 | 21.3 | 169.2 |
| ROP | Roper Technologies, Inc. | 341.84 | 0.5 | 35,552.0 | 30.7 | 16.6 |
| ROYT | Pacific Coast Oil Trust | 1.31 | 19.5 | 50.5 | 4.0 | 78.0 |
| RPAI | Retail Properties of America, Inc. | 13.48 | 6.1 | 2,880.1 | 43.5 | 267.4 |
| RPM | RPM International, Inc. | 73.02 | 1.9 | 9,469.2 | 31.4 | 60.6 |
| RPT | RPT Realty | 14.10 | 6.2 | 1,130.2 | 95.3 | 594.6 |
| RSG | Republic Services, Inc. | 87.89 | 2.2 | 28,190.8 | 27.1 | 59.6 |
| RVSB | Riverview Bancorp, Inc. | 7.46 | 2.3 | 169.5 | 9.7 | 22.2 |
| SAH | Sonic Automotive, Inc. | 33.91 | 1.4 | 1,462.7 | 12.1 | 16.4 |
| SAIC | Science Applications International Corp. | 81.97 | 1.7 | 4,851.0 | 28.9 | 50.1 |
| SBR | Sabine Royalty Trust | 38.56 | 9.4 | 562.2 | 11.2 | 104.9 |
| SCG | SCANA Corporation | 0.00 | 0.0 | 0.0 | ||
| SCS | Steelcase, Inc. | 17.82 | 3.2 | 2,086.9 | 15.5 | 49.4 |
| SCVL | Shoe Carnival, Inc. | 34.53 | 1.0 | 506.6 | 13.1 | 12.5 |
| SFBS | ServisFirst Bancshares, Inc. | 35.22 | 2.2 | 1,887.1 | 13.0 | 28.7 |
| SFNC | Simmons First National Corp. | 24.51 | 3.2 | 2,393.1 | 9.6 | 30.7 |
| SHO | Sunstone Hotel Investors, Inc. | 13.49 | 5.1 | 3,046.9 | 14.5 | 73.6 |
| SHPG | Shire plc | 0.00 | 0.0 | 0.0 | ||
| SJI | South Jersey Industries, Inc. | 31.94 | 3.6 | 2,950.9 | 40.2 | 144.6 |
| SJR | Shaw Communications, Inc. | 19.99 | 7.9 | 10,331.3 | 18.6 | 147.3 |
| SJT | San Juan Basin Royalty Trust | 2.55 | 12.1 | 118.9 | 6.9 | 83.6 |
| SKYW | Sky West, Inc. | 58.99 | 0.8 | 3,007.3 | 9.3 | 7.3 |
| SLB | Schlumberger NV | 34.79 | 7.2 | 48,162.9 | -4.9 | -34.9 |
| SLCA | U.S. Silica Holdings, Inc. | 4.92 | 5.1 | 359.1 | -1.4 | -7.1 |
| SLD | Sutherland Asset Management Corporation | 0.00 | 0.0 | 0.0 | ||
| SLG | SL Green Realty Corp. | 81.13 | 4.2 | 6,958.8 | 38.0 | 159.2 |
| SNHY | 0.00 | 0.0 | 0.0 | |||
| SNV | Synovus Financial Corp. | 34.50 | 3.3 | 5,149.6 | 10.1 | 33.3 |
| SNX | SYNNEX Corp. | 118.84 | 1.3 | 6,112.7 | 13.6 | 17.0 |
| SOHO | Sotherly Hotels, Inc. | 6.47 | 15.9 | 92.0 | -9.5 | -151.6 |
| SPR | Spirit AeroSystems Holdings, Inc. | 78.08 | 0.8 | 8,075.5 | 12.0 | 9.2 |
| SR | Spire, Inc. (Missouri) | 83.44 | 2.8 | 4,239.5 | 22.1 | 62.8 |
| SRC | Spirit Realty Capital, Inc. | 49.10 | 5.1 | 4,424.3 | 26.0 | 132.3 |
| SRE | Sempra Energy | 141.20 | 2.7 | 38,766.6 | 20.0 | 53.9 |
| SRG | Seritage Growth Properties | 43.74 | 1.1 | 1,665.4 | -14.4 | -16.5 |
| SSD | Simpson Manufacturing Co., Inc. | 81.90 | 2.2 | 3,653.1 | 30.1 | 67.1 |
| SSW | Seaspan Corp. | 11.38 | 4.3 | 2,496.9 | 5.7 | 24.5 |
| STAG | STAG Industrial, Inc. | 30.96 | 6.9 | 4,239.3 | ||
| STLD | Steel Dynamics, Inc. | 30.37 | 2.9 | 6,777.3 | 8.3 | 24.4 |
| STN | Stantec, Inc. | 21.34 | 2.7 | 2,388.1 | 41.0 | 109.9 |
| STOR | STORE Capital Corp. | 39.29 | 3.4 | 9,075.1 | 39.7 | 135.2 |
| STT | State Street Corp. | 67.21 | 2.9 | 24,439.1 | 13.1 | 37.7 |
| STWD | Starwood Property Trust, Inc. | 24.52 | 7.8 | 6,902.0 | 18.2 | 142.3 |
| STX | Seagate Technology Plc | 57.97 | 4.3 | 15,312.5 | 8.1 | 35.1 |
| SUI | Sun Communities, Inc. | 158.85 | 1.9 | 14,405.8 | 99.9 | 186.2 |
| SUP | Superior Industries International, Inc. | 2.76 | 9.5 | 71.1 | -94.5 | -901.8 |
| SYBT | Stock Yards Bancorp, Inc. | 39.89 | 2.6 | 901.4 | 14.1 | 36.0 |
| SYK | Stryker Corp. | 220.53 | 0.9 | 82,280.8 | 23.2 | 21.9 |
| SYY | Sysco Corp. | 79.11 | 2.0 | 40,504.9 | 24.3 | 48.0 |
| TAC | TransAlta Corp. | 5.86 | 5.5 | 1,654.3 | -8.1 | -44.1 |
| TCFC | The Community Financial Corp. (Maryland) | 33.38 | 1.5 | 186.4 | 12.4 | 18.5 |
| TD | The Toronto-Dominion Bank | 57.34 | 5.0 | 104,053.1 | 12.0 | 60.6 |
| TG | Tredegar Corp. | 20.35 | 2.2 | 678.7 | 25.8 | 57.0 |
| TGNA | TEGNA, Inc. | 15.86 | 2.2 | 3,447.0 | 8.3 | 18.3 |
| THO | Thor Industries, Inc. | 66.70 | 2.4 | 3,672.7 | 27.5 | 64.7 |
| TIF | Tiffany & Co. | 126.80 | 1.8 | 15,317.3 | 27.4 | 48.9 |
| TIPT | Tiptree, Inc. | 7.28 | 2.1 | 251.5 | 55.3 | 113.9 |
| TMO | Thermo Fisher Scientific, Inc. | 297.95 | 0.2 | 119,321.8 | 33.3 | 8.3 |
| TOL | Toll Brothers, Inc. | 39.54 | 1.1 | 5,569.4 | 8.3 | 9.2 |
| TOT | Total SA | 52.68 | 5.5 | 137,069.6 | 12.5 | 68.9 |
| TOWN | TowneBank | 28.48 | 2.4 | 2,052.3 | 14.7 | 35.1 |
| TPR | Tapestry, Inc. | 25.87 | 5.2 | 7,446.2 | 11.6 | 60.7 |
| TPVG | TriplePoint Venture Growth BDC Corp. | 16.58 | 8.7 | 412.2 | 7.2 | 62.9 |
| TRN | Trinity Industries, Inc. | 19.56 | 3.2 | 2,423.0 | 17.8 | 57.8 |
| TRNO | Terreno Realty Corp. | 55.05 | 1.8 | 3,601.6 | 57.0 | 102.7 |
| TRP | TC Energy Corp. | 50.24 | 10.2 | 46,886.6 | 14.7 | 150.0 |
| TRST | TrustCo Bank Corp. NY | 8.62 | 3.2 | 835.4 | 13.9 | 44.0 |
| TRTX | TPG RE Finance Trust, Inc. | 20.33 | 8.5 | 1,506.2 | 12.1 | 102.0 |
| TSE | Trinseo SA | 45.46 | 3.5 | 1,785.7 | 13.8 | 48.7 |
| TSLX | TPG Specialty Lending, Inc. | 21.27 | 8.4 | 1,409.6 | 10.1 | 84.5 |
| TSS | Total System Services, Inc. | 133.27 | 0.4 | 23,587.2 | 38.9 | 15.2 |
| TTC | The Toro Co. | 76.74 | 1.2 | 8,180.6 | 29.8 | 34.9 |
| TTEC | TTEC Holdings, Inc. | 48.30 | 1.3 | 2,245.1 | 39.5 | 50.7 |
| TU | TELUS Corp. | 35.35 | 6.3 | 21,262.6 | 16.1 | 100.8 |
| TUP | Tupperware Brands Corp. | 15.54 | 9.6 | 758.2 | 5.7 | 54.9 |
| TWI | Titan International, Inc. | 2.85 | 0.7 | 171.5 | -8.1 | -5.7 |
| TWO | Two Harbors Investment Corp. | 13.88 | 12.5 | 3,787.9 | -4.9 | -61.8 |
| TXT | Textron, Inc. | 47.11 | 0.2 | 10,753.5 | 12.8 | 2.7 |
| TYPE | Monotype Imaging Holdings, Inc. | 19.84 | 1.8 | 833.3 | 31.9 | 56.0 |
| UBA | Urstadt Biddle Properties, Inc. | 24.23 | 4.5 | 965.7 | 38.6 | 175.2 |
| UBFO | United Security Bancshares (California) | 10.25 | 4.3 | 173.8 | 10.7 | 45.9 |
| UBP | Urstadt Biddle Properties, Inc. | 18.70 | 5.2 | 745.3 | 30.5 | 160.0 |
| UBSI | United Bankshares, Inc. (West Virginia) | 40.35 | 3.4 | 4,097.8 | 15.8 | 53.3 |
| UCBI | United Community Banks, Inc. | 30.99 | 2.1 | 2,447.4 | 13.7 | 29.2 |
| UDR | UDR, Inc. | 49.18 | 2.7 | 23,448.8 | 85.7 | 235.2 |
| UFS | Domtar Corp. | 37.13 | 4.8 | 2,323.7 | 11.4 | 54.5 |
| UGI | UGI Corp. | 47.40 | 2.4 | 9,904.7 | 24.9 | 60.2 |
| UHAL | AMERCO | 409.30 | 0.4 | 8,025.6 | 21.4 | 7.8 |
| UHT | Universal Health Realty Income Trust | 117.84 | 2.3 | 1,621.1 | 92.2 | 212.1 |
| UMBF | UMB Financial Corp. | 67.43 | 1.8 | 3,308.7 | 16.7 | 29.7 |
| UMPQ | Umpqua Holdings Corp. | 16.30 | 5.2 | 3,589.5 | 10.3 | 52.9 |
| UNIT | Uniti Group, Inc. | 7.48 | 9.9 | 1,462.1 | 25.5 | 252.9 |
| USB | U.S. Bancorp | 57.34 | 2.7 | 90,081.1 | 13.2 | 35.1 |
| USPH | U.S. Physical Therapy, Inc. | 143.75 | 0.7 | 1,836.3 | 79.5 | 59.2 |
| UTMD | Utah Medical Products, Inc. | 98.26 | 1.1 | 370.5 | ||
| UVSP | Univest Financial Corp. | 25.93 | 3.1 | 760.1 | 11.1 | 34.2 |
| VCOYY | Viña Concha y Toro S.A. | 0.00 | 0.0 | 0.0 | ||
| VER | VEREIT, Inc. | 9.76 | 5.6 | 10,420.7 | 39.9 | 225.0 |
| VET | Vermilion Energy, Inc. | 15.34 | 24.0 | 2,380.2 | 8.9 | 212.4 |
| VIA | Viacom, Inc. | 23.83 | 3.4 | 9,612.9 | 5.9 | 19.7 |
| VIAB | Viacom, Inc. | 21.66 | 3.7 | 8,737.6 | 5.3 | 19.7 |
| VLGEA | Village Super Market, Inc. | 25.76 | 3.9 | 370.5 | 13.1 | 50.7 |
| VLY | Valley National Bancorp | 11.84 | 3.7 | 3,958.4 | 11.8 | 43.4 |
| VMI | Valmont Industries, Inc. | 138.25 | 1.1 | 2,990.7 | 22.2 | 24.0 |
| VTR | Ventas, Inc. | 63.92 | 5.0 | 23,815.6 | 47.8 | 236.9 |
| VVI | Viad Corp. | 60.90 | 0.7 | 1,237.0 | 50.8 | 33.4 |
| WASH | Washington Trust Bancorp, Inc. | 51.32 | 3.8 | 889.8 | 12.6 | 48.1 |
| WDC | Western Digital Corp. | 62.79 | 3.2 | 18,663.8 | -24.3 | -77.2 |
| WDFC | WD-40 Co. | 185.30 | 1.3 | 2,539.4 | 46.0 | 60.6 |
| WGO | Winnebago Industries, Inc. | 48.31 | 0.9 | 1,521.5 | 13.6 | 12.5 |
| WHG | Westwood Holdings Group, Inc. | 28.70 | 10.0 | 256.7 | 18.5 | 185.6 |
| WIRE | Encore Wire Corp. (Delaware) | 56.59 | 0.1 | 1,183.1 | 16.3 | 2.3 |
| WLTW | Willis Towers Watson Plc | 185.65 | 1.4 | 23,947.7 | 28.5 | 39.2 |
| WMC | Western Asset Mortgage Capital Corp. | 9.88 | 12.6 | 525.9 | 10.8 | 135.7 |
| WMT | Walmart, Inc. | 117.15 | 2.3 | 333,207.4 | 26.3 | 59.2 |
| WPC | W.P. Carey, Inc. | 91.60 | 4.5 | 15,644.1 | 32.3 | 145.8 |
| WPM | Wheaton Precious Metals Corp. | 27.13 | 1.3 | 12,049.1 | -463.0 | -616.4 |
| WRB | W.R. Berkley Corp. | 69.63 | 2.2 | 12,789.2 | 19.1 | 41.7 |
| WSBC | WesBanco, Inc. | 38.18 | 3.2 | 2,088.1 | 12.5 | 40.0 |
| WSBF | Waterstone Financial, Inc. | 18.70 | 5.2 | 507.6 | 15.0 | 78.5 |
| WSCI | WSI Industries, Inc. | 0.00 | 0.0 | 0.0 | ||
| WSO | Watsco, Inc. | 176.41 | 3.6 | 6,714.1 | ||
| WSR | Whitestone REIT | 14.21 | 9.4 | 571.7 | 31.2 | 292.1 |
| XAN | Exantas Capital Corp. | 11.60 | 7.3 | 369.7 | 14.4 | 105.4 |
| XEL | Xcel Energy, Inc. | 62.58 | 2.5 | 32,229.4 | 25.0 | 63.7 |
| XHR | Xenia Hotels & Resorts, Inc. | 20.76 | 5.3 | 2,338.4 | 16.9 | 89.7 |
| XL | XL Group Ltd | 0.00 | 0.0 | 0.0 | ||
| XRAY | Dentsply Sirona, Inc. | 54.09 | 0.7 | 12,126.1 | 112.1 | 75.1 |
| XRX | Xerox Holdings Corp. | 34.42 | 1.5 | 7,616.6 | 15.2 | 22.0 |
| YORW | York Water Co. | 43.67 | 1.6 | 566.7 | 40.3 | 64.0 |
| ZBH | Zimmer Biomet Holdings, Inc. | 138.19 | 0.7 | 28,372.5 | -78.5 | -54.5 |
| Ticker | Name | Price | Dividend Yield | Market Cap ($M) | P/E Ratio | Payout Ratio |
Keep reading this article to learn more about how to use our database of stocks that pay dividends in April to find investment ideas.
How To Use The April Dividend Stocks List To Find Investment Ideas
Having an Excel database that contains the name, ticker, and price-to-earnings ratio of every stock that pays a dividend in the month of April can be tremendously useful.
This document becomes even more powerful when combined with a working knowledge of spreadsheet tools like Microsoft Excel.
With this in mind, the following tutorial will demonstrate how to apply to additional investing screens to the stocks within the April dividend stocks database.
The first screen that we’ll demonstrate is for stocks that trade with market capitalizations above $15 billion and betas below 1.
Screen 1: Market Capitalization Above $15 Billion, Beta Below 1
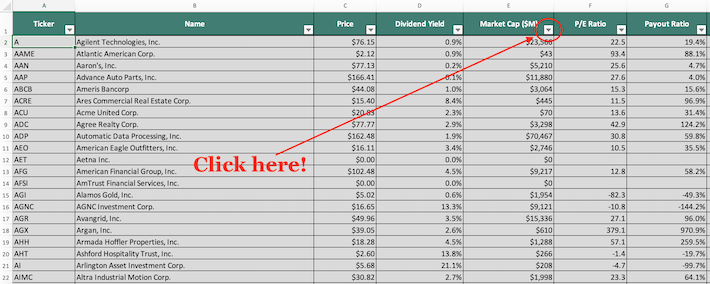
Step 1: Download your free list of stocks that pay dividends in April by clicking here. Apply Excel’s filter function to every column in the spreadsheet.
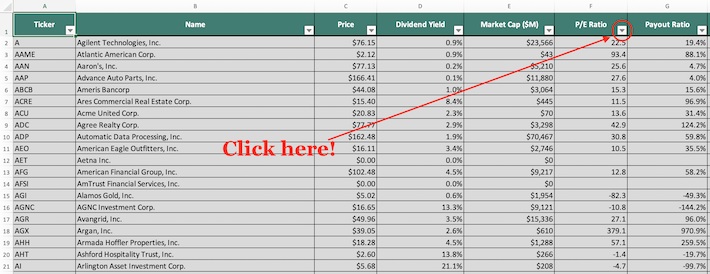
Step 2: Click the filter icon at the top of the market capitalization column, as shown below.
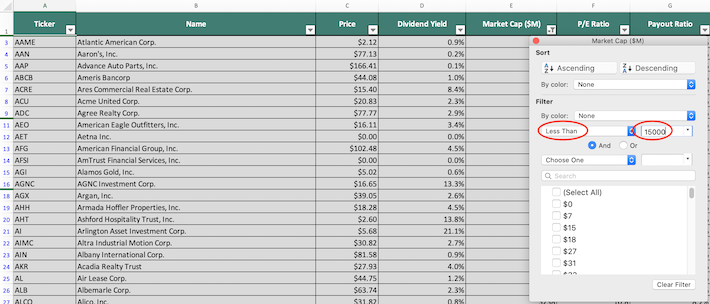
Step 3: Change the filter setting to “Greater Than” and input 15000 into the field beside it, as shown below. Since market capitalization is measured in millions, screening for market capitalizations above “15000” is equivalent for screening for market capitalizations above $15 billion.
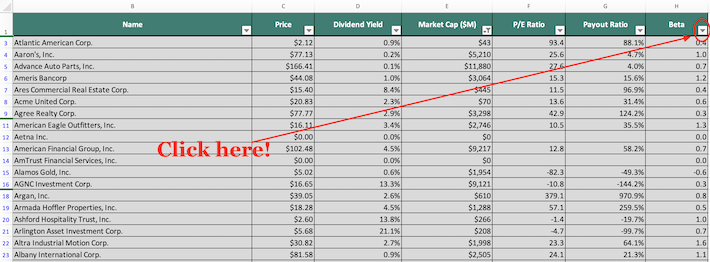
Step 4: Close out of the filter window (by clicking the exit button, not by clicking the “Clear Filter” button in the bottom right corner). Next, click on the filter icon at the top of the beta column, as shown below.
Step 5: Change the filter setting to “Less Than” and input 1 into the field beside it, as shown below. This will filter for April dividend stocks with betas below 1.
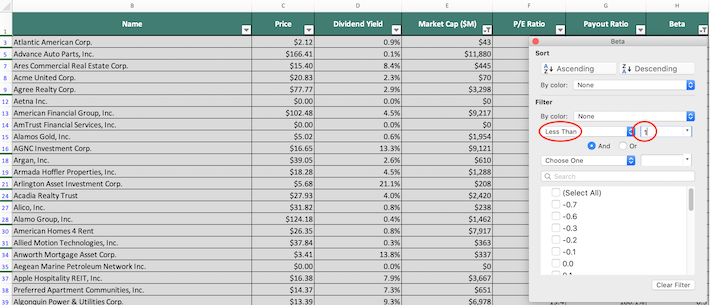
The remaining stocks in this database are stocks that pay dividends in April that have market capitalizations above $15 billion and betas below 1.
The next screen that we’ll demonstrate how to implement is for stocks that pay dividends in April with price-to-earnings ratios below 10 and dividend yields above 5%.
Screen 2: Price-to-Earnings Ratios Below 10, Dividend Yields Above 5%
Step 1: Download your free list of stocks that pay dividends in April by clicking here. Apply Excel’s filter function to every column in the spreadsheet.
Step 2: Click on the filter icon at the top of the price-to-earnings ratio column, as shown below.
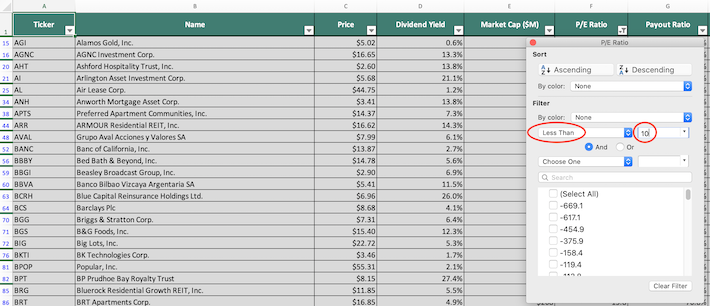
Step 3: Change the filter setting to “Less Than” and input 10 into the field beside it, as shown below. This will filter for stocks that pay dividends in April with price-to-earnings ratios less than 10.
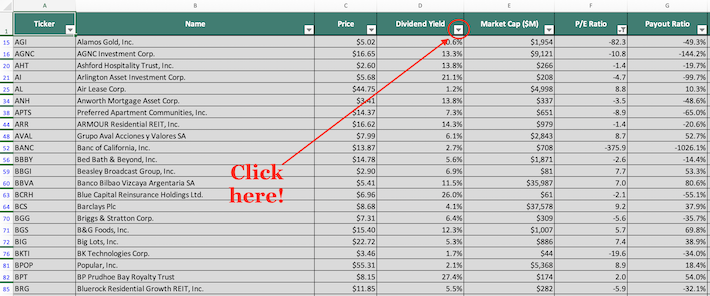
Step 4: Close out of the filter window (by clicking the exit button, not by clicking the “Clear Filter” button in the bottom right corner). Then, click the filter icon at the top of the dividend yield column, as shown below.
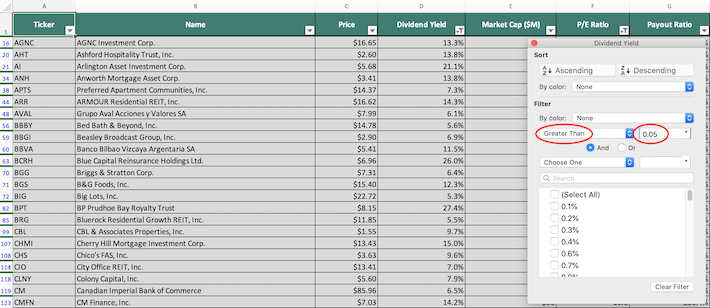
Step 5: Change the filter setting to “Greater Than” and input 0.05 into the field beside it. This will filter for stocks that pay dividends in April with dividend yields above 5%.
The remaining stocks in this spreadsheet are stocks that pay dividends in April with price-to-earnings ratios below 10 and dividend yields above 5%.
You now have a broad understanding of how to harness the power of Microsoft Excel to find investment ideas within our database of stocks that pay dividends in April.
To conclude this article, we’ll share other investment databases that you can use to find compelling dividend investment opportunities.
Final Thoughts: Other Useful Investing Resources
Having an Excel document that contains the name, tickers, and financial information for all stocks that pay dividends in April is quite useful – but it becomes far more useful when combined with other databases for the non-April months of the calendar year.
Fortunately, Sure Dividend also maintains similar databases for the other 11 months of the year. You can access these databases below:
- The Complete List of Stocks That Pay Dividends in January
- The Complete List of Stocks That Pay Dividends in February
- The Complete List of Stocks That Pay Dividends in March
- The Complete List of Stocks That Pay Dividends in May
- The Complete List of Stocks That Pay Dividends in June
- The Complete List of Stocks That Pay Dividends in July
- The Complete List of Stocks That Pay Dividends in August
- The Complete List of Stocks That Pay Dividends in September
- The Complete List of Stocks That Pay Dividends in October
- The Complete List of Stocks That Pay Dividends in November
- The Complete List of Stocks That Pay Dividends in December
Our research at Sure Dividend suggests that stocks with steadily rising dividend payments have outperformed the broader market with less volatility. With that in mind, the following databases of stocks are useful resources for finding investment ideas:
- The Dividend Aristocrats: a group of S&P 500 stocks with 25+ years of consecutive dividend increases.
- The Dividend Achievers: a group of dividend stocks with 10+ years of consecutive dividend increases.
- The Dividend Kings: considered to be the best-of-the-best when it comes to dividend growth stocks, the Dividend Kings are an exclusive group of stocks with 50+ years of consecutive dividend increases.
You may also be looking for stocks with certain dividend characteristics so that you can create a very customized income stream. With this in mind, the following Sure Dividend databases will come in handy:
- The Complete List of Monthly Dividend Stocks: our database of monthly dividend stocks is updated monthly and currently contains more than 40 individual securities.
- The Complete List of High Dividend Stocks With 5%+ Yields: our database of high yield dividend stocks is updated monthly and usually contains more than 250 individual securities.
Individual sectors of the stock market can also be fruitful ground on your hunt for new investment ideas. Sure Dividend provides 10 databases of the stocks in each sector of the stock market. You can access these databases below:
- The Complete List of Dividend-Paying Utility Stocks
- The Complete List of Dividend-Paying Telecommunications Stocks
- The Complete List of Dividend-Paying Technology Stocks
- The Complete List of Dividend-Paying Energy Stocks
- The Complete List of Dividend-Paying Financial Sector Stocks
- The Complete List of Dividend-Paying Healthcare Stocks
- The Complete List of Dividend-Paying Consumer Cyclical Stocks (also called Consumer Discretionary stocks)
- The Complete List of Dividend-Paying Industrial Stocks
- The Complete List of Dividend-Paying Materials Stocks
- The Complete list of Dividend-Paying Consumer Staples Stocks