


Published on October 24th, 2019 by Josh Arnold
Spreadsheet data updated daily, constituents updated quarterly
In the world of investing, volatility matters.
Investors are reminded of this every time there is a downturn in the broader market and individual stocks that are more volatile than others experience enormous swings in price in both directions. That volatility can increase the risk in an individual’s stock portfolio relative to the broader market.
The volatility of a security or portfolio against a benchmark – is called Beta. In short, Beta is measured via a formula that calculates the price risk of a security or portfolio against a benchmark, which is typically the broader market as measured by the S&P 500 Index.
It is helpful in understanding the overall price risk level for investors during market downturns in particular.
Beta is helpful in understanding the overall price risk level for investors during market downturns in particular. The lower the Beta value, the less volatility the stock or portfolio should exhibit against the benchmark. This is beneficial for investors for obvious reasons, particularly those that are close to or already in retirement, as drawdowns should be relatively limited against the benchmark.
Importantly, low or high Beta simply measures the size of the moves a security makes; it does not mean necessarily that the price of the security stays nearly constant. Indeed, securities can be low Beta and still be caught in long-term downtrends, so this is simply one more tool investors can use when building a portfolio.
Here’s how to read stock betas:
- A beta of 1.0 means the stock moves equally with the S&P 500
- A beta of 2.0 means the stock moves twice as much as the S&P 500
- A beta of 0.0 means the stocks moves don’t correlate with the S&P 500
- A beta of -1.0 means the stock moves precisely opposite the S&P 500
Interestingly, low beta stocks have historically outperformed the market… But more on that later. You can download a spreadsheet of the 100 lowest beta stocks (as measured by 5 year beta) below:
Additionally, you can see the 100 lowest Beta stocks in the S&P 500 in the table below, which includes 3 stocks that have negative beta values below 0.
| FOXA | Fox Corp. | 32.41 | 1.4 | 20,114.65 | 12.6 | 17.9 | 0.10 |
| AMCR | Amcor Plc | 9.72 | 1.2 | 15,697.41 | 17.0 | 21.0 | -0.29 |
| DOW | Dow, Inc. | 50.48 | 4.2 | 37,517.34 | 0.12 | ||
| CTVA | Corteva, Inc. | 26.73 | 1.0 | 20,017.91 | -3.4 | -3.3 | 0.08 |
| NEM | Newmont Goldcorp Corp. | 39.18 | 3.7 | 32,123.45 | -288.1 | -1,058.8 | -0.01 |
| FOX | Fox Corp. | 31.70 | 1.5 | 19,674.00 | 12.4 | 17.9 | 0.07 |
| PSA | Public Storage | 234.00 | 3.4 | 40,855.93 | 27.9 | 95.4 | 0.12 |
| EVRG | Evergy, Inc. | 63.50 | 3.0 | 14,952.15 | 26.9 | 80.5 | 0.15 |
| AEP | American Electric Power Co., Inc. | 94.35 | 2.8 | 46,589.56 | 21.9 | 62.1 | 0.19 |
| WEC | WEC Energy Group, Inc. | 93.79 | 3.1 | 29,584.74 | 27.0 | 83.9 | 0.17 |
| DUK | Duke Energy Corp. | 95.43 | 3.9 | 69,530.39 | 21.1 | 82.3 | 0.19 |
| SO | The Southern Co. | 61.35 | 5.0 | 64,124.86 | 14.3 | 71.5 | 0.22 |
| ED | Consolidated Edison, Inc. | 93.32 | 3.9 | 30,995.68 | 22.0 | 86.8 | 0.21 |
| DTE | DTE Energy Co. | 128.21 | 2.9 | 24,254.25 | 21.1 | 62.3 | 0.25 |
| ETR | Entergy Corp. | 120.27 | 3.0 | 23,913.28 | 23.3 | 70.4 | 0.21 |
| D | Dominion Energy, Inc. | 81.89 | 4.4 | 67,306.62 | 55.0 | 240.8 | 0.22 |
| CMS | CMS Energy Corp. | 63.65 | 3.0 | 18,063.04 | 29.0 | 86.1 | 0.20 |
| ES | Eversource Energy | 85.31 | 2.5 | 27,606.49 | 31.5 | 77.8 | 0.22 |
| NEE | NextEra Energy, Inc. | 236.88 | 2.6 | 115,781.26 | 35.3 | 91.1 | 0.22 |
| PNW | Pinnacle West Capital Corp. | 94.20 | 3.1 | 10,579.04 | 21.0 | 65.8 | 0.23 |
| SJM | The J. M. Smucker Co. | 108.28 | 3.2 | 12,349.12 | 23.0 | 72.8 | 0.27 |
| XEL | Xcel Energy, Inc. | 63.64 | 2.5 | 32,775.30 | 25.4 | 63.7 | 0.25 |
| LNT | Alliant Energy Corp. | 53.18 | 3.3 | 12,631.37 | 24.6 | 81.2 | 0.24 |
| EXR | Extra Space Storage, Inc. | 112.23 | 3.1 | 15,199.58 | 33.1 | 103.7 | 0.24 |
| AWK | American Water Works Co., Inc. | 121.11 | 1.6 | 21,878.88 | 37.7 | 59.4 | 0.25 |
| EXC | Exelon Corp. | 45.89 | 3.1 | 44,585.99 | 19.6 | 61.1 | 0.29 |
| VTR | Ventas, Inc. | 66.00 | 4.8 | 24,590.61 | 49.3 | 236.9 | 0.27 |
| HSY | The Hershey Co. | 143.31 | 2.1 | 30,034.73 | 22.9 | 46.9 | 0.29 |
| AEE | Ameren Corp. | 76.59 | 3.1 | 18,826.05 | 23.6 | 73.8 | 0.28 |
| PEG | Public Service Enterprise Group, Inc. | 62.90 | 3.0 | 31,804.50 | 21.7 | 64.1 | 0.33 |
| NI | NiSource, Inc. | 28.04 | 3.5 | 10,468.65 | 91.9 | 326.2 | 0.33 |
| PPL | PPL Corp. | 33.22 | 5.0 | 23,993.05 | 13.5 | 66.8 | 0.35 |
| ATO | Atmos Energy Corp. | 112.30 | 1.9 | 13,273.97 | 26.5 | 49.6 | 0.30 |
| VZ | Verizon Communications, Inc. | 60.37 | 8.0 | 249,690.32 | 15.5 | 124.4 | 0.33 |
| HCP | HCP, Inc. | 36.30 | 4.1 | 17,827.29 | 17.6 | 71.8 | 0.29 |
| CBOE | Cboe Global Markets, Inc. | 114.10 | 2.3 | 12,742.92 | 31.4 | 71.1 | 0.31 |
| CPB | Campbell Soup Co. | 46.46 | 3.0 | 13,993.15 | 52.4 | 157.8 | 0.35 |
| FE | FirstEnergy Corp. | 48.01 | 3.9 | 25,924.78 | 23.1 | 90.5 | 0.34 |
| AMT | American Tower Corp. | 216.67 | 1.7 | 95,916.56 | 65.1 | 108.4 | 0.26 |
| LW | Lamb Weston Holdings, Inc. | 75.00 | 1.3 | 10,954.73 | 23.1 | 30.5 | 0.31 |
| GIS | General Mills, Inc. | 50.51 | 3.9 | 30,527.94 | 16.2 | 62.9 | 0.36 |
| WELL | Welltower, Inc. | 87.96 | 4.0 | 35,645.53 | 98.0 | 387.5 | 0.34 |
| SRE | Sempra Energy | 143.97 | 2.6 | 39,527.11 | 20.4 | 53.9 | 0.36 |
| CNP | CenterPoint Energy, Inc. | 29.54 | 4.8 | 14,835.55 | 25.9 | 125.0 | 0.37 |
| O | Realty Income Corp. | 80.88 | 3.6 | 25,738.28 | 61.7 | 223.2 | 0.36 |
| AZO | AutoZone, Inc. | 1,129.47 | 0.0 | 27,150.20 | 17.4 | 0.0 | 0.42 |
| EQR | Equity Residential | 87.68 | 2.6 | 32,557.95 | 40.4 | 103.2 | 0.36 |
| ESS | Essex Property Trust, Inc. | 325.09 | 2.4 | 21,367.52 | 52.3 | 124.0 | 0.39 |
| MKTX | MarketAxess Holdings, Inc. | 344.07 | 0.6 | 12,991.05 | 63.6 | 36.0 | 0.47 |
| K | Kellogg Co. | 60.89 | 4.6 | 20,741.08 | 24.2 | 111.9 | 0.42 |
| CME | CME Group, Inc. | 200.46 | 2.3 | 71,783.72 | 39.0 | 91.4 | 0.42 |
| MAA | Mid-America Apartment Communities, Inc. | 135.48 | 2.8 | 15,450.68 | 65.4 | 185.3 | 0.40 |
| CHD | Church & Dwight Co., Inc. | 74.89 | 1.2 | 18,505.02 | 30.5 | 36.7 | 0.33 |
| UDR | UDR, Inc. | 49.42 | 2.7 | 23,563.19 | 86.1 | 235.2 | 0.39 |
| AVB | AvalonBay Communities, Inc. | 219.41 | 2.7 | 30,642.14 | 33.2 | 91.2 | 0.41 |
| KMB | Kimberly-Clark Corp. | 134.20 | 3.0 | 46,004.57 | 22.9 | 69.7 | 0.43 |
| MKC | McCormick & Co., Inc. | 159.38 | 1.4 | 21,183.51 | 30.0 | 42.9 | 0.43 |
| MCD | McDonald's Corp. | 194.61 | 3.0 | 147,795.40 | 0.44 | ||
| KO | The Coca-Cola Co. | 53.75 | 3.7 | 230,265.00 | 29.7 | 110.0 | 0.43 |
| CLX | The Clorox Co. | 151.40 | 3.3 | 18,999.79 | 23.6 | 77.8 | 0.42 |
| CCI | Crown Castle International Corp. | 141.00 | 4.0 | 58,656.00 | 70.7 | 285.7 | 0.40 |
| HRL | Hormel Foods Corp. | 40.57 | 2.1 | 21,663.16 | 22.0 | 45.6 | 0.46 |
| AIV | Apartment Investment & Management Co. | 54.29 | 5.9 | 8,082.91 | 23.8 | 139.2 | 0.44 |
| PEP | PepsiCo, Inc. | 136.64 | 2.8 | 190,534.92 | 15.5 | 42.7 | 0.51 |
| RSG | Republic Services, Inc. | 86.03 | 1.8 | 27,594.21 | 26.5 | 47.1 | 0.46 |
| TSN | Tyson Foods, Inc. | 78.48 | 2.4 | 23,126.17 | 12.8 | 30.5 | 0.48 |
| FRT | Federal Realty Investment Trust | 139.04 | 3.0 | 10,508.81 | 42.1 | 124.5 | 0.49 |
| SYY | Sysco Corp. | 79.17 | 2.0 | 40,535.59 | 24.4 | 48.0 | 0.49 |
| PG | Procter & Gamble Co. | 123.25 | 2.4 | 307,362.08 | 76.6 | 183.5 | 0.51 |
| REG | Regency Centers Corp. | 68.50 | 2.6 | 11,501.62 | 40.0 | 102.5 | 0.48 |
| SBAC | SBA Communications Corp. | 244.15 | 0.2 | 27,614.83 | 212.3 | 32.2 | 0.45 |
| KHC | The Kraft Heinz Co. | 28.38 | 6.4 | 34,623.32 | -3.1 | -20.0 | 0.49 |
| EIX | Edison International | 66.05 | 3.7 | 23,651.84 | -86.8 | -321.8 | 0.53 |
| PM | Philip Morris International, Inc. | 81.98 | 5.6 | 127,551.04 | 17.1 | 95.6 | 0.60 |
| SPG | Simon Property Group, Inc. | 155.56 | 5.3 | 103,109.23 | 22.2 | 117.0 | 0.54 |
| WM | Waste Management, Inc. | 111.35 | 1.8 | 47,239.24 | 26.9 | 48.4 | 0.53 |
| DLR | Digital Realty Trust, Inc. | 132.82 | 3.2 | 27,672.12 | 121.7 | 389.4 | 0.50 |
| MO | Altria Group, Inc. | 46.80 | 6.9 | 87,427.08 | 13.9 | 96.1 | 0.64 |
| RE | Everest Re Group Ltd. | 248.59 | 2.3 | 10,127.56 | 19.5 | 44.0 | 0.50 |
| MDLZ | Mondelez International, Inc. | 52.77 | 2.0 | 76,102.26 | 20.7 | 41.8 | 0.57 |
| JNJ | Johnson & Johnson | 128.35 | 3.6 | 338,737.47 | 0.57 | ||
| IRM | Iron Mountain, Inc. | 34.09 | 7.2 | 9,787.48 | 33.5 | 239.8 | 0.52 |
| CL | Colgate-Palmolive Co. | 68.41 | 2.5 | 58,696.19 | 26.0 | 65.0 | 0.56 |
| YUM | Yum! Brands, Inc. | 109.10 | 1.5 | 33,197.60 | 25.4 | 37.8 | 0.53 |
| EQIX | Equinix, Inc. | 565.74 | 1.7 | 47,985.50 | 93.2 | 159.1 | 0.56 |
| ARE | Alexandria Real Estate Equities, Inc. | 158.25 | 2.5 | 18,039.71 | 45.2 | 112.4 | 0.57 |
| DRE | Duke Realty Corp. | 34.56 | 2.5 | 12,600.13 | 53.7 | 133.5 | 0.58 |
| KR | The Kroger Co. | 25.28 | 2.9 | 20,264.98 | 12.3 | 36.1 | 0.64 |
| WMT | Walmart, Inc. | 119.04 | 2.2 | 338,583.09 | 26.7 | 59.2 | 0.61 |
| TAP | Molson Coors Brewing Co. | 56.84 | 3.2 | 12,293.98 | 13.7 | 43.5 | 0.68 |
| COG | Cabot Oil & Gas Corp. | 18.81 | 1.7 | 7,869.93 | 9.9 | 16.8 | 0.61 |
| VNO | Vornado Realty Trust | 64.28 | 4.1 | 12,265.46 | 4.3 | 17.3 | 0.63 |
| ORLY | O'Reilly Automotive, Inc. | 438.54 | 0.0 | 33,209.76 | 25.0 | 0.0 | 0.59 |
| HRB | H&R Block, Inc. | 25.18 | 4.1 | 5,054.13 | 11.9 | 48.3 | 0.62 |
| ICE | Intercontinental Exchange, Inc. | 91.96 | 1.5 | 51,535.76 | 25.8 | 37.6 | 0.61 |
| CB | Chubb Ltd. | 149.14 | 2.0 | 67,970.41 | 18.1 | 36.0 | 0.64 |
| DLTR | Dollar Tree, Inc. | 114.55 | 0.0 | 27,105.39 | -17.3 | 0.0 | 0.60 |
| LHX | L3Harris Technologies, Inc. | 200.96 | 1.4 | 44,728.67 | 25.0 | 34.9 | 0.58 |
| PHM | PulteGroup, Inc. | 40.41 | 1.1 | 10,951.11 | 12.3 | 13.4 | 0.64 |
| CTXS | Citrix Systems, Inc. | 105.64 | 1.3 | 13,828.49 | 21.7 | 28.8 | 0.62 |
| Ticker | Name | Price | Dividend Yield | Market Cap ($M) | P/E Ratio | Payout Ratio | Beta |
Table of Contents
- High Beta Stocks Versus Low Beta Stocks
- How To Calculate Beta
- Beta & The Capital Asset Pricing Model (CAPM)
- Analysis On The 3 S&P 500 Stocks With Negative Beta
- Final Thoughts
High Beta Stocks Versus Low Beta
Intuitively, it would make sense that high Beta stocks would outperform during bull markets. After all, these stocks should be achieving more than the benchmark’s returns given their high Beta values. While this can be true over short periods of time – particularly the strongest parts of the bull market – the high Beta names are generally the first to be sold heavily by investors.
This excellent paper from the CFA Institute theorizes that this is true because investors are able to use leverage to bid up momentum names with high Beta values and thus, on average, these stocks have lower prospective returns at any given time. In addition, leveraged positions are among the first to be sold by investors during weak periods because of margin requirements or other financing concerns that come up during bear markets. In other words, while high Beta names may outperform while the market is strong, as signs of weakness begin to show, high Beta names are the first to be sold and generally, much more strongly than the benchmark.
Indeed, evidence suggests that during good years for the market, high Beta names capture 138% of the market’s total returns. In other words, if the market returned 10% in a year, high Beta names would, on average, produce 13.8% returns. However, during down years, high Beta names capture 243% of the market’s returns. In a similar example, if the market lost 10% during a year, the group of high Beta names would have returned -24.3%. Given this relatively small outperformance during good times and vast underperformance during weak periods, it is easy to see why we prefer low Beta stocks.
While low Beta stocks aren’t a vaccine against downturns in the market, it is much easier to make the case over the long run for low Beta stocks versus high Beta given how each group performs during bull and bear markets.
How To Calculate Beta
The formula to calculate a security’s Beta is fairly straightforward. The result, expressed as a number, shows the security’s tendency to move with the benchmark.
In other words, a Beta value of 1.00 means that the security in question should move virtually in lockstep with the benchmark (as discussed briefly in the introduction of this article). A Beta of 2.00 means moves should be twice as large in magnitude while a negative Beta means that returns in the security and benchmark are negatively correlated; these securities tend to move in the opposite direction from the benchmark. This sort of security would be helpful to mitigate broad market weakness in one’s portfolio as negatively correlated returns would suggest the security in question would rise while the market falls.
For those investors seeking high Beta, stocks with values in excess of 1.3 would be the ones to seek out. These securities would offer investors at least 1.3X the market’s returns for any given period.
Here’s a look at the formula to compute Beta:
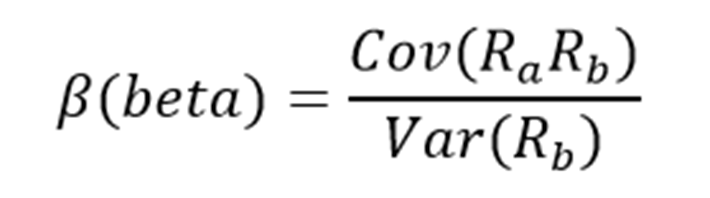
The numerator is the covariance of the asset in question while the denominator is the variance of the market. These complicated-sounding variables aren’t actually that difficult to compute.
Here’s an example of the data you’ll need to calculate Beta:
- Risk-free rate (typically Treasuries at least two years out)
- Your asset’s rate of return over some period (typically one year to five years)
- Your benchmark’s rate of return over the same period as the asset
To show how to use these variables to do the calculation of Beta, we’ll assume a risk-free rate of 2%, our stock’s rate of return of 14% and the benchmark’s rate of return of 8%.
You start by subtracting the risk-free rate of return from both the security in question and the benchmark. In this case, our asset’s rate of return net of the risk-free rate would be 12% (14% – 2%). The same calculation for the benchmark would yield 6% (8% – 2%).
These two numbers – 12% and 6%, respectively – are the numerator and denominator for the Beta formula. Twelve divided by six yields a value of 2.00, and that is the Beta for this hypothetical security. On average, we’d expect an asset with this Beta value to be 200% as volatile as the benchmark. Thinking about it another way, this asset should be about twice as volatile than the benchmark while still having its expected returns correlated in the same direction. That is, returns would be correlated with the market’s overall direction, but would return double what the market did during the period. This would be an example of a very high Beta stock and would offer a significantly higher risk profile than an average or low Beta stock.
Beta & The Capital Asset Pricing Model
The Capital Asset Pricing Model, or CAPM, is a common investing formula that utilizes the Beta calculation to account for the time value of money as well as the risk-adjusted returns expected for a particular asset. Beta is an essential component of the CAPM because without it, riskier securities would appear more favorable to prospective investors as their risk wouldn’t be accounted for in the calculation.
The CAPM formula is as follows:

The variables are defined as:
- ERi = Expected return of investment
- Rf = Risk-free rate
- βi = Beta of the investment
- ERm = Expected return of market
The risk-free rate is the same as in the Beta formula, while the Beta that you’ve already calculated is simply placed into the CAPM formula. The expected return of the market (or benchmark) is placed into the parentheses with the market risk premium, which is also from the Beta formula. This is the expected benchmark’s return minus the risk-free rate.
To continue our example, here is how the CAPM actually works:
ER = 2% + 2.00(8% – 2%)
In this case, our security has an expected return of 14% against an expected benchmark return of 8%. In theory, this security should vastly outperform the market to the upside but keep in mind that during downturns, the security would suffer significantly larger losses than the benchmark. Indeed, if we changed the expected return of the market to -8% instead of +8%, the same equation yields expected returns for our hypothetical security of -18%. This security would theoretically achieve stronger returns to the upside but certainly much larger losses on the downside, highlighting the risk of high Beta names during anything but strong bull markets. While the CAPM certainly isn’t perfect, it is relatively easy to calculate and gives investors a means of comparison between two investment alternatives.
Analysis On The 3 S&P 500 Stocks With Negative Beta
Now, we’ll take a look at the three S&P 500 stocks in our database that had negative beta values as of October 24th, 2019.
Negative Beta Stock #1: Newmont Goldcorp Corporation (NEM)
Newmont Goldcorp is a gold and copper miner with operations on four continents. The company is the product of an April 2019 mega-merger between the old Newmont and Goldcorp businesses, respectively, forming the world’s largest gold mining company. The combined company’s scale is enormous, with forecast production of six to seven million ounces of gold annually over the long-term. Shares trade today with a $31 billion market capitalization and the new company should produce about $12 billion in revenue in its first full year of operations next year.
Newmont Goldcorp’s current yield is fairly low at 1.5%, and its dividend has been very volatile over time. We’d expect that volatility to continue given that gold miners have enormous capital expenditures, and because they rely heavily upon spot prices for the metals they mine. This combination means that earnings are volatile and with that, the company’s ability to pay the dividend is as well. We see Newmont Goldcorp growing earnings at a rate of 5% annually over time, but this should be offset by the very high valuation the stock carries today. With shares at 29 times earnings, which compares very unfavorably to our fair value estimate of 21 times earnings, we see Newmont Goldcorp producing essentially no total returns annually in the years to come. Newmont Goldcorp’s Beta value is -0.05. Click here to see our Sure Analysis reports on Newmont Goldcorp Corporation.
Negative Beta Stock #2: Dow Inc. (DOW)
The next stock on our list is Dow Incorporated (DOW), the product of a complex series of mergers and spin-offs that have been completed since 2017. Most recently, the former Materials Science Division of the old DowDuPont company that no longer exists was spun off as the new Dow Incorporated. The new Dow trades with a market capitalization of $35 billion and produces around $45 billion in annual revenue. The company was spun off in order to try and unlock value from the former DowDuPont that had three very different businesses under one roof.
Dow offers investors an outstanding yield, with the current payout of $2.80 per share good for a 6% yield. That is roughly three times that of the broader market, and a similar multiple to long-term Treasuries, so income investors may find the stock very attractive for that reason. We see earnings growth at just 3% annually moving forward, and the stock’s current valuation of 13.4 times this year’s earnings estimate of $3.50 per share means that the valuation should produce a small headwind to total returns in the years to come. Even with earnings growth and the valuation essentially offsetting each other, we see the dividend yield providing 6% total annual returns in the years to come. Dow’s current Beta value is -0.06. Click here to see our Sure Analysis reports on Dow Incorporated.
Negative Beta Stock #3: Fox Corporation (FOX)
The final stock on our list is Fox Corporation (FOX), (FOXA). The new Fox is the result of Disney (DIS) buying Fox’ former cinema and entertainment business. The company is now highly focused on its cable networks. The smaller Fox produces about $12 billion in annual revenue and trades with a market capitalization of $21 billion.
Fox’ dividend is good for a current yield of 1.4%, so it is somewhat below the broader market. For this reason, Fox is probably not a great choice for investors focused on income. However, recent weakness in the stock has shares trading for 13 times our earnings estimate for this year, which is well below our fair value estimate of 14.8 times earnings. This tailwind, combined with the yield and 4.2% projected annual earnings growth, should produce total returns in the area of 8% in the years to come. That makes Fox the most attractive negative Beta stock in the S&P 500 with its favorable combination of yield, growth, and value. The stock’s Beta value is -0.07. Click here to see our Sure Analysis reports on Fox Incorporated.
Final Thoughts