


Updated On August 6th, 2019 by Bob Ciura
This article examines securities in The Sure Analysis Research Database with:
- Yields of 5% or greater
- Dividend Risk Scores of C or better
Note: We update this article at the beginning of each month so be sure to bookmark this page for next month.
With yields between 5% and 10%, these securities all offer high dividends (or distributions). And with Dividend Risk Scores of C or better, they don’t suffer from the usual excessive riskiness of truly high yielding securities.
Stocks with Dividend Risk Scores of A and B were given preference in the top 10 list, to place focus on the highest-quality dividend stocks first.
In other words, these are safe, high yield income stocks for you to consider adding to your retirement or pre-retirement portfolio.
You can download your full list of all 300+ securities with 5%+ yields below to save for future reference.
You can also see these 300+ securities in the table below.
| AB | AllianceBernstein Holding LP | 29.87 | 8.2 | 2,886.1 | 12.8 | 104.4 |
| ABBV | AbbVie, Inc. | 67.03 | 6.2 | 99,316.9 | ||
| ABDC | Alcentra Capital Corp. | 8.32 | 8.6 | 107.3 | 27.3 | 236.0 |
| ABEV | ||||||
| ABR | Arbor Realty Trust, Inc. | 12.35 | 8.4 | 1,171.3 | 9.0 | 76.0 |
| ACRE | Ares Commercial Real Estate Corp. | 15.32 | 8.2 | 442.0 | 11.4 | 94.0 |
| ADES | Advanced Emissions Solutions, Inc. | 12.86 | 7.7 | 241.9 | 5.9 | 45.4 |
| AEG | ||||||
| AFIN | American Finance Trust, Inc. | 11.77 | 0.0 | 1,239.5 | -22.3 | 0.0 |
| AGNC | AGNC Investment Corp. | 17.37 | 12.3 | 9,476.9 | -11.3 | -138.2 |
| AHC | A.H. Belo Corp. | 3.72 | 8.7 | 79.0 | 6.2 | 54.0 |
| AHH | Armada Hoffler Properties, Inc. | 17.13 | 4.8 | 1,189.8 | 52.6 | 250.2 |
| AHT | Ashford Hospitality Trust, Inc. | 2.72 | 18.0 | 271.7 | -1.5 | -26.5 |
| AI | Arlington Asset Investment Corp. | 6.60 | 22.4 | 245.0 | -9.9 | -220.9 |
| AINV | Apollo Investment Corp. | 16.52 | 10.8 | 1,131.3 | 16.3 | 176.2 |
| AJX | Great Ajax Corp. | 14.01 | 8.9 | 265.7 | 9.5 | 83.8 |
| AM | Antero Midstream Corp. | 9.22 | 6.0 | 4,581.9 | 31.5 | 188.4 |
| AMC | AMC Entertainment Holdings, Inc. | 11.81 | 6.8 | 1,219.1 | -47.0 | -320.1 |
| AMID | Third Coast Midstream LLC | 5.24 | 0.0 | 285.3 | -7.4 | 0.0 |
| ANDX | Andeavor Logistics LP | 32.17 | 12.8 | 7,901.9 | 12.6 | 160.2 |
| ANF | Abercrombie & Fitch Co. | 18.98 | 4.3 | 1,233.6 | 12.8 | 54.7 |
| ANH | Anworth Mortgage Asset Corp. | 3.90 | 13.8 | 386.7 | -11.8 | -162.3 |
| APAM | Artisan Partners Asset Management, Inc. | 29.33 | 7.8 | 2,317.5 | 11.3 | 88.5 |
| APLE | Apple Hospitality REIT, Inc. | 15.74 | 7.6 | 3,539.3 | 17.9 | 135.7 |
| APO | Apollo Global Management LLC | 34.39 | 5.2 | 14,825.5 | 50.2 | 262.1 |
| APTS | Preferred Apartment Communities, Inc. | 14.78 | 7.1 | 649.4 | -9.2 | -65.0 |
| APU | AmeriGas Partners LP | 34.13 | 11.2 | 3,153.6 | 59.4 | 665.3 |
| ARCC | Ares Capital Corp. | 18.68 | 8.4 | 7,971.8 | 10.3 | 86.7 |
| ARI | Apollo Commercial Real Estate Finance, Inc. | 18.85 | 9.8 | 2,881.8 | 11.9 | 116.6 |
| ARLP | Alliance Resource Partners LP | 17.59 | 12.0 | 2,259.7 | 5.0 | 60.1 |
| AROC | Archrock, Inc. | 11.26 | 4.8 | 1,435.0 | 27.2 | 130.6 |
| ARR | ARMOUR Residential REIT, Inc. | 18.09 | 12.6 | 1,067.8 | -1.9 | -24.3 |
| ATAX | America First Multifamily Investors LP | 7.14 | 7.1 | 426.6 | 12.1 | 85.8 |
| ATV | ||||||
| AUO | ||||||
| AVH | ||||||
| AY | Atlantica Yield Plc | 23.36 | 6.0 | 2,364.3 | 62.5 | 373.5 |
| AYR | Aircastle Ltd. | 21.20 | 5.5 | 1,595.4 | 7.2 | 39.5 |
| BANX | ||||||
| BBBY | Bed Bath & Beyond, Inc. | 9.50 | 6.9 | 1,199.8 | -2.2 | -15.3 |
| BBDC | Barings BDC, Inc. | 9.91 | 2.5 | 502.3 | -5.5 | -13.9 |
| BBGI | Beasley Broadcast Group, Inc. | 3.27 | 6.1 | 90.8 | 8.1 | 49.9 |
| BBVA | ||||||
| BCE | BCE, Inc. | 45.49 | 5.1 | 40,989.5 | 18.7 | 95.6 |
| BCRH | Blue Capital Reinsurance Holdings Ltd. | 8.01 | 7.5 | 70.1 | -2.4 | -18.3 |
| BCSF | Bain Capital Specialty Finance, Inc. | 18.15 | 0.0 | 929.7 | 17.4 | 0.0 |
| BDN | Brandywine Realty Trust | 14.79 | 5.1 | 2,605.5 | 29.6 | 149.7 |
| BEP | Brookfield Renewable Partners LP | 35.86 | 5.5 | 11,062.1 | 148.3 | 817.6 |
| BGCP | BGC Partners, Inc. | 5.49 | 11.7 | 1,873.5 | 10.3 | 120.6 |
| BGFV | Big 5 Sporting Goods Corp. | 1.98 | 18.2 | 35.7 | -165.0 | -3,000.0 |
| BGG | Briggs & Stratton Corp. | 9.67 | 5.8 | 404.2 | -8.5 | -49.3 |
| BGS | B&G Foods, Inc. | 18.45 | 10.4 | 1,198.2 | 7.2 | 74.6 |
| BHR | Braemar Hotels & Resorts, Inc. | 9.26 | 6.9 | 305.2 | -24.8 | -171.0 |
| BKCC | BlackRock Capital Investment Corp. | 6.08 | 11.8 | 418.5 | 43.9 | 519.4 |
| BKE | The Buckle, Inc. | 20.45 | 0.0 | 984.1 | 10.7 | 0.0 |
| BKEP | BlueKnight Energy Partners LP | 1.36 | 29.2 | 53.7 | -0.8 | -23.8 |
| BKS | Barnes & Noble, Inc. | 6.52 | 9.2 | 478.0 | 126.0 | 1,157.9 |
| BLX | Banco Latinoamericano de Comercio Exterior SA | 20.90 | 7.3 | 790.2 | 35.1 | 255.3 |
| BMA | ||||||
| BP | ||||||
| BPL | Buckeye Partners LP | 41.73 | 9.7 | 6,409.3 | -68.5 | -661.8 |
| BPMP | BP Midstream Partners LP | 15.84 | 7.1 | 1,666.6 | 11.9 | 84.7 |
| BPR | Brookfield Property REIT, Inc. | 19.44 | 0.0 | 23,068.8 | 4.8 | 0.0 |
| BPT | BP Prudhoe Bay Royalty Trust | 9.49 | 54.2 | 200.1 | 1.9 | 101.5 |
| BPY | Brookfield Property Partners LP | 19.45 | 6.6 | 16,831.0 | 9.6 | 62.6 |
| BRT | BRT Apartments Corp. | 14.12 | 5.7 | 222.0 | 14.5 | 83.1 |
| BRX | Brixmor Property Group, Inc. | 18.90 | 5.9 | 5,581.3 | ||
| BSM | Black Stone Minerals LP | 15.11 | 9.3 | 3,077.5 | 12.8 | 118.5 |
| BT | ||||||
| BTI | ||||||
| BXG | Bluegreen Vacations Corp. | 10.47 | 5.8 | 791.4 | 9.5 | 55.4 |
| BXMT | Blackstone Mortgage Trust, Inc. | 35.80 | 7.0 | 4,782.0 | 14.4 | 100.3 |
| CAPL | CrossAmerica Partners LP | 16.63 | 12.7 | 569.2 | 102.8 | 1,305.7 |
| CATO | The Cato Corp. | 14.41 | 9.2 | 354.5 | 12.5 | 115.2 |
| CCR | CONSOL Coal Resources LP | 16.31 | 12.7 | 444.3 | 7.6 | 97.4 |
| CDR | Cedar Realty Trust, Inc. | 2.66 | 7.7 | 230.6 | 18.8 | 145.3 |
| CELP | Cypress Energy Partners LP | 7.65 | 11.0 | 92.3 | 10.4 | 114.4 |
| CEO | ||||||
| CEQP | Crestwood Equity Partners LP | 37.39 | 6.6 | 2,643.9 | 12.8 | 84.0 |
| CGBD | TCG BDC, Inc. | 15.18 | 9.7 | 923.1 | 18.2 | 176.7 |
| CHKR | Chesapeake Granite Wash Trust | 1.04 | 21.7 | 48.6 | 4.6 | 100.0 |
| CHMI | Cherry Hill Mortgage Investment Corp. | 15.62 | 12.6 | 264.6 | -12.5 | -157.9 |
| CHS | Chico's FAS, Inc. | 3.22 | 10.8 | 372.7 | 51.1 | 554.0 |
| CHSP | Chesapeake Lodging Trust | 27.90 | 5.7 | 1,700.8 | 16.8 | 96.2 |
| CIM | Chimera Investment Corp. | 19.48 | 10.4 | 3,591.3 | 15.2 | 158.6 |
| CINR | Ciner Resources LP | 17.06 | 13.3 | 337.5 | 6.6 | 86.9 |
| CIO | City Office REIT, Inc. | 12.46 | 7.6 | 492.3 | -27.8 | -210.8 |
| CLDT | Chatham Lodging Trust | 18.49 | 7.0 | 877.4 | 29.5 | 206.5 |
| CLNC | Colony Credit Real Estate, Inc. | 16.29 | 10.7 | 2,085.8 | -13.8 | -148.2 |
| CLNY | Colony Capital, Inc. | 5.67 | 7.7 | 2,759.3 | -4.1 | -32.0 |
| CM | Canadian Imperial Bank of Commerce | 78.75 | 5.3 | 34,958.4 | 9.1 | 47.9 |
| CMFN | CM Finance, Inc. | 7.37 | 13.5 | 101.1 | -17.4 | -234.8 |
| CMO | Capstead Mortgage Corp. | 8.56 | 4.5 | 737.1 | -9.9 | -44.7 |
| CMP | Compass Minerals International, Inc. | 57.18 | 5.0 | 1,948.9 | 30.6 | 153.1 |
| CMRE | Costamare Inc. | 6.16 | 6.6 | 685.1 | 23.5 | 155.5 |
| CNSL | Consolidated Communications Holdings, Inc. | 4.86 | 32.3 | 344.9 | -7.2 | -233.7 |
| CNXM | CNX Midstream Partners LP | 15.55 | 9.3 | 966.9 | 7.2 | 67.0 |
| CODI | Compass Diversified Holdings | 19.76 | 7.2 | 1,198.0 | -27.7 | -199.2 |
| CORR | CorEnergy Infrastructure Trust, Inc. | 40.62 | 7.4 | 521.0 | 16.0 | 118.2 |
| CPAC | ||||||
| CPLG | CorePoint Lodging, Inc. | 11.95 | 3.6 | 693.1 | -2.6 | -9.2 |
| CPLP | Capital Product Partners LP | 11.31 | 17.7 | 204.5 | -1.3 | -22.5 |
| CPTA | Capitala Finance Corp. | 9.54 | 10.5 | 153.4 | -9.4 | -98.3 |
| CRT | Cross Timbers Royalty Trust | 10.98 | 11.6 | 65.7 | 8.7 | 100.3 |
| CRWS | Crown Crafts, Inc. | 4.71 | 6.9 | 47.2 | 9.4 | 64.5 |
| CSS | CSS Industries, Inc. | 5.28 | 15.4 | 46.1 | -0.9 | -13.6 |
| CSWC | Capital Southwest Corp. | 21.10 | 6.5 | 371.2 | 10.7 | 69.0 |
| CTL | CenturyLink, Inc. | 12.26 | 15.4 | 13,203.7 | -1.6 | -25.2 |
| CTT | CatchMark Timber Trust, Inc. | 10.29 | 5.3 | 501.1 | -3.4 | -18.0 |
| CVA | Covanta Holding Corp. | 17.40 | 5.8 | 2,266.0 | -66.2 | -383.9 |
| CVI | CVR Energy, Inc. | 52.91 | 5.7 | 5,289.9 | 13.5 | 77.0 |
| CXW | CoreCivic, Inc. | 16.79 | 10.4 | 1,973.0 | 11.7 | 121.9 |
| CYD | China Yuchai International Ltd. | 14.12 | 0.0 | 581.8 | 6.0 | 0.0 |
| DBI | Designer Brands, Inc. | 18.66 | 0.0 | 1,400.8 | -119.6 | 0.0 |
| DCP | DCP Midstream LP | 29.55 | 10.6 | 4,230.7 | 44.6 | 470.9 |
| DD | DuPont de Nemours, Inc. | 73.21 | 6.2 | 54,961.6 | 17.2 | 106.8 |
| DEA | Easterly Government Properties, Inc. | 18.86 | 5.5 | 1,367.4 | 386.5 | 2,140.2 |
| DHT | DHT Holdings, Inc. | 5.65 | 1.9 | 802.3 | -39.8 | -77.6 |
| DKL | Delek Logistics Partners LP | 33.41 | 9.3 | 815.4 | 13.0 | 121.6 |
| DLNG | Dynagas LNG Partners LP | 1.44 | 56.0 | 51.5 | -6.2 | -349.8 |
| DMLP | Dorchester Minerals LP | 18.49 | 10.0 | 648.5 | 10.9 | 108.6 |
| DOC | Physicians Realty Trust | 17.28 | 5.3 | 3,212.8 | 57.4 | 304.5 |
| DOW | Dow, Inc. | 48.02 | 0.0 | 35,971.5 | ||
| DRAD | Digirad Corp. | 5.32 | 20.4 | 10.9 | -2.2 | -44.6 |
| DRH | DiamondRock Hospitality Co. | 10.11 | 4.9 | 2,050.7 | 22.5 | 110.3 |
| DVCR | Diversicare Healthcare Services, Inc. | 3.61 | 3.4 | 21.5 | -2.2 | -7.4 |
| DX | Dynex Capital, Inc. | 16.44 | 12.7 | 417.3 | -3.6 | -45.8 |
| E | ||||||
| EARN | Ellington Residential Mortgage REIT | 11.53 | 12.3 | 143.4 | 87.2 | 1,076.1 |
| EC | ||||||
| ECT | ECA Marcellus Trust I | 1.70 | 18.6 | 29.8 | 5.3 | 99.1 |
| EFC | Ellington Financial, Inc. | 17.65 | 10.1 | 588.8 | 13.0 | 131.1 |
| ENB | Enbridge, Inc. | 33.62 | 6.3 | 67,450.3 | 21.5 | 135.5 |
| ENBL | Enable Midstream Partners LP | 13.97 | 9.2 | 6,021.4 | 12.3 | 112.9 |
| ENIA | ||||||
| ENIC | ||||||
| ENLC | EnLink Midstream LLC | 9.68 | 11.3 | 5,217.4 | -16.3 | -183.1 |
| EPD | Enterprise Products Partners LP | 30.08 | 5.9 | 64,321.8 | 14.5 | 85.4 |
| EPR | EPR Properties | 75.00 | 5.8 | 5,638.0 | 20.1 | 117.2 |
| EQM | EQM Midstream Partners LP | 38.64 | 11.3 | 7,946.2 | 15.3 | 172.7 |
| EQNR | ||||||
| ESBK | Elmira Savings Bank | 15.39 | 5.9 | 53.2 | 17.7 | 105.4 |
| ET | Energy Transfer LP | 14.41 | 8.5 | 37,644.7 | 11.7 | 99.5 |
| ETM | Entercom Communications Corp. | 5.77 | 6.3 | 821.4 | -2.3 | -14.4 |
| ETRN | Equitrans Midstream Corp. | 16.67 | 0.0 | 4,373.5 | 25.7 | 0.0 |
| EVA | Enviva Partners LP | 30.54 | 8.3 | 807.9 | 59.7 | 494.7 |
| EVC | Entravision Communications Corp. | 3.29 | 6.2 | 275.0 | 19.4 | 120.2 |
| F | Ford Motor Co. | 9.56 | 6.3 | 38,104.4 | 17.3 | 108.9 |
| FAT | FAT Brands, Inc. | 3.84 | 9.3 | 45.0 | -15.4 | -142.5 |
| FCAU | Fiat Chrysler Automobiles NV | 13.45 | 5.7 | 20,111.5 | 5.6 | 32.2 |
| FDUS | Fidus Investment Corp. | 16.21 | 9.6 | 396.6 | 8.7 | 83.5 |
| FGP | Ferrellgas Partners LP | 0.85 | 0.0 | 78.7 | -0.4 | 0.0 |
| FLMN | Falcon Minerals Corp. | 8.10 | 3.7 | 680.9 | 14.6 | 54.2 |
| FLXS | Flexsteel Industries, Inc. | 18.38 | 5.0 | 137.6 | -13.8 | -69.7 |
| FSK | FS KKR Capital Corp. | 5.80 | 13.0 | 3,052.3 | 2.7 | 34.7 |
| FTAI | Fortress Transportation & Infrastructure Investors LLC | 14.97 | 8.9 | 1,262.5 | 7,485.0 | 66,265.6 |
| FUN | Cedar Fair LP | 50.70 | 7.3 | 2,809.4 | 22.5 | 164.8 |
| GAIN | Gladstone Investment Corp. | 11.37 | 7.2 | 370.2 | 4.6 | 32.8 |
| GARS | Garrison Capital, Inc. | 7.06 | 14.5 | 113.1 | -99.2 | -1,434.6 |
| GBDC | Golub Capital BDC, Inc. | 18.24 | 6.9 | 1,119.0 | 14.9 | 103.3 |
| GCAP | GAIN Capital Holdings, Inc. | 4.34 | 5.6 | 189.1 | ||
| GCI | Gannett Co., Inc. | 10.15 | 6.3 | 1,154.4 | 359.8 | 2,284.1 |
| GECC | Great Elm Capital Corp. | 8.74 | 11.4 | 87.6 | 29.8 | 340.9 |
| GEF | Greif, Inc. | 35.06 | 4.9 | 1,709.9 | 13.7 | 67.1 |
| GEF.B | Greif, Inc. | 43.52 | 4.0 | 2,086.4 | 11.3 | 45.7 |
| GEL | Genesis Energy LP | 23.16 | 9.3 | 2,810.7 | -40.9 | -381.3 |
| GEO | The GEO Group, Inc. | 17.57 | 11.2 | 2,064.1 | 13.5 | 150.5 |
| GILT | Gilat Satellite Networks Ltd. | 8.42 | 0.0 | 460.7 | 24.5 | 0.0 |
| GLAD | Gladstone Capital Corp. | 9.52 | 8.8 | 279.1 | 31.9 | 282.1 |
| GLOP | GasLog Partners LP | 21.72 | 10.0 | 1,026.7 | 16.4 | 164.3 |
| GLP | Global Partners LP | 19.96 | 9.5 | 680.9 | 14.3 | 137.0 |
| GLPI | Gaming & Leisure Properties, Inc. | 37.81 | 6.9 | 8,114.1 | 24.1 | 167.3 |
| GME | GameStop Corp. | 4.12 | 37.7 | 412.1 | -0.6 | -20.9 |
| GMLP | Golar LNG Partners LP | 11.91 | 16.7 | 834.4 | 19.2 | 320.9 |
| GMRE | Global Medical REIT, Inc. | 10.59 | 7.6 | 363.2 | 31.3 | 238.6 |
| GNL | Global Net Lease, Inc. | 19.64 | 10.9 | 1,642.4 | 369.2 | 4,014.0 |
| GOGL | Golden Ocean Group Ltd. | 6.16 | 6.4 | 903.0 | 14.8 | 94.6 |
| GOOD | Gladstone Commercial Corp. | 21.52 | 7.0 | 665.5 | 342.1 | 2,402.0 |
| GPMT | Granite Point Mortgage Trust, Inc. | 19.11 | 8.7 | 1,025.9 | 13.1 | 113.6 |
| GPP | Green Plains Partners LP | 14.39 | 13.2 | 333.0 | 8.0 | 105.1 |
| GPS | Gap, Inc. | 19.55 | 5.0 | 7,332.7 | 7.0 | 35.1 |
| GSBD | Goldman Sachs BDC, Inc. | 20.13 | 8.9 | 812.9 | 21.7 | 193.8 |
| GSM | Ferroglobe PLC | 1.53 | 8.0 | 253.7 | 10.2 | 82.0 |
| HCAP | Harvest Capital Credit Corp. | 10.19 | 10.9 | 62.9 | 21.2 | 231.0 |
| HCFT | Hunt Companies Finance Trust, Inc. | 3.38 | 7.5 | 79.3 | -3.7 | -27.7 |
| HEP | Holly Energy Partners LP | 29.05 | 9.2 | 3,026.6 | 16.7 | 153.6 |
| HESM | Hess Midstream Partners LP | 20.44 | 6.8 | 1,125.3 | 16.0 | 109.3 |
| HHR | ||||||
| HIHO | Highway Holdings Ltd. | 2.00 | 0.0 | 7.8 | -12.0 | 0.0 |
| HMLP | Höegh Lng Partners LP | 17.91 | 9.6 | 607.8 | 10.4 | 100.1 |
| HP | Helmerich & Payne, Inc. | 49.62 | 0.0 | 5,407.1 | -72.6 | 0.0 |
| HPT | Hospitality Properties Trust | 24.63 | 8.5 | 4,081.4 | 12.2 | 104.4 |
| HRZN | Horizon Technology Finance Corp. | 12.15 | 9.9 | 164.6 | 9.8 | 96.4 |
| HT | Hersha Hospitality Trust | 16.08 | 6.6 | 666.3 | -30.3 | -200.0 |
| HTGC | Hercules Capital, Inc. | 13.03 | 9.5 | 1,359.7 | 9.2 | 87.2 |
| HX | ||||||
| IEP | Icahn Enterprises LP | 78.87 | 9.2 | 15,412.4 | 9.4 | 86.8 |
| IGT | International Game Technology Plc | 13.49 | 5.7 | 2,842.6 | 22.6 | 129.6 |
| ILPT | Industrial Logistics Properties Trust | 21.53 | 6.1 | 1,397.1 | 21.1 | 129.6 |
| ING | ||||||
| INN | Summit Hotel Properties, Inc. | 11.36 | 6.2 | 1,215.8 | 14.8 | 92.1 |
| IPHS | Innophos Holdings, Inc. | 27.27 | 7.0 | 537.4 | 15.8 | 110.9 |
| IRM | Iron Mountain, Inc. | 29.72 | 8.0 | 8,569.1 | 29.0 | 233.0 |
| IRT | Independence Realty Trust, Inc. | 12.43 | 5.8 | 1,122.2 | 43.9 | 255.7 |
| IVR | Invesco Mortgage Capital, Inc. | 16.62 | 10.3 | 1,846.7 | -48.0 | -495.4 |
| IVZ | Invesco Ltd. | 19.14 | 6.2 | 9,351.0 | 13.1 | 82.1 |
| IX | ||||||
| JCAP | Jernigan Capital, Inc. | 20.01 | 7.0 | 432.6 | 9.1 | 64.2 |
| JE | Just Energy Group, Inc. | 3.49 | 10.9 | 522.5 | -5.2 | -57.1 |
| JHG | Janus Henderson Group Plc | 20.68 | 6.5 | 4,328.5 | 9.1 | 59.1 |
| JMP | JMP Group LLC | 3.72 | 0.0 | 79.1 | 19.7 | 0.0 |
| KEN | Kenon Holdings Ltd. | 20.85 | 0.0 | 1,122.3 | -9.1 | 0.0 |
| KFFB | Kentucky First Federal Bancorp | 7.63 | 5.1 | 64.7 | 121.5 | 625.7 |
| KHC | The Kraft Heinz Co. | 32.11 | 7.9 | 38,842.9 | -3.8 | -30.0 |
| KIM | Kimco Realty Corp. | 19.32 | 5.8 | 8,176.0 | 24.0 | 138.8 |
| KNOP | KNOT Offshore Partners LP | 19.52 | 10.7 | 637.9 | 10.3 | 109.4 |
| KREF | KKR Real Estate Finance Trust, Inc. | 20.15 | 8.6 | 1,153.4 | 12.7 | 109.1 |
| KRG | Kite Realty Group Trust | 16.04 | 7.9 | 1,343.0 | -43.6 | -346.4 |
| KRP | Kimbell Royalty Partners LP | 16.20 | 10.5 | 759.9 | ||
| KSS | Kohl's Corp. | 54.42 | 4.7 | 8,636.0 | 11.3 | 53.0 |
| LADR | Ladder Capital Corp. | 17.03 | 9.2 | 2,035.9 | 11.1 | 101.5 |
| LAZ | Lazard Ltd. | 38.70 | 4.6 | 5,014.2 | 11.6 | 53.9 |
| LB | L Brands, Inc. | 25.85 | 8.2 | 7,115.8 | 11.2 | 91.1 |
| LKSD | LSC Communications, Inc. | 1.12 | 91.2 | 38.2 | -0.3 | -24.7 |
| LMRK | Landmark Infrastructure Partners LP | 16.67 | 8.8 | 420.7 | 4.0 | 35.8 |
| LOAN | Manhattan Bridge Capital, Inc. | 6.34 | 7.5 | 61.5 | 13.5 | 101.6 |
| LVS | Las Vegas Sands Corp. | 60.69 | 5.0 | 47,265.0 | 24.3 | 120.2 |
| LYG | ||||||
| LYTS | LSI Industries, Inc. | 4.08 | 5.1 | 102.5 | -5.4 | -27.2 |
| M | Macy's, Inc. | 22.72 | 6.7 | 6,958.9 | 6.3 | 42.5 |
| MAC | Macerich Co. | 33.11 | 8.9 | 5,075.9 | 46.3 | 412.5 |
| MAIN | Main Street Capital Corp. | 42.40 | 5.5 | 2,671.3 | 14.7 | 80.7 |
| MARPS | Marine Petroleum Trust | 2.06 | 17.4 | 4.1 | 6.1 | 106.8 |
| MBT | ||||||
| MC | Moelis & Co. | 35.94 | 5.3 | 2,666.9 | 14.9 | 78.8 |
| MCC | Medley Capital Corp. | 2.76 | 12.5 | 152.0 | -1.8 | -22.2 |
| MDLY | Medley Management, Inc. | 3.37 | 0.0 | 19.0 | -8.4 | 0.0 |
| MDRR | Medalist Diversified REIT, Inc. | 4.27 | 4.2 | 19.1 | -3.8 | -16.0 |
| MFA | MFA Financial, Inc. | 7.27 | 11.0 | 3,262.0 | 10.7 | 118.4 |
| MFGP | ||||||
| MGP | MGM Growth Properties LLC | 29.72 | 6.0 | 2,692.1 | 30.8 | 184.4 |
| MHLD | Maiden Holdings Ltd. | 0.50 | 39.9 | 41.6 | -0.1 | -3.3 |
| MIC | Macquarie Infrastructure Corp. | 41.71 | 9.6 | 3,594.1 | 27.6 | 264.4 |
| MITT | AG Mortgage Investment Trust, Inc. | 16.41 | 12.2 | 537.4 | 60.5 | 736.0 |
| MMLP | Martin Midstream Partners LP | 6.04 | 29.7 | 228.9 | -1.5 | -45.6 |
| MMP | Magellan Midstream Partners LP | 66.18 | 5.9 | 14,953.5 | 11.4 | 67.1 |
| MNDO | MIND C.T.I. Ltd. | 2.23 | 0.0 | 43.6 | 7.9 | 0.0 |
| MO | Altria Group, Inc. | 47.79 | 6.6 | 90,602.9 | 14.2 | 93.6 |
| MPLX | MPLX LP | 29.44 | 8.6 | 23,338.0 | 12.8 | 110.3 |
| MPVD | Mountain Province Diamonds, Inc. | 0.95 | 3.2 | 201.7 | -16.0 | -51.1 |
| MPW | Medical Properties Trust, Inc. | 17.68 | 5.6 | 7,918.2 | 6.5 | 36.6 |
| MRCC | Monroe Capital Corp. | 11.42 | 12.2 | 235.1 | 19.6 | 238.6 |
| MSB | Mesabi Trust | 27.45 | 0.0 | 360.5 | 8.2 | 0.0 |
| MTLPR | 0.00 | 0.0 | 0.0 | |||
| MTR | Mesa Royalty Trust | 10.37 | 10.0 | 21.8 | 8.8 | 88.6 |
| MVC | MVC Capital, Inc. | 9.65 | 6.3 | 170.0 | 32.2 | 201.7 |
| MVO | MV Oil Trust | 7.96 | 19.2 | 90.6 | 5.3 | 101.1 |
| NAT | Nordic American Tankers Ltd. | 2.07 | 8.2 | 293.9 | -4.2 | -34.5 |
| NBLX | Noble Midstream Partners LP | 30.89 | 7.1 | 740.9 | 7.7 | 54.5 |
| NCMI | National CineMedia, Inc. | 7.29 | 9.4 | 1,689.5 | 18.5 | 173.8 |
| NEWM | New Media Investment Group, Inc. | 10.58 | 14.1 | 645.2 | 63.0 | 886.2 |
| NEWT | Newtek Business Services Corp. | 21.67 | 8.1 | 424.2 | 11.1 | 90.3 |
| NEXA | Nexa Resources SA | 8.71 | 6.8 | 1,178.9 | 169.1 | 1,146.7 |
| NGG | ||||||
| NGL | NGL Energy Partners LP | 15.60 | 10.2 | 1,931.1 | 7.8 | 79.2 |
| NHI | National Health Investors, Inc. | 80.29 | 5.1 | 3,460.2 | 22.4 | 113.1 |
| NHTC | Natural Health Trends Corp. | 7.46 | 8.1 | 84.2 | 4.2 | 33.8 |
| NLSN | Nielsen Holdings Plc | 23.33 | 6.1 | 8,140.8 | -11.2 | -68.2 |
| NLY | Annaly Capital Management, Inc. | 9.72 | 12.4 | 14,081.5 | -6.1 | -76.0 |
| NMFC | New Mountain Finance Corp. | 13.81 | 9.8 | 1,199.5 | 11.6 | 113.6 |
| NMM | Navios Maritime Partners LP | 16.76 | 7.1 | 185.9 | -6.6 | -46.6 |
| NNA | Navios Maritime Acquisition Corp. | 6.21 | 18.8 | 913.0 | -1.0 | -19.5 |
| NOK | ||||||
| NRP | Natural Resource Partners LP | 29.98 | 6.2 | 358.6 | 3.1 | 18.9 |
| NRT | North European Oil Royalty Trust | 7.24 | 10.7 | 66.7 | 9.4 | 100.5 |
| NRZ | New Residential Investment Corp. | 15.85 | 12.8 | 6,513.9 | 18.9 | 241.0 |
| NS | NuStar Energy LP | 29.08 | 8.3 | 3,106.8 | -4.4 | -36.9 |
| NTB | The Bank of N.T. Butterfield & Son Ltd. | 31.39 | 5.2 | 1,713.6 | 8.9 | 46.4 |
| NTRSP | Northern Trust Corp. | 25.35 | 0.0 | 5,453.9 | ||
| NVEC | NVE Corp. | 68.44 | 5.8 | 333.3 | 23.4 | 136.1 |
| NWL | Newell Brands, Inc. | 14.24 | 6.5 | 5,986.9 | -0.8 | -5.5 |
| NYCB | New York Community Bancorp, Inc. | 11.52 | 6.1 | 5,234.3 | 14.8 | 89.7 |
| NYMT | New York Mortgage Trust, Inc. | 6.11 | 13.1 | 1,426.6 | 9.2 | 120.4 |
| OAK | Oaktree Capital Group LLC | 50.65 | 6.0 | 8,060.7 | 16.8 | 101.6 |
| OCSI | Oaktree Strategic Income Corp. | 8.29 | 7.4 | 244.0 | 23.0 | 169.4 |
| OCSL | Oaktree Specialty Lending Corp. | 5.32 | 7.1 | 754.1 | 5.0 | 35.6 |
| ODP | Office Depot, Inc. | 2.04 | 5.1 | 1,076.2 | 15.4 | 78.3 |
| OFS | OFS Capital Corp. | 11.09 | 12.0 | 151.1 | 15.2 | 182.5 |
| OHAI | OHA Investment Corp. | 1.07 | 7.4 | 21.8 | -2.1 | -15.3 |
| OHI | Omega Healthcare Investors, Inc. | 36.60 | 7.2 | 7,830.2 | 27.7 | 200.4 |
| OKE | ONEOK, Inc. | 69.74 | 5.0 | 27,741.3 | 23.5 | 116.5 |
| OLP | One Liberty Properties, Inc. | 28.95 | 6.3 | 566.7 | 30.7 | 192.2 |
| OMP | Oasis Midstream Partners LP | 21.81 | 7.7 | 736.7 | 8.9 | 69.0 |
| OPI | Office Properties Income Trust | 27.98 | 20.5 | 1,342.7 | -25.0 | -511.1 |
| ORAN | ||||||
| ORC | Orchid Island Capital, Inc. | 6.29 | 14.2 | 382.3 | -22.1 | -314.6 |
| ORIT | Oritani Financial Corp. | 18.19 | 5.5 | 817.6 | 15.2 | 83.7 |
| OSB | Norbord, Inc. | 23.03 | 19.7 | 1,932.3 | 7.2 | 142.8 |
| OUT | OUTFRONT Media, Inc. | 27.37 | 5.3 | 3,856.7 | 37.2 | 196.9 |
| OXSQ | Oxford Square Capital Corp. | 6.71 | 12.0 | 318.8 | -14.2 | -170.1 |
| OXY | Occidental Petroleum Corp. | 51.49 | 5.9 | 39,265.9 | 9.7 | 57.4 |
| PAA | Plains All American Pipeline LP | 23.87 | 5.0 | 17,407.4 | 6.4 | 32.3 |
| PACW | PacWest Bancorp | 38.73 | 6.1 | 4,679.3 | 10.0 | 61.6 |
| PAGP | Plains GP Holdings LP | 24.15 | 5.0 | 19,301.2 | 8.6 | 42.6 |
| PBFX | PBF Logistics LP | 21.76 | 9.2 | 1,342.9 | 13.3 | 121.9 |
| PBI | Pitney Bowes, Inc. | 4.10 | 15.5 | 713.9 | 4.1 | 64.1 |
| PBT | Permian Basin Royalty Trust | 5.35 | 10.3 | 249.4 | 9.7 | 100.2 |
| PEB | Pebblebrook Hotel Trust | 28.43 | 5.3 | 3,719.1 | -70.5 | -376.6 |
| PEGI | Pattern Energy Group, Inc. | 24.19 | 6.9 | 2,390.4 | -105.7 | -733.2 |
| PEI | Pennsylvania Real Estate Investment Trust | 5.88 | 12.6 | 515.4 | -3.3 | -41.3 |
| PER | SandRidge Permian Trust | 1.94 | 24.0 | 101.3 | 4.2 | 100.5 |
| PETS | PetMed Express, Inc. | 17.06 | 6.4 | 338.6 | 11.4 | 72.9 |
| PFLT | PennantPark Floating Rate Capital Ltd. | 11.77 | 9.7 | 457.1 | 29.3 | 283.1 |
| PHI | ||||||
| PK | Park Hotels & Resorts, Inc. | 26.65 | 7.5 | 5,414.4 | 12.8 | 96.0 |
| PM | Philip Morris International, Inc. | 85.15 | 5.3 | 134,269.0 | 16.9 | 89.5 |
| PMD | Psychemedics Corp. | 9.27 | 7.9 | 50.3 | 14.4 | 113.8 |
| PMT | PennyMac Mortgage Investment Trust | 22.24 | 8.5 | 1,697.1 | 9.1 | 76.7 |
| PNNT | PennantPark Investment Corp. | 6.69 | 10.8 | 446.5 | 15.0 | 161.7 |
| POPE | Pope Resources LP | 69.52 | 5.0 | 304.4 | 71.2 | 357.1 |
| PPL | PPL Corp. | 29.85 | 5.5 | 21,450.2 | 11.5 | 63.5 |
| PRT | PermRock Royalty Trust | 7.98 | 18.3 | 96.7 | 5.5 | 100.3 |
| PSEC | Prospect Capital Corp. | 6.66 | 10.8 | 2,451.3 | 11.1 | 119.9 |
| PSXP | Phillips 66 Partners LP | 52.12 | 6.3 | 6,429.3 | 11.5 | 72.3 |
| PTMN | Portman Ridge Finance Corp. | 2.37 | 17.1 | 87.4 | -3.8 | -65.7 |
| PVL | Permianville Royalty Trust | 2.52 | 17.1 | 83.2 | 6.4 | 108.9 |
| PZN | Pzena Investment Management, Inc. | 8.29 | 1.5 | 576.8 | 11.2 | 16.2 |
| QIWI | ||||||
| QUAD | Quad/Graphics, Inc. | 11.15 | 13.9 | 443.8 | -15.9 | -221.7 |
| RBS | ||||||
| RC | Ready Capital Corp. | 15.32 | 10.5 | 489.6 | 7.0 | 73.3 |
| RDS.A | ||||||
| RDS.B | ||||||
| RESI | Front Yard Residential Corp. | 12.19 | 4.9 | 654.8 | -5.4 | -26.3 |
| RIO | ||||||
| RLGY | Realogy Holdings Corp. | 5.32 | 6.9 | 597.3 | 7.0 | 48.5 |
| RLJ | RLJ Lodging Trust | 17.54 | 7.5 | 3,073.6 | 18.5 | 137.9 |
| RMCF | Rocky Mountain Chocolate Factory, Inc. | 9.00 | 5.4 | 53.5 | 22.1 | 118.2 |
| ROYT | Pacific Coast Oil Trust | 2.18 | 13.0 | 84.9 | 7.5 | 98.1 |
| RPAI | Retail Properties of America, Inc. | 11.99 | 5.6 | 2,537.4 | 38.6 | 215.5 |
| RPT | RPT Realty | 12.21 | 7.3 | 969.9 | 74.4 | 540.8 |
| RRD | R.R. Donnelley & Sons Co. | 2.06 | 6.6 | 128.1 | -38.5 | -255.3 |
| RWT | Redwood Trust, Inc. | 17.00 | 7.1 | 1,645.0 | 11.6 | 81.6 |
| SALM | Salem Media Group, Inc. | 2.10 | 12.4 | 43.1 | -15.2 | -188.6 |
| SAN | ||||||
| SAR | Saratoga Investment Corp. | 25.15 | 8.3 | 203.3 | 8.5 | 70.1 |
| SBR | Sabine Royalty Trust | 46.58 | 7.7 | 676.2 | 12.8 | 98.4 |
| SBRA | Sabra Health Care REIT, Inc. | 20.80 | 8.6 | 3,760.5 | 28.0 | 240.4 |
| SCM | Stellus Capital Investment Corp. | 14.46 | 9.3 | 233.1 | 8.0 | 74.5 |
| SDLP | Seadrill Partners LLC | 2.45 | 134.2 | 17.4 | 1.4 | 192.3 |
| SDR | Sandridge Mississippian Trust II | 0.62 | 31.0 | 30.6 | 3.2 | 99.5 |
| SDT | Sandridge Mississippian Trust I | 0.63 | 29.5 | 17.5 | 3.4 | 99.1 |
| SELF | Global Self Storage, Inc. | 4.20 | 6.2 | 32.4 | 43.7 | 271.2 |
| SEMG | SemGroup Corp. | 12.24 | 15.8 | 954.6 | -23.2 | -365.9 |
| SFL | Ship Finance International Ltd. | 13.25 | 10.6 | 1,417.2 | 17.2 | 182.8 |
| SGU | Star Group LP | 9.67 | 4.9 | 484.8 | 13.1 | 63.6 |
| SHI | ||||||
| SHLX | Shell Midstream Partners LP | 21.84 | 6.9 | 5,062.4 | 12.3 | 84.8 |
| SIG | Signet Jewelers Ltd. | 18.38 | 7.2 | 944.1 | -4.7 | -33.8 |
| SITC | SITE Centers Corp. | 14.20 | 5.7 | 2,551.3 | 443.8 | 2,512.4 |
| SIX | Six Flags Entertainment Corp. | 52.53 | 6.1 | 4,462.4 | 16.1 | 98.8 |
| SJT | San Juan Basin Royalty Trust | 3.39 | 12.2 | 145.4 | 8.9 | 108.7 |
| SKIS | Peak Resorts, Inc. | 10.86 | 2.6 | 165.2 | 36.2 | 93.5 |
| SKT | Tanger Factory Outlet Centers, Inc. | 16.10 | 8.6 | 1,537.6 | 18.5 | 158.6 |
| SLB | Schlumberger NV | 40.04 | 5.1 | 54,698.0 | 26.5 | 134.1 |
| SLRC | Solar Capital Ltd. | 20.81 | 7.9 | 881.8 | 12.3 | 96.3 |
| SMLP | Summit Midstream Partners LP | 7.92 | 29.2 | 651.6 | -23.3 | -679.9 |
| SMTA | Spirit MTA REIT | 8.43 | 11.7 | 366.0 | -1.4 | -15.9 |
| SNH | Senior Housing Properties Trust | 8.36 | 18.5 | 2,004.1 | 10,443.8 | 193,265.1 |
| SNP | ||||||
| SNR | New Senior Investment Group, Inc. | 7.19 | 9.1 | 586.2 | -3.7 | -34.1 |
| SOHO | Sotherly Hotels, Inc. | 7.14 | 7.0 | 100.4 | -13.6 | -95.2 |
| SPG | Simon Property Group, Inc. | 161.59 | 5.0 | 106,502.8 | 22.6 | 112.9 |
| SPH | Suburban Propane Partners LP | 24.66 | 9.8 | 1,504.0 | 18.8 | 184.7 |
| SPKE | Spark Energy, Inc. | 11.00 | 6.6 | 384.4 | 37.3 | 245.8 |
| SPTN | SpartanNash Co. | 12.15 | 6.1 | 437.2 | 15.2 | 91.9 |
| SQM | ||||||
| SRC | Spirit Realty Capital, Inc. | 44.42 | 6.2 | 4,418.1 | 28.7 | 178.3 |
| SRLP | Sprague Resources LP | 18.91 | 14.0 | 431.8 | 14.0 | 196.2 |
| SSI | Stage Stores, Inc. | 0.73 | 0.0 | 21.2 | -0.2 | 0.0 |
| SSW | Seaspan Corp. | 10.34 | 4.9 | 2,201.3 | 4.6 | 22.4 |
| STAY | Extended Stay America, Inc. | 16.79 | 5.2 | 4,210.8 | 26.6 | 139.4 |
| STWD | Starwood Property Trust, Inc. | 23.33 | 8.3 | 6,491.7 | 17.9 | 148.0 |
| STX | Seagate Technology Plc | 46.85 | 5.3 | 13,133.4 | 9.0 | 47.6 |
| SUN | Sunoco LP | 33.95 | 9.8 | 3,348.8 | 20.1 | 196.2 |
| SUNS | Solar Senior Capital Ltd. | 16.80 | 8.4 | 270.2 | 17.2 | 143.9 |
| SUP | Superior Industries International, Inc. | 2.58 | 13.9 | 65.0 | 26.5 | 369.0 |
| SWM | Schweitzer-Mauduit International, Inc. | 34.63 | 5.0 | 1,070.4 | 11.7 | 58.5 |
| SXCP | SunCoke Energy Partners LP | 12.54 | 12.8 | 579.7 | 11.9 | 151.9 |
| T | AT&T, Inc. | 34.31 | 5.9 | 249,684.9 | 14.4 | 85.5 |
| TCO | Taubman Centers, Inc. | 40.52 | 6.5 | 2,490.6 | 54.8 | 358.1 |
| TCP | TC Pipelines LP | 40.88 | 6.4 | 2,985.3 | -15.0 | -95.8 |
| TCPC | Blackrock TCP Capital Corp. | 14.11 | 10.2 | 832.1 | 19.6 | 199.1 |
| TCRD | THL Credit, Inc. | 6.66 | 15.2 | 214.1 | -13.1 | -199.2 |
| TEF | ||||||
| TEN | Tenneco, Inc. | 9.10 | 10.9 | 740.4 | -12.3 | -134.5 |
| TERP | TerraForm Power, Inc. | 15.58 | 5.0 | 3,239.6 | -56.4 | -281.0 |
| TFSL | TFS Financial Corp. | 17.86 | 5.5 | 5,126.6 | 62.4 | 340.7 |
| TGA | TransGlobe Energy Corp. | 1.48 | 4.7 | 107.3 | 6.3 | 30.0 |
| TGE | Tallgrass Energy LP | 19.26 | 10.5 | 5,404.4 | 17.5 | 183.7 |
| TGLS | Tecnoglass, Inc. | 7.22 | 5.8 | 318.5 | 51.0 | 293.2 |
| TGP | Teekay LNG Partners LP | 14.72 | 3.8 | 1,151.5 | 38.6 | 147.5 |
| TGS | ||||||
| TI.A | ||||||
| TK | Teekay Corp. | 4.50 | 5.0 | 441.0 | -3.2 | -15.9 |
| TLRD | Tailored Brands, Inc. | 4.93 | 14.6 | 249.1 | 3.2 | 46.9 |
| TNP | Tsakos Energy Navigation Ltd. | 3.05 | 4.9 | 266.3 | -2.3 | -11.6 |
| TOT | ||||||
| TPVG | TriplePoint Venture Growth BDC Corp. | 14.95 | 9.7 | 370.3 | 8.3 | 80.3 |
| TRGP | Targa Resources Corp. | 38.95 | 9.4 | 9,036.3 | -50.6 | -473.9 |
| TRMT | Tremont Mortgage Trust | 4.38 | 2.5 | 36.5 | -163.4 | -403.9 |
| TRTN | Triton International Ltd. | 33.25 | 6.2 | 2,478.0 | 7.6 | 47.2 |
| TRTX | TPG RE Finance Trust, Inc. | 19.87 | 8.7 | 1,456.8 | 11.8 | 103.0 |
| TSCAP | TriState Capital Holdings, Inc. | 26.89 | 0.0 | 788.9 | ||
| TSLX | TPG Specialty Lending, Inc. | 19.73 | 7.9 | 1,305.4 | 10.4 | 81.8 |
| TSQ | Townsquare Media, Inc. | 5.49 | 5.4 | 104.7 | -7.8 | -42.4 |
| TTS | Tile Shop Holdings, Inc. | 2.67 | 7.5 | 134.1 | 51.6 | 389.8 |
| TUP | Tupperware Brands Corp. | 15.25 | 12.4 | 749.6 | 5.6 | 69.4 |
| TUSK | Mammoth Energy Services, Inc. | 6.70 | 5.9 | 286.3 | 1.4 | 8.5 |
| TWO | Two Harbors Investment Corp. | 13.49 | 14.0 | 3,675.1 | -8.0 | -111.2 |
| TX | ||||||
| UAN | CVR Partners LP | 4.02 | 4.8 | 452.0 | -219.7 | -1,046.1 |
| UBA | Urstadt Biddle Properties, Inc. | 21.76 | 5.0 | 863.0 | 37.0 | 186.1 |
| UBP | Urstadt Biddle Properties, Inc. | 16.75 | 6.5 | 666.9 | 28.2 | 184.0 |
| UBS | UBS Group AG | 11.21 | 0.0 | 41,174.3 | 9.2 | 0.0 |
| UE | Urban Edge Properties | 16.88 | 5.2 | 2,028.8 | 17.6 | 92.2 |
| UG | United-Guardian, Inc. | 19.92 | 5.2 | 92.8 | 20.3 | 105.8 |
| UMC | ||||||
| UMH | UMH Properties, Inc. | 13.34 | 5.5 | 521.5 | -21.7 | -118.5 |
| UMPQ | Umpqua Holdings Corp. | 17.55 | 4.8 | 3,867.6 | 10.8 | 51.8 |
| USAC | USA Compression Partners LP | 17.74 | 11.9 | 1,697.5 | -58.5 | -699.1 |
| USDP | USD Partners LP | 11.88 | 12.0 | 313.8 | 20.6 | 247.4 |
| VEDL | ||||||
| VEON | ||||||
| VER | VEREIT, Inc. | 9.21 | 6.0 | 8,993.4 | -76.4 | -454.6 |
| VET | Vermilion Energy, Inc. | 18.10 | 12.0 | 2,661.3 | 10.4 | 125.4 |
| VGR | Vector Group Ltd. | 11.90 | 13.0 | 1,698.6 | 29.0 | 376.1 |
| VICI | VICI Properties, Inc. | 21.49 | 5.2 | 8,831.8 | 14.6 | 76.4 |
| VIV | ||||||
| VNOM | Viper Energy Partners LP | 32.45 | 6.8 | 4,083.7 | 47.6 | 325.6 |
| VOC | VOC Energy Trust | 5.63 | 13.3 | 95.0 | 7.6 | 100.7 |
| VOD | ||||||
| WBK | ||||||
| WDR | Waddell & Reed Financial, Inc. | 17.59 | 5.7 | 1,297.3 | 8.6 | 48.7 |
| WES | Western Midstream Partners LP | 26.40 | 7.8 | 13,814.6 | 16.6 | 130.1 |
| WHF | WhiteHorse Finance, Inc. | 14.02 | 10.1 | 288.9 | 5.7 | 57.6 |
| WHG | Westwood Holdings Group, Inc. | 31.62 | 8.9 | 282.2 | 13.9 | 123.3 |
| WLKP | Westlake Chemical Partners LP | 23.50 | 7.1 | 826.6 | 14.5 | 102.8 |
| WMB | The Williams Cos., Inc. | 24.89 | 5.6 | 30,318.5 | -1,250.8 | -6,998.6 |
| WMC | Western Asset Mortgage Capital Corp. | 10.30 | 12.1 | 547.1 | 14.0 | 168.9 |
| WPG | Washington Prime Group, Inc. | 3.65 | 27.0 | 692.2 | 20.4 | 548.9 |
| WPP | ||||||
| WRI | Weingarten Realty Investors | 28.01 | 5.7 | 3,578.9 | 21.5 | 122.2 |
| WRK | WestRock Co. | 36.66 | 4.8 | 9,549.1 | 11.0 | 52.5 |
| WSR | Whitestone REIT | 12.89 | 8.8 | 513.4 | 31.0 | 274.2 |
| WSTG | Wayside Technology Group, Inc. | 11.69 | 6.0 | 51.5 | 15.5 | 92.5 |
| WY | Weyerhaeuser Co. | 25.80 | 5.2 | 19,435.2 | 5,608.7 | 29,236.6 |
| XAN | Exantas Capital Corp. | 11.32 | 5.5 | 359.1 | 14.1 | 78.2 |
| XHR | Xenia Hotels & Resorts, Inc. | 21.74 | 5.0 | 2,464.6 | 15.8 | 79.5 |
| XIN | ||||||
| Ticker | Name | Price | Dividend Yield | Market Cap ($M) | P/E Ratio | Payout Ratio |
Table Of Contents
The 10 highest-yielding securities with Dividend Risk scores of C or better are listed in order by dividend yield, from lowest to highest.
- Newell Brands (NWL)
- Altria Group (MO)
- Invesco Ltd. (IVZ)
- Gladstone Commercial Corp. (GOOD)
- Inter Pipeline (IPPLF)
- Bed Bath & Beyond (BBBY)
- Gladstone Capital (GLAD)
- Energy Transfer LP (ET)
- Tanger Factory Outlets (SKT)
- Imperial Brands plc (IMBBY)
10. Newell Brands (NWL)
- Dividend Yield: 6.1%
Newell Brands is a consumer products company. Its core brands include Rubbermaid, Oster, Sunbeam, Mr. Coffee, Ball, Sharpie, Paper Mate, Elmer’s, Yankee Candle, and Coleman.
Newell is involved in a significant turnaround. In an effort to become more efficient, Newell is selling under-performing brands that are no longer a part of its future growth strategy.
For example, Newell sold the Waddington and Rawlings brands, as well as Goody Products. More recently, Newell sold its Pure Fishing and Jostens brands for $2.5 billion of after-tax proceeds. It also sold its Rexair and Process Solutions businesses for over $730 million.
The remaining assets for sale are expected to generate between $675 million and $775 million in after-tax proceeds. Newell can use a portion of these proceeds to pay down debt, which will help improve its balance sheet. The company now expects to achieve a gross debt- to-EBITDA ratio of less than 4.0x by the end of 2019, and approximately 3.5x by the end of 2020.
These divestitures will also allow Newell to focus on its core brands. in which it retains a leadership position. This will also give the company the opportunity to drastically cut costs, to produce higher margins.
Source: Investor Presentation
The impact of these divestitures will reduce sales, but Newell can use the proceeds of the asset sales to reduce debt, buy back stock, and invest in new growth areas. This will help keep the company highly profitable, which fuels its dividends to shareholders.
The company has made notable progress in these efforts. In 2018, Newell’s core sales declined 5.2%, while adjusted earnings-per-share declined just 2.5% to $2.68.
Newell reported second-quarter earnings on 5/3/19 and results again showed improvement in the company’s ongoing turnaround. Revenue of $2.1 billion declined 3.6% from the same quarter a year ago, but was still in-line with analyst expectations. Adjusted earnings-per-share of $0.45 surpassed expectations by $0.09, a significant beat for Newell.
We continue to expect adjusted EPS of $1.60 for 2019, which would sufficiently cover the company’s annual dividend of $0.92 per share. As a result, we continue to view the dividend as safe, and attractive at a 6.1% yield.
9. Altria Group Inc. (MO)
- Dividend Yield: 6.7%
Altria Group is a tobacco products giant. Its core tobacco business holds the flagship Marlboro cigarette brand. Altria also has non-smokable brands Skoal and Copenhagen chewing tobacco, Ste. Michelle wine, and owns a 10% investment stake in global beer giant Anheuser Busch Inbev (BUD).
Related: The Best Tobacco Stocks Now, Ranked In Order
In late July, Altria reported strong second-quarter earnings. Net revenue of $6.6 billion increased 5% from the same quarter last year. Revenue net of excise taxes increased 6.4% year-over-year, and beat analyst expectations by $110 million. Adjusted earnings-per-share increased 9% to $1.10, and matched analyst expectations.
The core smokeable products segment reported 7.4% revenue growth, net of excise taxes, primarily driven by higher pricing which offset a 7% decline in smokeable product shipment volumes.
Altria’s key challenge going forward will be to generate growth in an era of falling smoking rates. Consumers are increasingly giving up traditional cigarettes, which on the surface poses an existential threat to tobacco manufacturers. Altria expects cigarette volumes will continue to decline at a 4% to 6% annual rate over the next five years.
For this reason, Altria has made significant investments in new categories, highlighted by the $13 billion purchase of a 35% stake in e-vapor giant JUUL. This acquisition gives Altria exposure to a high-growth category that is actively contributing to the decline in traditional cigarettes.
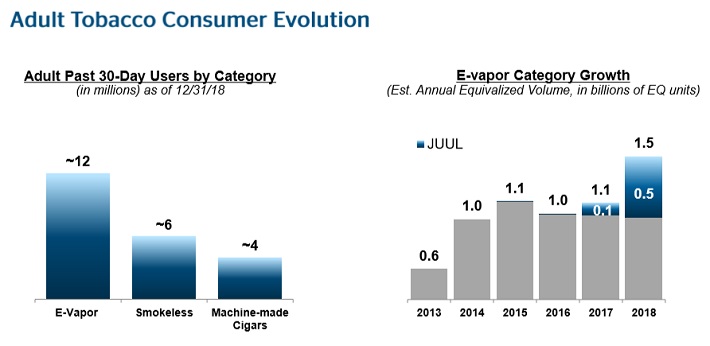
Source: 2019 CAGNY Presentation
Altria also recently announced a $1.8 billion investment in Canadian marijuana producer Cronos Group. Altria purchased a 45% equity stake in the company, as well as a warrant to acquire an additional 10% ownership interest in Cronos Group at a price of C$19.00 per share, exercisable over four years from the closing date.
In the meantime, Altria reaffirmed its guidance for 2019 full-year adjusted diluted EPS to be in a range of $4.15 to $4.27, which would be 4% to 7% growth from 2018.
The video below examines Altria’s dividend safety in detail.
Altria receives top marks in terms of safety, due to its competitive advantages. It operates in a highly regulated industry, which significantly reduces the threat of new competitors entering the market. And, Altria’s products enjoy tremendous brand loyalty, as Marlboro controls more than 40% of U.S. retail market share.
Altria is also highly resistant to recessions. Cigarette and alcohol sales fare very well during recessions, which keeps Altria’s strong profitability and dividend growth intact. With a target dividend payout of 80%, Altria’s dividend is secure.
8. Invesco Ltd. (IVZ)
- Dividend Yield: 7.2%
Invesco is a global investment management firm. It has more than 7,000 employees and serves customers in more than 150 countries. Invesco ended the most recent quarter with assets under management, or AUM, of $954.8 billion.
In late July (7/25/19) Invesco reported financial results for the 2019 second quarter. For the quarter, adjusted net revenue increased 6% to just over $1.0 billion. Adjusted earnings-per-share of $0.65 decreased 1.5% from the same quarter last year.
Invesco is investing heavily in growth, mainly through acquisitions. First, Invesco acquired OppenheimerFunds for ~$5.7 billion. The deal was for $4 billion in preferred shares and 81.9 million Invesco shares. This acquisition is expected to boost earnings-per-share by ~18% in 2019.
This acquisition grew Invesco’s AUM to $1.2 trillion, making it the 6th-largest U.S. retail investment management company.
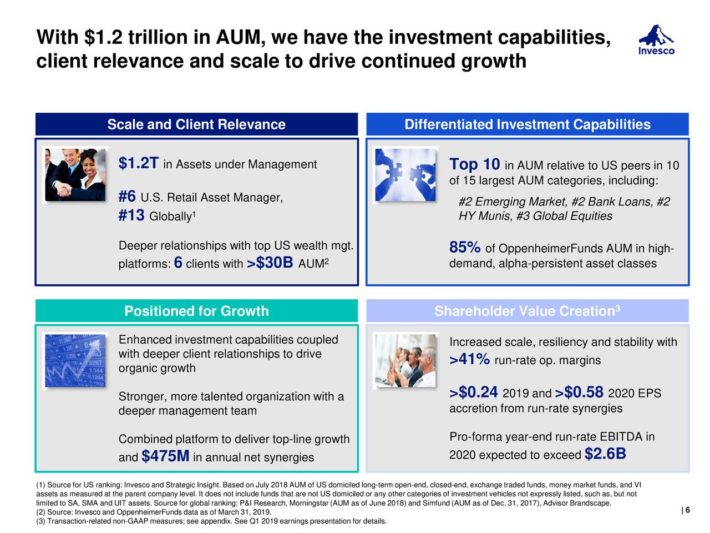
Source: Earnings Slides
Invesco also acquired the ETF business from Guggenheim Investments for $1.2 billion. Invesco also made a significant investment in financial technology with its acquisition of Intelliflo, a leading technology platform for financial advisors that supports approximately 30% of all financial advisors in the U.K. Overall, we conservatively expect 5% earnings growth annually for Invesco over the next five years.
Invesco ranks well in terms of dividend safety with an expected payout ratio of 53% for fiscal 2019. This should allow the company to continue increasing its dividend on an annual basis going forward. Invesco also has a strong balance sheet, with a credit rating of ‘A’ from Standard & Poor’s.
7. Gladstone Commercial Corp. (GOOD)
- Dividend Yield: 7.2%
Gladstone Commercial Corporation is a real estate investment trust, or REIT, that specializes in single-tenant and anchored multi-tenant net leased industrial and office properties across the U.S.
The trust targets primary and secondary markets that possess favorable economic growth trends, growing populations, strong employment, and robust growth trends.
The trust’s stated goal is pay shareholders monthly distributions, which it has done for more than 10 consecutive years. Gladstone owns over 100 properties in 24 states that are leased to 99 unique tenants. It had total assets of $970 million as of June 30th.
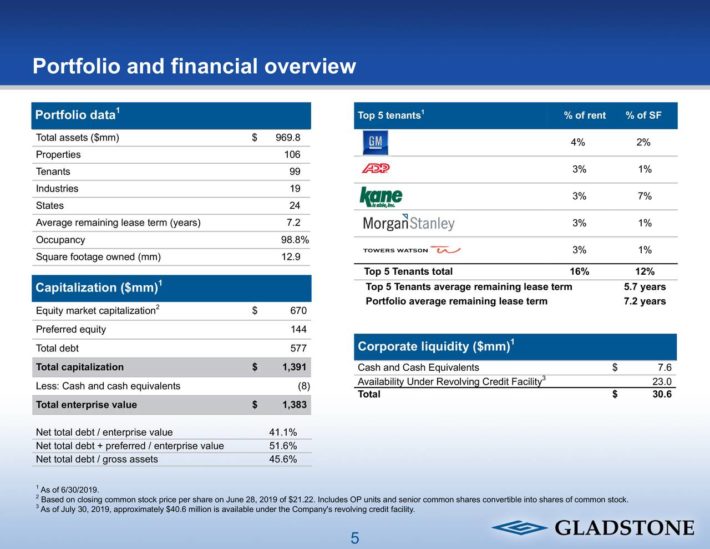
Source: Investor Presentation
Gladstone has a high dividend yield above 7%, which is highly attractive for income investors. Gladstone has generated steady cash flow to pay its hefty dividend, although the company has not produced much growth over the past several years.
Gladstone’s FFO-per-share has been between $1.50 and $1.60 for most of the past decade as the trust continues to issue new shares and debt to fund acquisitions, but those acquisitions did not provide an economic gain. We don’t have any reason to believe this will change moving forward as Gladstone’s common shares are quite expensive to issue, yielding 7% to 9% at most times.
This means that Gladstone will struggle to produce economic gains with its capital issuances given that the yields on its properties are also in the high single digits. As a result, our long-term growth estimate for Gladstone is 0%.
That said, the dividend is likely the reason why investors would be interested in buying Gladstone stock, and from that perspective investors should view the shares more favorably. The distribution has also been flat at $1.50 for the past 10 years as the trust has struggled to grow FFO-per-share, although the payout remains covered by FFO.
6. Inter Pipeline Ltd. (IPPLF)
- Dividend Yield: 7.4%
Inter Pipeline is an energy infrastructure company, based in Canada. Its assets transport, process, and store energy products largely in Western Canada, and at a much smaller scale in Europe.
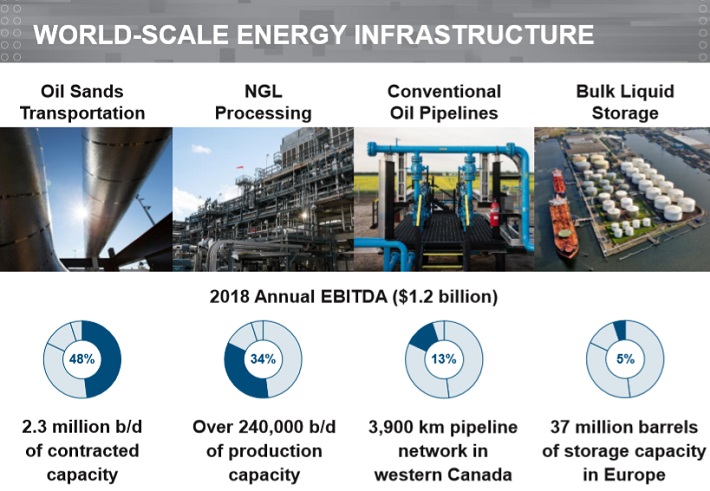
Source: Investor Presentation
Inter Pipeline has paid a cash distribution since 1997, and it has paid an increasing distribution for 10 consecutive years. The stock trades on the Toronto Stock Exchange with the ticker TSX:IPL. It also trades over-the-counter in the U.S. under the ticker IPPLF.
Inter Pipeline operates in four segments. The company estimates 2019 EBITDA diversification as follows: 54% Oil Sands Transportation, 24% Natural Gas Liquids Processing, 12% Conventional Oil Pipelines, and 10% Bulk Liquid Storage.
Inter Pipeline reported its first quarter results on May 9, 2019. In the first quarter, Inter Pipeline generated 2% revenue growth versus the same period a year ago. Funds from operations per share (FFO/S) was down 22% however, as Pipeline volumes (including Oil Sands Transportation and Conventional Oil Pipelines) fell 7%, natural gas liquids processing volumes increased 10%, and bulk liquid storage declined about 4% to 78% capacity.
Lower pipeline volumes were the biggest drag, as they are projected to make up 66% of 2019 EBITDA. For the quarter, growth capital spending more than doubled as the company began its multi-year investment in the Heartland Petrochemical Complex, which is scheduled to complete by late 2021.
This investment should pay off in the form of stronger growth. From 2009 to 2018, Inter Pipeline increased its FFO/S by 9.1% per year. We initially estimate about 14% decline in FFO/S for 2019 after the reported Q1 results. We also expect the FFO/S to stay roughly flat to 2021, until the Heartland project goes into service, which will add materially to cash flow. Inter Pipeline projects Heartland to generate annual EBITDA of approximately US$340 million to $380 million.
With a 2019 projected dividend payout ratio of 71%, Inter Pipeline’s dividend appears to be safe. The company’s strong credit rating of BBB+ further helps boost its dividend safety.
5. Bed Bath & Beyond (BBBY)
- Dividend Yield: 7.6%
Bed Bath & Beyond is a specialty retailer with a wide assortment of domestic merchandise and home furnishings. The company operates under the namesake Bed Bath & Beyond store, along with other stores like Christmas Tree Shops, Harmon, buybuy BABY and World Market. As of June 1st 2019, the $1.4 billion market cap company had 1,536 stores across all 50 states, the District of Columbia, Puerto Rico and Canada including 995 Bed Bath & Beyond stores.
On July 10th, 2019 Bed Bath & Beyond reported Q1 fiscal year 2019 results for the period ending June 1st, 2019. For the quarter Bed Bath & Beyond recorded sales of $2.57 billion, representing a 6.6% decline compared to Q1 2018. The company also reported a net loss of -$2.91 per share (-$371.1 million), due to non-cash goodwill and intangible charges, along with severance and shareholder activity costs.
Excluding these items would have resulted in adjusted earnings-per-share of $0.12 ($15.5 million) compared to $0.38 in the prior year period. Bed Bath & Beyond also updated its outlook for 2019. For this year, the company believes it can earn an adjusted $2.11 to $2.20 per share, excluding impairment, severance and shareholder costs, to go along with $11.4 billion to $11.7 billion in net sales.
Bed Bath & Beyond’s earnings have been in a steep decline in the last three years. Initially, management tried to support earnings-per-share via aggressive share buybacks, with the share count declining 37% between 2012 and 2017.
However, this strategy has not been successful, as the aggressive buybacks were conducted at much higher share prices, and also deprived the company of investing in its business. Now, the retailer is forced to spend high amounts to defend its business and hence it has significantly slowed its pace of buybacks, despite the materially lower share price.
Bed Bath & Beyond is currently fighting on all fronts in order to stop the bleeding. It is spending hefty amounts to improve its online sales, remodel its stores, test market personalization tactics and optimize its supply chain to reduce operating costs. Still, competition remains fierce from e-commerce retailers such as Amazon (AMZN) and many others, although Bed Bath & Beyond management does believe that earnings have hit a bottom.
With an expected 2019 dividend payout ratio of 31%, Bed Bath & Beyond’s dividend appears to be sustainable. However, investors will need to closely monitor the company’s results in future quarters to make sure the turnaround remains on track.
4. Gladstone Capital (GLAD)
- Dividend Yield: 9.1%
Gladstone Capital is a Business Development Corporation, or BDC. It invests primarily in debt and equity instruments. Debt investments consist of senior term loans, senior subordinated loans, and junior subordinated loans, made to small and medium-sized businesses. Loans are typically made in the $7 million to $30 million range, in terms of up to seven years.
It is primarily a debt fund with a target portfolio mix of 90% debt and 10% equity.
On August 5th, the company reported second-quarter earnings results. Total investment income increased 2.9% from the previous quarter, to $12.9 million. Net investment income per share was flat from the previous quarter, at $0.21 per share. This was exactly in-line with the company’s quarterly dividend paid in the three-month period, for a dividend payout ratio of 100% in the most recent quarter.
The company’s portfolio characteristics over the past several quarters can be seen in the video below.
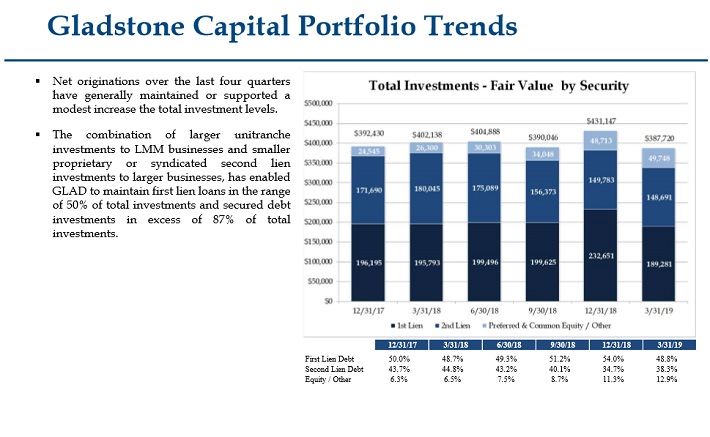
Source: Investor Presentation
As a BDC focused primarily on debt investments, Gladstone’s future NII growth could be restrained by the recent drop in interest rates. The Federal Reserve recently moved to cut the Fed Funds rate for the first time since 2008. Falling interest rates are a headwind for Gladstone, as the company’s rate of return on its debt investments could decline.
Gladstone has already appeared to struggle with covering its dividend, as the company reported a 100% payout ratio in the most recent quarter. As a result, while Gladstone’s high yield above 9% is certainly attractive on the surface, it carries a high level of risk as well.
3. Energy Transfer LP (ET)
- Dividend Yield: 9.2%
Energy Transfer is a midstream oil and gas Master Limited Partnership, or MLP. Energy Transfer’s business model is storage and transportation of oil and gas. Its assets have total gathering capacity of nearly 13 million Btu/day of gas, and a transportation capacity of 22 million Btu/day of natural gas and over 4 million barrels per day of oil.
Energy Transfer’s diversified and fee-based assets provide the company with steady cash flow, even when oil and gas prices decline. As a midstream operator, Energy Transfer’s cash flow relies heavily upon volumes, and less so on commodity prices.
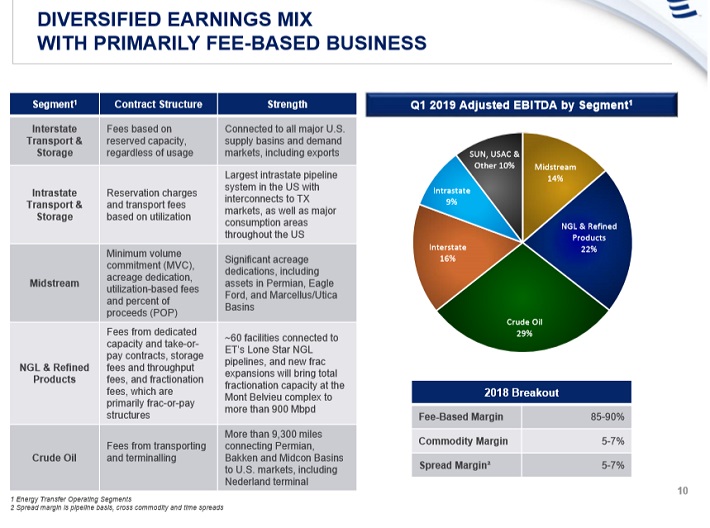
Source: Investor Presentation
On May 8th, 2019 Energy Transfer reported Q1 results for the period ending March 31st, 2019. The first quarter was a record performance for the company across multiple measures. For the quarter, the company reported $2.8 billion of adjusted EBITDA and $1.66 billion of distributable cash flow, both of which set records for Energy Transfer.
Adjusted EBITDA increased 40% year-over-year, while distributable cash increased 39% from the year-ago quarter, backed by impressive performance across all business segments. NGLs, refined products, and crude segments continued to benefit from rising gas demand. In all, Energy Transfer generated $856 million of distributable cash flow in excess of distributions paid to unitholders in the first quarter.
Energy Transfer has an attractive lineup of new projects which will fuel the company’s growth. For example, Energy Transfer announced it will construct a seventh natural gas liquids (NGL) fractionation facility at Mont Belvieu, Texas, with 150,000 barrels per day of capacity. Fractionator VII is scheduled to be operational in the first quarter of 2020 and is fully subscribed by multiple long-term contracts.
The company is also progressing with plans on a Bakken pipeline optimization project, which is expected to start up in 2020. And, Energy Transfer is currently expanding its Permian Express pipeline system by an additional 120,000 barrels per day. The Permian Express 4 expansion is expected to be in-service by the 2019 third quarter.
The company’s new projects will help secure its attractive 8% distribution. Energy Transfer anticipates a distribution coverage ratio of ~1.7x to ~1.9x for 2019, which is better than average for an MLP. In Q1, the company reported distribution coverage of over 2x.
We believe Energy Transfer is capable of delivering distributable cash flow per share of around $2.20 for 2019. Energy Transfer has a very high distribution yield, which is attractive for income investors. And, the distribution appears to be well-covered, and even has room for potential increases if FFO grows in the years ahead.
2. Tanger Factory Outlets (SKT)
- Dividend Yield: 9.3%
Tanger Factory Outlet Centers is a Real Estate Investment Trust. Tanger operates, owns, or has an ownership stake in a portfolio of 40 shopping centers. Properties are located in Canada and 20 U.S. states, totaling approximately 14.4 million square feet, leased to over 500 different tenants.
Tanger’s diversified base of high-quality tenants has led to steady growth for many years.
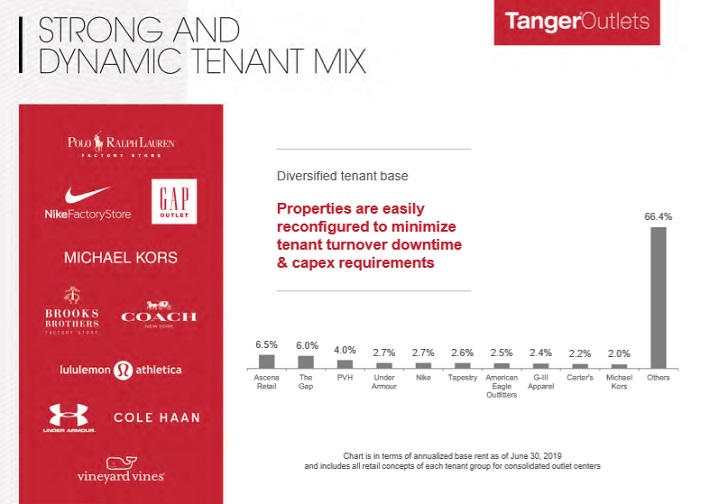
Source: Earnings Slides
Tanger released 2019 second-quarter results on August 5th. It announced adjusted funds from operations (FFO) of $0.57 per share, a decrease of 5% compared with $0.60 per share in the same quarter last year. Tanger grew its occupancy by 60 basis points from the previous quarter, to 96%. Another positive note was that traffic increased 2.3% for the quarter.
Occupancy is expected to decline somewhat in 2019 to a range of 94.0% to 94.5%, due to anticipated store closures by certain tenants. Fortunately, the company has maintained an occupancy rate of 95%+ for 25 consecutive years.
The dip in occupancy this year will negatively impact the company’s AFFO, but Tanger will still be able to cover its hefty dividend payment.
Tanger has a current dividend payout of $1.42 per share annually, which represents a current yield of 8.6%. This is a very high yield and is clearly attractive for income investors. The biggest concern with a yield this high is sustainability. Fortunately, Tanger appears to have a secure dividend payout.
The company is expected to generate AFFO-per-share of $2.25 to $2.31 for 2019, or $2.28 per share at the midpoint. With an expected dividend payout of $1.47 per share, Tanger’s expected 2019 dividend payout ratio is 65%. This is a manageable payout ratio, which leaves room for modest annual hikes. For example, in February Tanger raised its dividend by 1.4%.
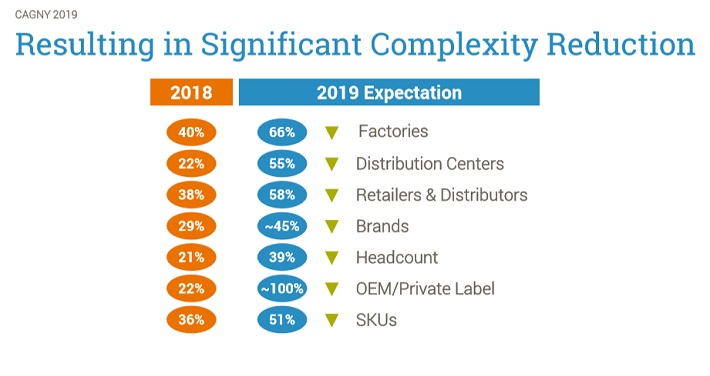
1. Imperial Brands (IMBBY)
- Dividend Yield: 10%
The highest-yielding stock in the Sure Analysis Research Database with a Dividend Risk score of C or better is international tobacco giant Imperial Brands. Imperial Brands is a tobacco company that was founded in 1901. Today, it is headquartered in the United Kingdom and has a market capitalization of $23 billion.
The company manufactures and sells a variety of tobacco products, including cigarettes, tobaccos, cigars, rolling papers, and tubes. Some of its core brands include Winston, Davidoff, Gauloises, L&B, Bastos, Fine, Gitanes, Kool, Jade, and many more.
Source: 2019 CAGNY Presentation
The company is organized into two operating segments: tobacco and logistics. The tobacco segment includes the manufacture and sale of its various tobacco products, while the logistics segment distributes tobacco to product manufacturers.
Imperial Brands reported first half of fiscal 2019 results on May 8th. Net revenue increased 2.3% mostly due to the core tobacco group. Tobacco revenue grew 2.5% in constant currency as a 6.5% increase in prices offset volume declines. The company increased its cigarette share in the U.S.
Adjusted earnings-per-share declined 1.3% in constant currency as market loss in the e-cigarette category in the U.S. partially offset by cost cuts. Imperial Brands expects revenue to grow at the upper end of its 1%-4% range for the fiscal year and reiterated its expectation for adjusted earnings-per-share.
Imperial Brands reported a volume decline of 4.5% in the first half of fiscal 2019. Going forward, the company will need to address the long-running trend of declining smoking rates. Imperial Brands’ future growth will be fueled by its next-generation product line, including vapor and heated tobacco products, such as blu.
To help finance its growth investments, the company is launching an aggressive cost reduction program, targeting up to US$2.6 billion in cost savings over the next one to two years. We expect 3% annual earnings growth through 2024. Share buybacks will also help boost EPS growth. The company recently announced a US$250 million share repurchase by the end of fiscal 2019.
To help finance its growth investments, the company is launching an aggressive cost reduction program, targeting up to $2.6 billion in cost savings over the next one to two years.
Imperial Brands is expected to maintain a dividend payout of $2.45 per share for 2019, which equals an impressive 10% dividend yield at the current share price. The dividend appears secure, with a projected payout ratio of 67% for 2019.
Final Thoughts
High-yield stocks are naturally attractive for income investors. With the Federal Reserve’s recent actions, the U.S. economy is once again in an environment of falling interest rates. This puts income investors in a difficult position, as fixed income yields and bank products such as certificates of deposit will provide less income.
Fortunately, there are still high-yield dividend stocks that provide much higher yields. Investors should monitor each of these stocks to make sure their dividends continue to be sustainable, but this is a good starting list for income investors in search of higher yields.