


Published on October 14th, 2019 by Bob Ciura
PepsiCo (PEP) has been one of the best-performing dividend growth stocks over the past several decades.
PepsiCo has increased its dividend for 47 consecutive years. As a result, it is a member of the Dividend Aristocrats, a group of 57 stocks in the S&P 500 Index with 25+ consecutive annual dividend increases. PepsiCo stock also has a current yield of nearly 3%, which is significantly higher than the ~2% current yield of the broader S&P 500 Index.
Because of its long history of steady dividend increases, we view PepsiCo as a blue chip stock.
You can download the complete list of all 271 blue chip stocks below:
Click here to download your Excel spreadsheet of all 271 blue chip stocks, including metrics that matter like dividend yield and the price-to-earnings ratio.
You can view a preview of our blue chip stocks spreadsheet below:
| MMM | 3M Co. | 158.10 | 3.5 | 90,951.6 | 18.7 | 66.3 |
| AOS | A. O. Smith Corp. | 47.99 | 1.8 | 6,639.4 | 19.1 | 33.5 |
| ABT | Abbott Laboratories | 79.63 | 1.6 | 140,738.1 | 48.6 | 75.6 |
| ABBV | AbbVie, Inc. | 73.63 | 5.7 | 108,860.5 | 27.0 | 153.0 |
| AFL | Aflac, Inc. | 52.44 | 2.0 | 38,825.7 | 12.7 | 25.7 |
| APD | Air Products & Chemicals, Inc. | 217.29 | 2.1 | 47,880.9 | 28.0 | 58.2 |
| ADM | Archer-Daniels-Midland Co. | 40.46 | 3.4 | 22,535.2 | 17.3 | 58.5 |
| T | AT&T, Inc. | 37.58 | 5.4 | 274,597.1 | 15.8 | 85.1 |
| ADP | Automatic Data Processing, Inc. | 162.52 | 1.9 | 70,484.8 | 30.8 | 58.0 |
| BDX | Becton, Dickinson & Co. | 252.86 | 1.2 | 68,260.6 | 86.9 | 105.2 |
| BF.B | Brown-Forman Corp. | 62.98 | 1.0 | 30,075.4 | 36.7 | 38.2 |
| CAH | Cardinal Health, Inc. | 46.92 | 4.1 | 13,719.6 | 10.4 | 42.2 |
| CAT | Caterpillar, Inc. | 128.40 | 2.7 | 72,236.4 | 11.8 | 31.7 |
| CB | Chubb Ltd. | 155.10 | 1.9 | 70,686.7 | 18.9 | 35.8 |
| CVX | Chevron Corp. | 116.15 | 4.0 | 220,501.5 | 14.9 | 59.4 |
| CINF | Cincinnati Financial Corp. | 116.13 | 1.9 | 18,968.2 | 15.5 | 29.1 |
| CTAS | Cintas Corp. | 267.61 | 0.0 | 27,697.6 | 30.7 | 0.0 |
| CLX | The Clorox Co. | 150.25 | 2.6 | 18,855.5 | 23.4 | 61.3 |
| KO | The Coca-Cola Co. | 53.30 | 3.0 | 227,912.4 | 32.4 | 96.1 |
| CL | Colgate-Palmolive Co. | 70.51 | 2.4 | 60,498.0 | 26.8 | 64.2 |
| ED | Consolidated Edison, Inc. | 92.22 | 3.2 | 30,630.3 | 21.8 | 68.8 |
| DOV | Dover Corp. | 97.36 | 2.0 | 14,159.8 | 23.6 | 46.5 |
| ECL | Ecolab, Inc. | 194.74 | 0.9 | 56,036.8 | 37.5 | 34.5 |
| EMR | Emerson Electric Co. | 67.04 | 2.9 | 41,236.4 | 18.9 | 55.0 |
| XOM | Exxon Mobil Corp. | 68.98 | 4.8 | 291,862.0 | 16.6 | 80.2 |
| FRT | Federal Realty Investment Trust | 136.20 | 3.0 | 10,294.2 | 41.3 | 123.6 |
| BEN | Franklin Resources, Inc. | 27.32 | 3.7 | 13,760.2 | 10.1 | 37.3 |
| GD | General Dynamics Corp. | 179.63 | 2.2 | 51,885.0 | 15.8 | 34.3 |
| GPC | Genuine Parts Co. | 96.88 | 3.1 | 14,152.0 | 17.9 | 54.8 |
| HRL | Hormel Foods Corp. | 41.16 | 2.0 | 21,978.2 | 22.3 | 44.3 |
| ITW | Illinois Tool Works, Inc. | 154.53 | 2.6 | 49,987.1 | 20.6 | 53.4 |
| JNJ | Johnson & Johnson | 131.33 | 2.8 | 346,602.2 | 21.5 | 59.7 |
| KMB | Kimberly-Clark Corp. | 137.63 | 2.9 | 47,372.2 | 26.4 | 77.8 |
| LEG | Leggett & Platt, Inc. | 40.88 | 3.8 | 5,374.5 | 18.9 | 71.2 |
| LIN | Linde Plc | 194.25 | 1.8 | 105,009.8 | 19.4 | 33.9 |
| LOW | Lowe's Cos., Inc. | 110.81 | 1.8 | 85,523.0 | 34.6 | 62.1 |
| MKC | McCormick & Co., Inc. | 164.76 | 1.4 | 21,898.6 | 31.0 | 41.9 |
| MCD | McDonald's Corp. | 209.02 | 2.1 | 158,739.0 | 27.2 | 58.4 |
| MDT | Medtronic Plc | 107.58 | 1.9 | 144,336.9 | 32.7 | 61.9 |
| NUE | Nucor Corp. | 52.68 | 3.0 | 15,970.3 | 7.4 | 22.3 |
| PBCT | People's United Financial, Inc. | 15.69 | 4.5 | 6,256.4 | 12.0 | 53.6 |
| PNR | Pentair Plc | 37.36 | 1.9 | 6,278.3 | 17.4 | 33.2 |
| PEP | PepsiCo, Inc. | 137.64 | 2.7 | 191,929.3 | 15.6 | 42.7 |
| PPG | PPG Industries, Inc. | 119.17 | 1.6 | 28,159.0 | 23.3 | 37.6 |
| PG | Procter & Gamble Co. | 121.09 | 2.4 | 303,043.5 | 82.9 | 198.5 |
| ROP | Roper Technologies, Inc. | 342.48 | 0.5 | 35,618.6 | 31.6 | 16.6 |
| SPGI | S&P Global, Inc. | 252.99 | 0.8 | 62,311.4 | 31.9 | 27.0 |
| SHW | The Sherwin-Williams Co. | 550.01 | 0.7 | 50,741.7 | 43.3 | 31.4 |
| SWK | Stanley Black & Decker, Inc. | 146.73 | 1.8 | 22,265.3 | 30.7 | 55.3 |
| SYY | Sysco Corp. | 78.87 | 1.9 | 40,382.0 | 24.3 | 47.1 |
| TROW | T. Rowe Price Group, Inc. | 110.94 | 2.6 | 26,133.6 | 13.8 | 36.2 |
| TGT | Target Corp. | 111.83 | 2.3 | 57,137.2 | 18.4 | 42.3 |
| UTX | United Technologies Corp. | 136.15 | 2.1 | 117,486.4 | 22.0 | 46.9 |
| VFC | VF Corp. | 90.89 | 2.2 | 36,190.3 | 31.3 | 68.6 |
| GWW | W.W. Grainger, Inc. | 305.20 | 1.8 | 16,655.1 | 20.7 | 37.4 |
| WMT | Walmart, Inc. | 120.24 | 1.7 | 341,996.2 | 27.0 | 47.1 |
| WBA | Walgreens Boots Alliance, Inc. | 53.99 | 3.3 | 48,760.7 | 10.6 | 34.4 |
| ABM | ABM Industries, Inc. | 36.12 | 2.0 | 2,398.9 | 26.9 | 53.3 |
| AWR | American States Water Co. | 92.96 | 1.2 | 3,423.9 | 45.0 | 53.2 |
| CBSH | Commerce Bancshares, Inc. (Missouri) | 59.73 | 1.6 | 6,555.2 | 15.9 | 25.8 |
| CWT | California Water Service Group | 54.53 | 1.4 | 2,625.1 | 44.4 | 62.6 |
| FMCB | Farmers & Merchants Bancorp (California) | 772.50 | 1.8 | 608.0 | 11.5 | 21.0 |
| LANC | Lancaster Colony Corp. | 139.39 | 1.8 | 3,832.2 | 25.5 | 46.6 |
| NDSN | Nordson Corp. | 142.89 | 1.0 | 8,214.7 | 25.6 | 25.1 |
| NWN | Northwest Natural Holding Co. | 70.36 | 2.7 | 2,142.0 | 29.8 | 80.3 |
| PH | Parker-Hannifin Corp. | 179.66 | 1.8 | 23,086.1 | 15.4 | 27.1 |
| SCL | Stepan Co. | 95.62 | 1.0 | 2,156.9 | 21.1 | 21.5 |
| SJW | SJW Group | 72.13 | 1.6 | 2,051.5 | 39.3 | 63.2 |
| TR | Tootsie Roll Industries, Inc. | 35.90 | 1.0 | 2,352.7 | 40.3 | 39.5 |
| MO | Altria Group, Inc. | 42.57 | 7.5 | 79,525.0 | 12.6 | 95.0 |
| VZ | Verizon Communications, Inc. | 59.93 | 4.0 | 247,870.5 | 15.7 | 62.9 |
| CMCSA | Comcast Corp. | 45.55 | 1.8 | 207,024.0 | 17.2 | 30.1 |
| TDS | Telephone & Data Systems, Inc. | 25.36 | 2.6 | 2,904.0 | 18.7 | 47.8 |
| JW/A | 0.00 | 0.0 | 0.0 | |||
| MDP | Meredith Corp. | 34.26 | 6.5 | 1,549.6 | -48.6 | -317.7 |
| NKE | NIKE, Inc. | 93.88 | 0.9 | 146,549.5 | 34.2 | 32.1 |
| TJX | The TJX Cos., Inc. | 58.57 | 1.5 | 71,026.1 | 23.3 | 33.8 |
| ROST | Ross Stores, Inc. | 112.46 | 0.9 | 40,680.2 | 25.4 | 21.6 |
| BBY | Best Buy Co., Inc. | 69.53 | 2.7 | 18,326.2 | 12.4 | 33.8 |
| HAS | Hasbro, Inc. | 121.29 | 2.2 | 15,306.9 | 49.3 | 106.4 |
| TIF | Tiffany & Co. | 91.88 | 2.4 | 11,099.0 | 19.9 | 48.3 |
| COLM | Columbia Sportswear Co. | 98.35 | 1.0 | 6,644.3 | 21.8 | 20.8 |
| PII | Polaris Industries Inc. | 89.89 | 2.7 | 5,494.3 | 17.1 | 46.0 |
| WSM | Williams-Sonoma, Inc. | 68.61 | 2.7 | 5,353.1 | 15.5 | 41.1 |
| AAN | Aaron's, Inc. | 68.79 | 0.2 | 4,646.6 | 22.9 | 4.5 |
| CBRL | Cracker Barrel Old Country Store, Inc. | 158.81 | 3.2 | 3,819.4 | 17.1 | 54.3 |
| MNRO | Monro, Inc. | 78.36 | 1.0 | 2,603.4 | 31.9 | 33.3 |
| ISCA | International Speedway Corp. | 45.05 | 1.0 | 1,959.0 | 25.5 | 26.6 |
| PM | Philip Morris International, Inc. | 77.95 | 5.8 | 121,277.7 | 15.5 | 90.7 |
| COST | Costco Wholesale Corp. | 297.60 | 0.8 | 130,832.4 | 35.7 | 29.3 |
| GIS | General Mills, Inc. | 54.35 | 3.6 | 32,848.8 | 17.5 | 62.9 |
| K | Kellogg Co. | 62.13 | 3.6 | 21,163.5 | 24.7 | 88.9 |
| CHD | Church & Dwight Co., Inc. | 74.12 | 1.2 | 18,314.8 | 30.2 | 36.3 |
| KR | The Kroger Co. | 24.25 | 2.4 | 19,439.3 | 11.8 | 28.3 |
| BF/B | 140779 | 0.00 | 0.0 | 0.0 | ||
| SJM | The J. M. Smucker Co. | 107.02 | 3.2 | 12,205.4 | 22.7 | 72.8 |
| BG | Bunge Ltd. | 56.21 | 3.6 | 7,956.9 | 14.9 | 53.0 |
| CASY | Casey's General Stores, Inc. | 161.45 | 0.7 | 5,938.6 | 27.1 | 19.9 |
| FLO | Flowers Foods, Inc. | 22.30 | 3.3 | 4,716.8 | 26.3 | 86.0 |
| JJSF | J&J Snack Foods Corp. | 192.59 | 1.0 | 3,628.6 | 39.3 | 39.7 |
| NUS | Nu Skin Enterprises, Inc. | 41.81 | 3.5 | 2,322.4 | 18.6 | 65.5 |
| VGR | Vector Group Ltd. | 11.19 | 13.3 | 1,653.8 | 20.9 | 278.2 |
| UVV | Universal Corp. | 53.22 | 5.7 | 1,329.0 | 14.4 | 81.4 |
| ANDE | The Andersons, Inc. | 18.64 | 3.6 | 607.7 | 14.9 | 54.1 |
| EPD | Enterprise Products Partners LP | 27.58 | 6.3 | 60,372.9 | 11.9 | 75.1 |
| ET | Energy Transfer LP | 12.57 | 9.7 | 33,020.9 | 10.0 | 97.3 |
| OXY | Occidental Petroleum Corp. | 41.12 | 7.6 | 36,781.0 | 8.1 | 61.6 |
| OKE | ONEOK, Inc. | 69.51 | 4.9 | 28,705.4 | 22.8 | 111.9 |
| MMP | Magellan Midstream Partners LP | 65.77 | 6.0 | 15,022.1 | 11.0 | 65.6 |
| HP | Helmerich & Payne, Inc. | 38.35 | 7.4 | 4,196.8 | -56.1 | -415.8 |
| HEP | Holly Energy Partners LP | 22.22 | 12.0 | 2,342.9 | 12.4 | 148.2 |
| TRV | The Travelers Cos., Inc. | 142.60 | 2.2 | 37,131.0 | 14.1 | 31.0 |
| PRU | Prudential Financial, Inc. | 89.42 | 4.2 | 35,946.8 | 9.0 | 38.1 |
| AMP | Ameriprise Financial, Inc. | 138.27 | 2.7 | 18,095.4 | 10.1 | 26.7 |
| PFG | Principal Financial Group, Inc. | 55.35 | 3.9 | 15,431.4 | 10.3 | 40.1 |
| WRB | W.R. Berkley Corp. | 71.07 | 0.6 | 13,018.3 | 19.6 | 11.3 |
| FDS | FactSet Research Systems, Inc. | 245.30 | 1.1 | 9,384.2 | ||
| BRO | Brown & Brown, Inc. | 36.04 | 0.9 | 10,137.2 | 26.2 | 22.9 |
| ERIE | Erie Indemnity Co. | 184.90 | 1.9 | 8,540.8 | 28.2 | 53.9 |
| TMK | Torchmark Corp. | 88.10 | 0.8 | 9,685.8 | 13.7 | 10.3 |
| AFG | American Financial Group, Inc. | 102.79 | 1.5 | 9,245.1 | 12.9 | 19.4 |
| SEIC | SEI Investments Co. | 59.16 | 1.1 | 8,934.6 | 18.8 | 21.0 |
| RNR | RenaissanceRe Holdings Ltd. | 190.84 | 0.7 | 8,427.9 | 14.1 | 9.9 |
| IVZ | Invesco Ltd. | 15.84 | 7.6 | 14,883.1 | 10.9 | 83.1 |
| AIZ | Assurant, Inc. | 125.78 | 1.9 | 7,689.1 | 21.4 | 40.1 |
| ORI | Old Republic International Corp. | 23.40 | 3.4 | 7,094.9 | 9.4 | 31.7 |
| UNM | Unum Group | 28.29 | 3.7 | 5,902.2 | 11.4 | 41.8 |
| BOKF | BOK Financial Corp. | 75.53 | 2.6 | 5,377.3 | 11.2 | 29.6 |
| CFR | Cullen/Frost Bankers, Inc. | 87.33 | 3.1 | 5,471.7 | 12.2 | 38.0 |
| THG | The Hanover Insurance Group, Inc. | 134.71 | 1.7 | 5,328.3 | 18.3 | 31.8 |
| AXS | AXIS Capital Holdings Ltd. | 62.23 | 2.6 | 5,224.0 | 47.9 | 122.3 |
| EV | Eaton Vance Corp. | 43.47 | 3.2 | 4,932.3 | 12.2 | 39.3 |
| PB | Prosperity Bancshares, Inc. | 70.00 | 2.3 | 4,787.8 | 14.8 | 33.6 |
| RLI | RLI Corp. | 91.16 | 1.0 | 4,082.8 | 32.5 | 31.8 |
| LAZ | Lazard Ltd. | 36.57 | 4.9 | 3,908.7 | 11.0 | 53.8 |
| UBSI | United Bankshares, Inc. (West Virginia) | 37.94 | 3.6 | 3,865.0 | 15.1 | 54.0 |
| OZK | Bank OZK | 27.47 | 3.1 | 3,532.7 | 8.6 | 27.0 |
| EVR | Evercore, Inc. | 76.10 | 2.7 | 3,034.3 | 8.5 | 23.2 |
| UMBF | UMB Financial Corp. | 63.54 | 1.9 | 3,117.8 | 15.7 | 29.4 |
| CBU | Community Bank System, Inc. | 62.66 | 2.4 | 3,232.9 | 18.9 | 45.9 |
| MCY | Mercury General Corp. | 54.12 | 4.6 | 2,995.8 | 15.3 | 70.8 |
| AEL | American Equity Investment Life Holding Co. | 22.93 | 0.0 | 2,086.1 | 9.8 | 0.0 |
| BANF | BancFirst Corp. (Oklahoma) | 55.16 | 2.2 | 1,800.5 | 13.7 | 29.8 |
| WABC | Westamerica Bancorporation | 62.53 | 2.6 | 1,687.2 | 22.3 | 57.3 |
| TMP | Tompkins Financial Corp. | 80.22 | 2.5 | 1,211.2 | 15.3 | 37.7 |
| SRCE | 1st Source Corp. | 45.53 | 2.3 | 1,162.6 | 13.6 | 31.0 |
| SBSI | Southside Bancshares, Inc. | 33.80 | 3.6 | 1,140.7 | 15.4 | 55.2 |
| CTBI | Community Trust Bancorp, Inc. (Kentucky) | 41.91 | 3.4 | 745.0 | 11.4 | 39.2 |
| BMRC | Bank of Marin Bancorp | 41.10 | 1.7 | 560.7 | 16.6 | 28.9 |
| FLIC | The First of Long Island Corp. | 22.62 | 3.0 | 558.1 | 13.7 | 41.2 |
| WHG | Westwood Holdings Group, Inc. | 28.14 | 10.1 | 251.7 | 18.1 | 183.0 |
| SYK | Stryker Corp. | 213.81 | 0.9 | 79,773.6 | 22.5 | 21.4 |
| MCK | McKesson Corp. | 134.74 | 1.2 | 24,914.0 | 44.6 | 51.7 |
| ABC | AmerisourceBergen Corp. | 81.96 | 1.9 | 17,074.4 | 18.2 | 35.0 |
| WST | West Pharmaceutical Services, Inc. | 142.00 | 0.4 | 10,472.4 | 45.9 | 19.4 |
| CHE | Chemed Corp. | 417.12 | 0.3 | 6,641.4 | 33.2 | 9.6 |
| PRGO | Perrigo Co. Plc | 53.44 | 1.5 | 7,270.8 | 83.0 | 121.1 |
| ENSG | The Ensign Group, Inc. | 39.90 | 0.5 | 2,130.1 | 20.4 | 9.6 |
| ATRI | Atrion Corp. | 779.63 | 0.7 | 1,446.2 | 40.1 | 27.7 |
| NHC | National HealthCare Corp. | 80.51 | 2.5 | 1,233.3 | 16.5 | 41.5 |
| UNP | Union Pacific Corp. | 161.39 | 2.1 | 113,704.1 | 19.1 | 39.7 |
| LMT | Lockheed Martin Corp. | 381.47 | 2.3 | 107,726.4 | 18.5 | 41.6 |
| NOC | Northrop Grumman Corp. | 362.22 | 1.4 | 61,286.9 | 17.6 | 23.9 |
| CSX | CSX Corp. | 69.05 | 1.3 | 55,114.1 | 16.5 | 22.0 |
| RTN | Raytheon Co. | 198.72 | 1.8 | 55,342.3 | 18.3 | 33.3 |
| WM | Waste Management, Inc. | 116.34 | 1.7 | 49,355.2 | 28.1 | 47.3 |
| FDX | FedEx Corp. | 145.54 | 1.8 | 37,972.8 | 85.3 | 152.3 |
| RSG | Republic Services, Inc. | 86.38 | 1.7 | 27,706.5 | 26.6 | 46.2 |
| LHX | L3Harris Technologies, Inc. | 208.94 | 1.3 | 46,504.8 | 26.0 | 34.1 |
| CMI | Cummins, Inc. | 162.76 | 2.8 | 25,681.2 | 9.9 | 27.7 |
| FAST | Fastenal Co. | 36.34 | 2.3 | 20,838.4 | 26.7 | 62.3 |
| EXPD | Expeditors International of Washington, Inc. | 74.37 | 1.3 | 12,696.4 | 20.2 | 25.8 |
| CHRW | C.H. Robinson Worldwide, Inc. | 85.25 | 2.3 | 11,541.0 | 16.9 | 38.9 |
| ROL | Rollins, Inc. | 35.17 | 1.1 | 11,517.7 | 50.9 | 57.4 |
| JBHT | J.B. Hunt Transport Services, Inc. | 110.35 | 0.9 | 11,781.8 | 25.3 | 23.0 |
| CSL | Carlisle Cos., Inc. | 140.84 | 1.1 | 7,972.4 | 19.7 | 22.4 |
| GGG | Graco, Inc. | 45.27 | 1.4 | 7,551.3 | 22.1 | 29.9 |
| TTC | The Toro Co. | 73.14 | 1.2 | 7,796.9 | 28.4 | 33.9 |
| HEI | HEICO Corp. | 122.40 | 0.1 | 16,420.3 | 52.7 | 5.6 |
| HUBB | Hubbell, Inc. | 132.15 | 2.5 | 7,190.1 | 19.5 | 48.6 |
| RHI | Robert Half International, Inc. | 54.36 | 2.2 | 6,390.6 | 14.2 | 30.7 |
| DCI | Donaldson Co., Inc. | 51.51 | 1.6 | 6,500.3 | 24.8 | 38.4 |
| LECO | Lincoln Electric Holdings, Inc. | 84.44 | 2.1 | 5,216.6 | 17.0 | 36.3 |
| ITT | ITT, Inc. | 59.35 | 0.9 | 5,222.8 | 17.3 | 16.4 |
| MSA | MSA Safety, Inc. | 112.46 | 1.4 | 4,354.3 | 35.6 | 49.4 |
| RBC | Regal Beloit Corp. | 71.82 | 1.6 | 3,011.8 | 11.9 | 18.9 |
| MSM | MSC Industrial Direct Co., Inc. | 72.15 | 3.4 | 3,982.8 | 13.6 | 46.5 |
| R | Ryder System, Inc. | 50.47 | 4.3 | 2,691.8 | 8.4 | 35.9 |
| BRC | Brady Corp. | 53.89 | 1.6 | 2,856.1 | 21.6 | 34.1 |
| FELE | Franklin Electric Co., Inc. | 46.95 | 1.1 | 2,175.6 | 22.9 | 25.8 |
| HI | Hillenbrand, Inc. | 29.82 | 2.8 | 1,868.7 | 13.3 | 37.3 |
| HCSG | Healthcare Services Group, Inc. | 24.82 | 3.2 | 1,839.5 | 21.7 | 68.4 |
| MGRC | McGrath RentCorp | 67.29 | 2.1 | 1,632.0 | 18.7 | 39.7 |
| TNC | Tennant Co. | 70.51 | 1.2 | 1,283.7 | 33.8 | 41.8 |
| MATW | Matthews International Corp. | 34.59 | 2.3 | 1,089.2 | 17.5 | 40.0 |
| LNN | Lindsay Corp. | 89.31 | 1.4 | 963.3 | 171.0 | 237.5 |
| GRC | The Gorman-Rupp Co. | 34.15 | 1.6 | 892.4 | 23.5 | 36.5 |
| MSFT | Microsoft Corp. | 139.68 | 1.3 | 1,066,514.1 | 27.3 | 36.0 |
| V | Visa, Inc. | 177.06 | 0.5 | 307,801.1 | 34.0 | 18.4 |
| IBM | International Business Machines Corp. | 142.76 | 4.4 | 126,467.5 | 14.7 | 65.1 |
| ACN | Accenture Plc | 184.97 | 1.6 | 117,852.0 | 24.7 | 39.0 |
| TXN | Texas Instruments Incorporated | 130.09 | 2.3 | 121,454.6 | 23.4 | 52.6 |
| QCOM | QUALCOMM, Inc. | 76.70 | 3.2 | 93,241.1 | 26.9 | 87.0 |
| ADI | Analog Devices, Inc. | 111.22 | 1.8 | 41,085.3 | 27.2 | 49.9 |
| XLNX | Xilinx, Inc. | 96.22 | 1.5 | 24,305.7 | 25.9 | 39.0 |
| MCHP | Microchip Technology, Inc. | 95.52 | 1.5 | 22,738.0 | 60.8 | 92.9 |
| MXIM | Maxim Integrated Products, Inc. | 57.74 | 3.2 | 15,653.1 | 19.2 | 61.0 |
| BR | Broadridge Financial Solutions, Inc. | 124.34 | 1.6 | 14,231.1 | 29.9 | 46.6 |
| JKHY | Jack Henry & Associates, Inc. | 142.10 | 1.1 | 10,934.6 | 40.3 | 43.7 |
| BMI | Badger Meter, Inc. | 52.80 | 1.1 | 1,537.2 | 42.2 | 47.9 |
| CASS | Cass Information Systems, Inc. | 52.17 | 1.8 | 755.9 | 24.9 | 45.4 |
| IFF | International Flavors & Fragrances, Inc. | 118.15 | 0.0 | 12,615.5 | 34.2 | 0.0 |
| RPM | RPM International, Inc. | 68.17 | 2.1 | 8,840.3 | 29.3 | 60.1 |
| RGLD | Royal Gold, Inc. | 123.80 | 0.8 | 8,120.3 | 86.3 | 72.8 |
| WLK | Westlake Chemical Corp. | 63.72 | 1.6 | 8,173.3 | 13.3 | 20.9 |
| ALB | Albemarle Corp. | 68.91 | 2.0 | 7,303.5 | 13.4 | 27.3 |
| ATR | AptarGroup, Inc. | 116.33 | 1.2 | 7,449.9 | 33.8 | 40.1 |
| SON | Sonoco Products Co. | 58.38 | 2.8 | 5,842.5 | 19.2 | 54.7 |
| SLGN | Silgan Holdings, Inc. | 30.01 | 1.4 | 3,336.4 | 16.6 | 23.2 |
| BCPC | Balchem Corp. | 99.74 | 0.0 | 3,227.3 | 41.1 | 0.0 |
| SXT | Sensient Technologies Corp. | 64.99 | 2.2 | 2,750.3 | 18.7 | 40.5 |
| FUL | H.B. Fuller Co. | 47.27 | 1.3 | 2,409.9 | 17.2 | 22.9 |
| KWR | Quaker Chemical Corp. | 157.38 | 0.9 | 2,780.4 | 36.9 | 35.0 |
| HWKN | Hawkins, Inc. | 39.61 | 2.3 | 422.4 | 16.8 | 38.8 |
| DLR | Digital Realty Trust, Inc. | 129.31 | 3.2 | 26,940.8 | 118.5 | 383.0 |
| O | Realty Income Corp. | 77.89 | 3.4 | 24,786.8 | 59.5 | 204.4 |
| ESS | Essex Property Trust, Inc. | 326.96 | 2.3 | 21,490.4 | 52.6 | 122.5 |
| WPC | W.P. Carey, Inc. | 90.70 | 4.5 | 15,490.4 | 32.0 | 145.4 |
| ELS | Equity LifeStyle Properties, Inc. | 135.67 | 1.7 | 12,350.6 | 45.7 | 78.4 |
| NNN | National Retail Properties, Inc. | 56.87 | 3.5 | 9,761.0 | 39.9 | 140.3 |
| OHI | Omega Healthcare Investors, Inc. | 42.42 | 6.2 | 9,259.9 | 33.2 | 206.8 |
| NHI | National Health Investors, Inc. | 82.80 | 5.0 | 3,590.3 | 23.0 | 113.7 |
| SKT | Tanger Factory Outlet Centers, Inc. | 15.40 | 9.1 | 1,440.6 | 19.9 | 181.1 |
| UHT | Universal Health Realty Income Trust | 104.96 | 2.6 | 1,443.9 | 83.5 | 214.7 |
| UBA | Urstadt Biddle Properties, Inc. | 23.73 | 4.6 | 945.8 | 37.8 | 174.4 |
| NEE | NextEra Energy, Inc. | 229.54 | 2.1 | 112,187.9 | 32.7 | 67.3 |
| DUK | Duke Energy Corp. | 95.97 | 3.9 | 69,923.8 | 21.2 | 81.9 |
| SO | The Southern Co. | 61.52 | 3.9 | 64,302.5 | 14.4 | 56.5 |
| D | Dominion Energy, Inc. | 81.90 | 4.3 | 67,314.8 | 55.0 | 235.2 |
| XEL | Xcel Energy, Inc. | 63.33 | 2.5 | 32,615.6 | 25.8 | 64.1 |
| WEC | WEC Energy Group, Inc. | 93.81 | 2.4 | 29,591.1 | 27.0 | 65.9 |
| ES | Eversource Energy | 85.57 | 2.4 | 27,690.6 | 31.6 | 76.7 |
| EIX | Edison International | 71.33 | 3.4 | 25,542.6 | -93.7 | -320.8 |
| AWK | American Water Works Co., Inc. | 123.69 | 1.5 | 22,345.0 | 38.5 | 59.4 |
| PPL | PPL Corp. | 31.43 | 5.2 | 22,700.2 | 12.7 | 66.7 |
| CMS | CMS Energy Corp. | 63.88 | 2.3 | 18,128.3 | 31.0 | 71.8 |
| EVRG | Evergy, Inc. | 63.95 | 2.9 | 15,058.1 | 27.1 | 79.9 |
| CNP | CenterPoint Energy, Inc. | 28.27 | 4.0 | 14,197.7 | 24.8 | 98.9 |
| ATO | Atmos Energy Corp. | 111.36 | 1.8 | 13,162.9 | 26.3 | 48.6 |
| BIP | Brookfield Infrastructure Partners LP | 48.42 | 4.0 | 19,727.0 | -2,548.4 | -10,236.8 |
| LNT | Alliant Energy Corp. | 53.02 | 2.6 | 12,593.4 | 24.5 | 63.8 |
| WTR | Aqua America, Inc. | 45.52 | 1.9 | 9,822.2 | 59.5 | 114.6 |
| OGE | OGE Energy Corp. | 43.36 | 3.4 | 8,679.6 | 21.3 | 71.7 |
| UGI | UGI Corp. | 49.03 | 2.2 | 8,547.8 | 25.8 | 56.7 |
| MDU | MDU Resources Group, Inc. | 27.95 | 2.9 | 5,563.7 | 19.0 | 54.8 |
| POR | Portland General Electric Co. | 56.39 | 2.6 | 5,039.7 | 25.2 | 65.8 |
| SWX | Southwest Gas Holdings, Inc. | 91.44 | 2.3 | 4,967.4 | 24.1 | 56.1 |
| BKH | Black Hills Corp. | 78.13 | 2.5 | 4,770.9 | 20.6 | 52.4 |
| NFG | National Fuel Gas Co. | 44.92 | 3.8 | 3,877.3 | 13.1 | 49.9 |
| SR | Spire, Inc. (Missouri) | 85.51 | 2.7 | 4,344.7 | 22.7 | 62.0 |
| NJR | New Jersey Resources Corp. | 43.73 | 2.7 | 3,934.8 | 28.7 | 76.8 |
| NWE | NorthWestern Corp. | 74.86 | 3.0 | 3,776.2 | 17.5 | 52.7 |
| SJI | South Jersey Industries, Inc. | 32.57 | 3.5 | 3,009.1 | 40.9 | 143.6 |
| MGEE | MGE Energy, Inc. | 77.84 | 1.7 | 2,698.6 | 31.6 | 54.8 |
| CPK | Chesapeake Utilities Corp. | 93.93 | 1.6 | 1,540.8 | 25.5 | 41.2 |
| MSEX | Middlesex Water Co. | 64.84 | 0.0 | 1,074.3 | 31.4 | 0.0 |
| CMA | Comerica, Inc. | 65.36 | 3.9 | 9,762.2 | 8.3 | 32.2 |
| TCO | Taubman Centers, Inc. | 36.62 | 7.3 | 2,241.5 | 49.5 | 359.6 |
| Ticker | Name | Price | Dividend Yield | Market Cap ($M) | P/E Ratio | Payout Ratio |
PepsiCo is not the highest-yielding stock around, but on the other hand it offers investors a great deal of stability. PepsiCo has a long history of paying and raising its dividend each year, even during recessions. It has a strong business model and a large collection of some of the world’s most valuable brands.
Therefore, the company can be expected to continue paying its dividend each year for the foreseeable future, even if the U.S. enters a recession.
Business Overview & Recent Earnings
PepsiCo is a global food and beverage company that generates $67 billion in annual sales. The company’s major brands include Pepsi, Mountain Dew, Frito-Lay, Gatorade, Tropicana, Quaker, and many more. While known for its carbonated beverages, Pepsi’s food and snacks make up approximately 52% of sales. PepsiCo has a current market capitalization of $192 billion.
PepsiCo has generated strong and steady growth since 2012.
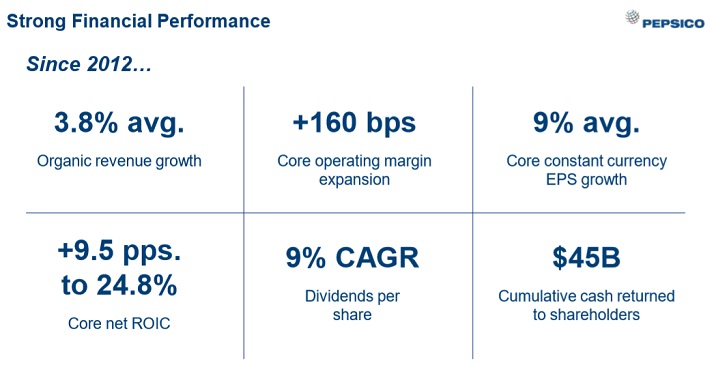
Source: 2019 CAGNY Presentation
PepsiCo has continued to perform well in 2019, even with persistent concerns over a slowdown in the global economy and the challenge of trade conflicts. PepsiCo reported earnings results for the third quarter on 10/3/2019. The company earned $1.56 per share, $0.05 above consensus estimates, but a 2% drop from the previous year. Revenue increased 4.2% year-over-year to $17.2 billion. This was $260 million more than expected. Foreign exchange reduced both revenue and earnings-per-share by 1%. PepsiCo produced organic growth of 4.3% during the quarter, giving the company a year-to-date organic growth of 4.6%. This is well ahead of the 3.4% organic growth that PepsiCo saw through the first three quarters of 2018.
PepsiCo Beverages North America produced 3% organic growth due to higher prices and increased advertisement. PepsiCo has increased its advertising and marketing by 12% so far this year, leading to solid returns among its different product categories. The company’s trademark Pepsi brand posted its fifth quarter in a row of net revenue growth. Frito-Lay North America grew organic revenue 5.5%. Higher volumes and prices were the main drivers for this division. Quaker Foods improved 1% due to light snacks and Aunt Jemima syrup and mix.
We expect PepsiCo to grow earnings-per-share by 5%-6% per year over the next five years, through a combination of revenue growth, margin expansion, and share repurchases.
Growth Prospects
PepsiCo has multiple catalysts for future growth, including new products and continued expansion into the emerging markets. Among PepsiCo’s long-term financial targets are a 4%-6% annual organic revenue growth rate, operating margin expansion of at least 20 basis points per year, and a high-single digit adjusted earnings-per-share compound annual growth rate.
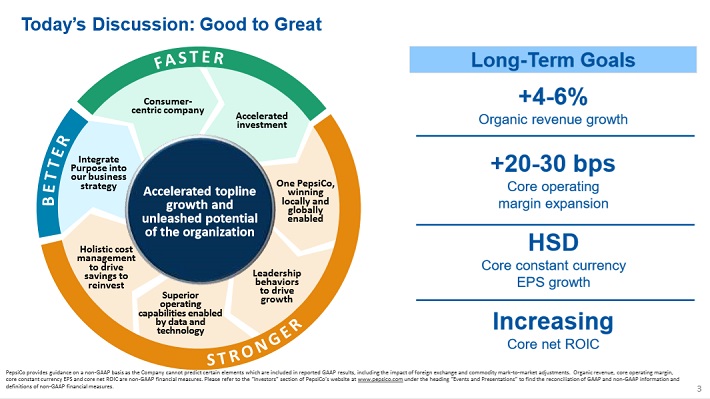
Source: 2019 CAGNY Presentation
Next, we will delve into some of the most attractive areas of growth that will allow the company to meet its long-term financial objectives.
First, PepsiCo’s new products are shaping its growth in an environment of changing consumer preferences. In many developed markets such as the U.S., consumers are steadily drinking less soda due to its calorie and sugar content, instead favoring healthier beverages. Soda sales have declined for over a decade in the U.S., as consumers shift to alternatives such as bottled water, tea, juice, and energy drinks.
PepsiCo has not been caught off-guard by this; rather, it has invested heavily in expanding their product portfolio far beyond soda. It owns the Gatorade brand, which dominates the sports drink category. Gatorade results were particularly strong last quarter, growing at a mid-single-digit rate while taking market share from competitors.
Sports and athletic drinks are an emerging area of focus for PepsiCo. In addition to its flagship Gatorade brand, the company added to this area by acquiring CytoSport, maker of Muscle Milk, from Hormel (HRL) earlier this year for $465 million.
PepsiCo has also adjusted to changing consumer habits by investing in healthier foods. The company’s line of “Better for You” offerings are designed to meet consumers’ desire for healthier food and drink options. Products with less than 70 calories from added sugar make up ~45% of sales.
Separately, the international markets are a growth catalyst for the future, specifically the emerging markets. These are economies such as China and Latin America, with large populations and high rates of economic growth. Expanding middle classes in these nations are huge long-term catalysts for large U.S. consumer products companies such as PepsiCo.
International markets all saw improved sales results last quarter, led by 6% growth in Europe/Sub-Saharan Africa. Latin America was higher by 2% while Asian/Middle East/North Africa was up 5%. PepsiCo’s growth in Africa next year and beyond will be boosted by the recent $1.7 billion acquisition of Pioneer Food Group.
Despite worries over the global economy, PepsiCo expects 2019 to be another year of strong cash flow and steady earnings growth. The company is expecting $9 billion in cash flow from operations in 2019. PepsiCo continues to expect to earn $5.50 per share in 2019 with organic growth of at least 4% for the full year. This kind of growth is more than sufficient to continue raising its dividend each year moving forward, even in a recession.
Competitive Advantages & Recession Performance
PepsiCo’s primary competitive advantage is its huge portfolio of leading brands. PepsiCo has 22 individual brands that each generate $1 billion in annual retail sales. Such a strong brand portfolio provides the company with huge cash flow. Last year, PepsiCo generated free cash flow of $7.6 billion. This allowed the company to return $7 billion to shareholders in the form of dividends and share repurchases last year.
Brand strength gives the top food and beverage companies the ability to raise prices each year, a critical driver of revenue growth. Lesser brands do not possess this ability, as consumers might not purchase certain products if prices increase. But when it comes to the top brands such as Pepsi and Frito-Lay, consumers will absorb a price increase to continue purchasing their favorite products. Over the first three quarters of 2019, PepsiCo generated 5% organic revenue growth, a full 4 percentage points of which is attributable to net pricing increases.
Owning the top brands also gives PepsiCo valuable leverage with retailers, such as maintaining optimal shelf space. Shoppers will typically see PepsiCo products in the middle shelves, while lesser brands occupy the bottom shelves.
Another huge benefit of PepsiCo’s strong cash flow is that it affords the company to spend aggressively on advertising, which helps boost the value of its brands. For example, PepsiCo has spent over $4 billion each year on advertising and other marketing expenses in each of the past three years. Advertising expense alone totaled $2.6 billion last year, $2.4 billion in 2017, and $2.5 billion in 2016.
PepsiCo’s competitive advantages provide the company with steady cash flow, even when the economy dips. Staples such as food and beverages are products people tend to consume whether the economy is doing well or poorly, and as a result PepsiCo is a relatively recession-proof company. During the Great Recession of 2007-2009, PepsiCo’s earnings-per-share increased from $3.34 to $3.77 over this period. Because the company maintained (and even grew) its earnings during the recession, it had little trouble continuing its impressive streak of dividend increases.
Dividend Analysis
One of (if not the) most attractive aspects of buying PepsiCo stock is its dividend. PepsiCo has increased its dividend for 47 consecutive years, including a 3% increase earlier this year. PepsiCo has a current annualized dividend payout of $3.82 per share, which equals a 2.8% dividend yield.
PepsiCo is not widely considered to be a high-yield stock, but stocks with the highest dividend yields should often be avoided because the company is in questionable financial condition. Instead, PepsiCo is a rock-solid dividend stock whose dividend sustainability is not in question. The same cannot be said of many other stocks carrying much higher yields.
PepsiCo does not have the highest dividend yield around, but it does have an above-average yield, as the S&P 500 Index has a ~2% dividend yield on average. And, what PepsiCo may lack in terms of yield, it makes up for with dividend growth. High dividend stocks frequently do not have the ability to raise their dividends—some even resort to dividend cuts.
Meanwhile, PepsiCo has increased its dividend by 7.8% compounded annually over the past 10 years. This is a solid dividend growth rate that will allow investors to double their dividend income every 9.2 years. And, more importantly, PepsiCo’s current dividend and dividend growth are sustainable.
We expect PepsiCo to generate adjusted EPS of $5.50 in 2019. Based on this, the stock has a dividend payout ratio of 69%, which provides the company with enough cushion to maintain its dividend, even under a temporary dip in earnings.
If the company continues to grow EPS, as it has done for several decades, it should have little trouble raising its dividend each year. We expect PepsiCo to continue increasing its dividend at a mid-to-high single digit rate over the next several years, even during recessions.
Final Thoughts
PepsiCo has a long history of rewarding shareholders. Over the past 20 years, PepsiCo stock delivered total returns of 9.7% annually. This compares very favorably to the returns of the broader market. The S&P 500 Index, as measured by the SPDR S&P 500 ETF (SPY) returned just 6% per year over the past 20 years.
This means PepsiCo stock outperformed the major S&P 500 ETF by approximately 3.7 percentage points per year over the past 20 years. PepsiCo’s strong outperformance is especially noteworthy since the company possesses a fairly boring business model of food and beverages.
An annual return of ~10% per year, backed by strong fundamentals and a solid dividend yield, are highly attractive for risk-averse dividend growth investors. PepsiCo may not have the most exciting business model. It does not receive a great deal of attention in the financial news, and the stock does not have an extremely high dividend yield.
But PepsiCo has a sustainable dividend, regardless of the state of the economy. And, it has multiple catalysts for future growth, meaning it should continue to raise its dividend each year.