


Published on October 16th, 2019 by Nate Parsh
Some investors are very focused on owning stocks with very high dividend yields. The attraction to high yields makes sense as they provide shareholders with much higher income than do lower-yielding stocks. You can see our full list of stocks offering at least a 5% dividend yield here.
You can also download your full list of all 300+ securities with 5%+ yields below to save for future reference.
You can see a preview of these 300+ securities in the table below.
| UMH | UMH Properties, Inc. | 14.37 | 5.0 | 581.0 | -12.3 | -61.9 |
| UBCP | United Bancorp, Inc. (Ohio) | 11.51 | 4.6 | 68.1 | 11.7 | 54.6 |
| WY | Weyerhaeuser Co. | 27.23 | 5.0 | 20,284.4 | 5,919.6 | 29,565.2 |
| ABEV | Ambev SA | 4.52 | 0.0 | 71,114.5 | 24.1 | 0.0 |
| NHI | National Health Investors, Inc. | 82.93 | 4.9 | 3,595.9 | 23.0 | 113.7 |
| CLB | Core Laboratories NV | 44.55 | 4.9 | 1,976.4 | 21.7 | 107.1 |
| AVH | Avianca Holdings SA | 3.84 | 0.0 | 163.4 | -1.0 | 0.0 |
| XOM | Exxon Mobil Corp. | 69.42 | 4.8 | 293,723.7 | 16.7 | 80.2 |
| DRH | DiamondRock Hospitality Co. | 9.92 | 5.0 | 1,986.0 | 21.9 | 110.4 |
| CTT | CatchMark Timber Trust, Inc. | 10.79 | 5.0 | 528.8 | -3.0 | -14.9 |
| AMCR | Amcor Plc | 9.59 | 0.0 | 15,487.5 | 16.8 | 0.0 |
| RMCF | Rocky Mountain Chocolate Factory, Inc. | 9.27 | 5.2 | 55.6 | 21.3 | 110.5 |
| PBA | Pembina Pipeline Corp. | 35.64 | 4.9 | 18,229.9 | 15.5 | 75.6 |
| ORAN | Orange SA | 16.32 | 0.0 | 43,293.1 | 17.2 | 0.0 |
| CUK | Carnival Plc | 40.49 | 4.9 | 7,469.9 | 9.1 | 45.1 |
| HNNA | Hennessy Advisors, Inc. | 11.20 | 3.8 | 84.0 | 7.2 | 27.5 |
| OUT | OUTFRONT Media, Inc. | 27.20 | 5.3 | 3,898.9 | 24.2 | 128.1 |
| IP | International Paper Co. | 41.42 | 4.8 | 16,271.3 | 10.4 | 49.7 |
| RESI | Front Yard Residential Corp. | 11.64 | 5.2 | 626.5 | -5.0 | -25.6 |
| QIWI | Qiwi Plc | 19.34 | 2.8 | 267.5 | 16.5 | 46.2 |
| BRY | Berry Petroleum Corp. | 9.91 | 4.5 | 802.4 | 11.3 | 51.3 |
| ALX | Alexander's, Inc. | 353.09 | 5.1 | 1,803.2 | 33.4 | 170.2 |
| BDN | Brandywine Realty Trust | 14.48 | 5.2 | 2,545.8 | 29.0 | 150.2 |
| SMFG | Sumitomo Mitsui Financial Group, Inc. | 6.95 | 0.0 | 47,109.3 | 7.5 | 0.0 |
| VICI | VICI Properties, Inc. | 23.12 | 5.0 | 10,658.5 | 15.8 | 78.7 |
| SRC | Spirit Realty Capital, Inc. | 48.04 | 5.2 | 4,328.8 | 25.4 | 132.3 |
| CRWS | Crown Crafts, Inc. | 6.47 | 4.9 | 65.5 | 11.2 | 55.4 |
| LND | BrasilAgro Cia Brasileira de Propriedades Agricolas | 4.31 | 4.7 | 231.9 | 5.2 | 24.3 |
| OSB | Norbord, Inc. | 23.52 | 19.1 | 1,921.6 | 23.6 | 450.8 |
| DOC | Physicians Realty Trust | 17.52 | 5.3 | 3,246.8 | 63.2 | 332.0 |
| CMP | Compass Minerals International, Inc. | 56.88 | 5.1 | 1,927.3 | 32.7 | 165.8 |
| SGU | Star Group LP | 9.42 | 5.1 | 464.2 | 21.9 | 111.2 |
| HAFC | Hanmi Financial Corp. | 18.18 | 5.3 | 566.7 | 12.7 | 67.3 |
| UMPQ | Umpqua Holdings Corp. | 15.98 | 5.3 | 3,518.8 | 9.9 | 51.8 |
| TPR | Tapestry, Inc. | 25.52 | 5.3 | 7,345.4 | 11.5 | 60.7 |
| XHR | Xenia Hotels & Resorts, Inc. | 20.81 | 5.3 | 2,344.1 | 17.0 | 89.7 |
| RPAI | Retail Properties of America, Inc. | 12.86 | 5.2 | 2,747.6 | 41.5 | 213.9 |
| NYCB | New York Community Bancorp, Inc. | 13.02 | 5.2 | 6,085.1 | 16.9 | 88.4 |
| UFS | Domtar Corp. | 34.21 | 5.1 | 2,141.0 | 7.6 | 39.0 |
| APO | Apollo Global Management, Inc. | 39.40 | 4.8 | 15,868.9 | 33.4 | 161.9 |
| PPL | PPL Corp. | 31.92 | 5.2 | 23,054.1 | 12.9 | 66.7 |
| MPW | Medical Properties Trust, Inc. | 19.66 | 5.1 | 8,774.1 | 7.5 | 38.2 |
| WRK | WestRock Co. | 36.25 | 5.0 | 9,328.6 | 11.1 | 55.1 |
| HSBC | HSBC Holdings Plc | 38.60 | 6.6 | 156,409.5 | 11.0 | 73.0 |
| CM | Canadian Imperial Bank of Commerce | 83.44 | 5.0 | 37,167.3 | 9.7 | 48.3 |
| RLGY | Realogy Holdings Corp. | 7.38 | 4.9 | 843.7 | 19.1 | 93.2 |
| KFFB | Kentucky First Federal Bancorp | 7.34 | 5.4 | 61.0 | 75.3 | 410.3 |
| SITC | SITE Centers Corp. | 14.94 | 5.4 | 2,697.6 | 481.9 | 2,580.6 |
| UBP | Urstadt Biddle Properties, Inc. | 18.69 | 5.9 | 744.9 | 30.5 | 178.8 |
| LAZ | Lazard Ltd. | 37.75 | 4.7 | 4,034.8 | 11.3 | 53.8 |
| T | AT&T, Inc. | 37.90 | 5.4 | 276,935.3 | 15.9 | 85.1 |
| KIM | Kimco Realty Corp. | 20.69 | 5.4 | 8,735.7 | 25.7 | 139.2 |
| AYR | Aircastle Ltd. | 22.89 | 5.2 | 1,715.6 | 8.5 | 43.6 |
| VER | VEREIT, Inc. | 9.69 | 5.7 | 10,345.9 | 39.6 | 225.0 |
| GILT | Gilat Satellite Networks Ltd. | 8.33 | 0.0 | 461.8 | 22.8 | 0.0 |
| WRI | Weingarten Realty Investors | 28.95 | 5.5 | 3,725.0 | 16.9 | 92.3 |
| BHP | BHP Group Ltd. | 48.68 | 5.5 | 71,674.0 | 14.3 | 78.0 |
| CAJ | Canon, Inc. | 26.87 | 0.0 | 28,585.2 | 17.6 | 0.0 |
| NAVI | Navient Corp. | 12.01 | 5.3 | 2,768.2 | 6.3 | 33.8 |
| LVS | Las Vegas Sands Corp. | 57.31 | 5.3 | 44,116.6 | 22.9 | 121.6 |
| TESS | TESSCO Technologies, Inc. | 14.98 | 5.3 | 127.6 | 66.3 | 353.8 |
| BBDC | Barings BDC, Inc. | 10.11 | 3.8 | 508.7 | -5.2 | -19.6 |
| ANF | Abercrombie & Fitch Co. | 15.32 | 5.2 | 963.0 | 14.5 | 75.5 |
| BIG | Big Lots, Inc. | 22.14 | 5.4 | 863.8 | 7.2 | 38.9 |
| BRX | Brixmor Property Group, Inc. | 20.59 | 5.4 | 6,132.6 | 17.3 | 93.9 |
| SELF | Global Self Storage, Inc. | 4.62 | 5.6 | 35.7 | 72.2 | 406.3 |
| IX | ORIX Corp. | 77.34 | 0.0 | 19,826.7 | 7.0 | 0.0 |
| POPE | Pope Resources LP | 70.88 | 5.4 | 308.7 | 49.4 | 264.8 |
| EQNR | Equinor ASA | 18.33 | 0.0 | 61,007.9 | 7.5 | 0.0 |
| PEB | Pebblebrook Hotel Trust | 26.55 | 5.7 | 3,468.3 | -65.9 | -377.2 |
| UVV | Universal Corp. | 52.94 | 5.7 | 1,322.0 | 14.3 | 81.4 |
| EC | Ecopetrol SA | 17.41 | 0.0 | 35,792.1 | 9.6 | 0.0 |
| KSS | Kohl's Corp. | 51.45 | 5.0 | 8,187.1 | 11.3 | 56.1 |
| SPG | Simon Property Group, Inc. | 148.89 | 5.4 | 98,688.2 | 21.2 | 115.6 |
| VIV | Telefonica Brasil SA | 12.86 | 8.4 | 14,394.7 | 11.4 | 95.6 |
| ATV | Acorn International, Inc. | 17.66 | 8.3 | 45.6 | 4.5 | 36.8 |
| ABBV | AbbVie, Inc. | 74.50 | 5.6 | 110,146.8 | 27.3 | 153.0 |
| NGG | National Grid Plc | 56.78 | 5.4 | 39,525.1 | 19.6 | 105.4 |
| IGT | International Game Technology Plc | 14.03 | 5.7 | 2,868.2 | -83.3 | -474.8 |
| NTRSP | Northern Trust Corp. | 25.42 | 0.0 | 5,462.5 | ||
| NEXA | Nexa Resources SA | 10.12 | 5.9 | 1,348.1 | 20.0 | 118.8 |
| ORIT | Oritani Financial Corp. | 18.18 | 5.5 | 819.9 | 15.4 | 84.6 |
| BSMX | Banco Santander Mexico SA Institucion de Banca Multiple | 6.81 | 0.0 | 4,525.5 | 8.6 | 0.0 |
| SSL | Sasol Ltd. | 19.06 | 3.8 | 11,907.0 | 9.9 | 37.3 |
| EPR | EPR Properties | 76.83 | 5.7 | 5,958.7 | 22.7 | 130.3 |
| CVA | Covanta Holding Corp. | 16.26 | 6.2 | 2,137.1 | -61.8 | -380.4 |
| GOGL | Golden Ocean Group Ltd. | 5.88 | 5.5 | 848.3 | 46.7 | 258.1 |
| TIGO | Millicom International Cellular SA | 47.99 | 5.5 | 4,852.9 | -124.2 | -683.4 |
| BBAR | BBVA Banco Francés SA | 4.30 | 0.0 | 878.1 | 1.8 | 0.0 |
| PETS | PetMed Express, Inc. | 18.73 | 5.8 | 377.9 | 12.5 | 72.1 |
| FCAU | Fiat Chrysler Automobiles NV | 13.30 | 5.6 | 20,846.2 | 5.5 | 30.7 |
| TEO | Telecom Argentina SA | 10.79 | 2.5 | 1,363.1 | 12.7 | 31.6 |
| TGP | Teekay LNG Partners LP | 13.81 | 4.4 | 1,082.7 | 24.8 | 109.7 |
| MAIN | Main Street Capital Corp. | 42.14 | 5.7 | 2,660.5 | 16.4 | 93.0 |
| VIRT | Virtu Financial, Inc. | 16.46 | 5.8 | 3,137.5 | 33.7 | 196.2 |
| ODP | Office Depot, Inc. | 1.88 | 5.3 | 1,027.2 | 34.9 | 185.5 |
| KHC | The Kraft Heinz Co. | 27.49 | 7.5 | 33,537.5 | -3.0 | -22.5 |
| CG | The Carlyle Group LP | 26.47 | 4.8 | 9,032.7 | 10.3 | 49.3 |
| IPHS | Innophos Holdings, Inc. | 34.92 | 5.5 | 687.6 | 23.6 | 129.8 |
| TK | Teekay Corp. | 4.71 | 0.0 | 474.7 | -3.1 | 0.0 |
| GPS | Gap, Inc. | 17.32 | 5.6 | 6,508.6 | 7.0 | 39.4 |
| GCI | Gannett Co., Inc. | 10.71 | 6.0 | 1,228.2 | 88.1 | 526.3 |
| PM | Philip Morris International, Inc. | 78.32 | 5.8 | 121,853.4 | 15.6 | 90.7 |
| TOT | Total SA | 51.03 | 0.0 | 132,776.5 | 12.1 | 0.0 |
| GEF.B | Greif, Inc. | 45.72 | 3.8 | 2,206.7 | 12.3 | 47.5 |
| RIO | Rio Tinto Plc | 51.40 | 6.5 | 64,744.9 | 6.5 | 41.9 |
| UG | United-Guardian, Inc. | 18.82 | 5.8 | 86.5 | 20.6 | 120.3 |
| BRT | BRT Apartments Corp. | 16.00 | 5.0 | 254.4 | -15.0 | -74.9 |
| TFSL | TFS Financial Corp. | 18.38 | 5.4 | 5,146.1 | 63.6 | 345.9 |
| DBI | Designer Brands, Inc. | 16.68 | 6.0 | 1,211.7 | 23.9 | 143.5 |
| TEF | Telefónica SA | 7.77 | 0.0 | 39,747.1 | 10.7 | 0.0 |
| TRTN | Triton International Ltd. | 34.19 | 6.1 | 2,526.0 | 7.8 | 47.6 |
| ILPT | Industrial Logistics Properties Trust | 21.24 | 6.2 | 1,382.5 | 20.8 | 129.3 |
| AROC | Archrock, Inc. | 9.71 | 5.4 | 1,475.7 | 23.6 | 128.4 |
| KRO | Kronos Worldwide, Inc. | 11.74 | 6.0 | 1,359.6 | 11.7 | 69.7 |
| PDCO | Patterson Cos., Inc. | 17.32 | 6.0 | 1,655.0 | 13.7 | 82.4 |
| MGP | MGM Growth Properties LLC | 29.91 | 6.1 | 2,775.6 | 29.5 | 179.2 |
| DOW | Dow, Inc. | 47.20 | 0.0 | 35,079.6 | ||
| WDR | Waddell & Reed Financial, Inc. | 15.34 | 6.5 | 1,121.0 | 7.5 | 48.7 |
| MMP | Magellan Midstream Partners LP | 65.28 | 6.0 | 14,910.1 | 10.9 | 65.6 |
| PSXP | Phillips 66 Partners LP | 56.24 | 5.7 | 12,706.8 | 12.5 | 71.4 |
| OHI | Omega Healthcare Investors, Inc. | 43.41 | 6.1 | 9,476.0 | 34.0 | 206.8 |
| TSCAP | TriState Capital Holdings, Inc. | 27.20 | 0.0 | 797.7 | ||
| NVEC | NVE Corp. | 65.10 | 6.1 | 315.5 | 22.3 | 136.8 |
| OHAI | OHA Investment Corp. | 1.31 | 6.1 | 26.4 | -2.4 | -14.6 |
| PEGI | Pattern Energy Group, Inc. | 26.38 | 6.4 | 2,591.6 | -41.2 | -263.5 |
| SLB | Schlumberger NV | 32.81 | 6.1 | 45,376.6 | 21.7 | 132.5 |
| CEO | CNOOC Ltd. | 151.01 | 5.5 | 67,422.2 | 8.0 | 44.3 |
| EPD | Enterprise Products Partners LP | 27.68 | 6.3 | 60,591.8 | 12.0 | 75.1 |
| FLXS | Flexsteel Industries, Inc. | 14.72 | 6.0 | 116.6 | -3.6 | -21.3 |
| INN | Summit Hotel Properties, Inc. | 12.05 | 6.0 | 1,266.8 | 13.8 | 82.7 |
| E | Eni SpA | 30.28 | 4.4 | 54,465.5 | 13.5 | 59.3 |
| FUN | Cedar Fair LP | 57.85 | 6.3 | 3,274.1 | 19.1 | 121.0 |
| STAY | Extended Stay America, Inc. | 14.69 | 6.1 | 3,679.8 | 25.6 | 155.0 |
| ENB | Enbridge, Inc. | 35.69 | 6.0 | 72,230.5 | 20.8 | 124.0 |
| NTB | The Bank of N.T. Butterfield & Son Ltd. | 30.05 | 5.5 | 1,640.9 | 8.5 | 46.3 |
| UBS | UBS Group AG | 11.26 | 0.0 | 41,210.9 | 9.3 | 0.0 |
| CORR | CorEnergy Infrastructure Trust, Inc. | 46.89 | 6.4 | 634.5 | 17.6 | 112.4 |
| WPP | WPP Plc | 60.47 | 6.2 | 15,082.8 | 16.6 | 102.4 |
| TX | Ternium SA | 18.15 | 0.0 | 3,563.0 | 1.2 | 0.0 |
| WMB | The Williams Cos., Inc. | 23.15 | 6.2 | 28,058.3 | 305.0 | 1,897.2 |
| CMO | Capstead Mortgage Corp. | 7.53 | 5.2 | 722.6 | -8.7 | -45.0 |
| CPAC | Cementos Pacasmayo SAA | 9.56 | 5.2 | 810.4 | 26.4 | 137.4 |
| MC | Moelis & Co. | 32.21 | 6.0 | 2,339.4 | 13.4 | 80.4 |
| TNP | Tsakos Energy Navigation Ltd. | 3.85 | 0.0 | 344.6 | -3.1 | 0.0 |
| LB | L Brands, Inc. | 17.89 | 10.1 | 4,944.7 | 8.6 | 86.1 |
| PHI | PLDT, Inc. | 20.97 | 4.6 | 4,530.7 | 12.3 | 57.1 |
| RDS.B | Royal Dutch Shell Plc | 58.08 | 6.5 | 108,229.2 | 11.7 | 75.5 |
| MDP | Meredith Corp. | 35.33 | 6.3 | 1,598.0 | -50.1 | -317.7 |
| ESBK | Elmira Savings Bank | 14.36 | 6.4 | 50.0 | 19.4 | 124.4 |
| GOOD | Gladstone Commercial Corp. | 23.17 | 6.5 | 738.3 | 435.5 | 2,819.5 |
| ATAX | America First Multifamily Investors LP | 7.79 | 6.4 | 470.7 | 13.0 | 83.2 |
| CMRE | Costamare Inc. | 6.70 | 6.0 | 791.8 | 25.6 | 152.8 |
| TCP | TC Pipelines LP | 39.28 | 6.6 | 2,875.5 | -13.2 | -87.4 |
| RDS.A | Royal Dutch Shell Plc | 57.54 | 5.6 | 121,090.1 | 11.5 | 64.1 |
| NLSN | Nielsen Holdings Plc | 20.62 | 6.8 | 7,334.0 | -10.6 | -72.2 |
| KTB | Kontoor Brands, Inc. | 37.81 | 0.0 | 2,150.6 | ||
| CEQP | Crestwood Equity Partners LP | 34.85 | 6.9 | 2,518.6 | 11.9 | 81.7 |
| PZN | Pzena Investment Management, Inc. | 8.44 | 1.4 | 591.4 | 11.4 | 16.1 |
| AY | Atlantica Yield Plc | 24.12 | 6.1 | 2,450.6 | -273.2 | -1,653.5 |
| RPT | RPT Realty | 13.62 | 6.5 | 1,091.7 | 92.0 | 594.6 |
| CYD | China Yuchai International Ltd. | 13.15 | 0.0 | 537.3 | 5.5 | 0.0 |
| SIX | Six Flags Entertainment Corp. | 50.59 | 6.4 | 4,267.6 | 15.5 | 99.5 |
| SNH | Senior Housing Properties Trust | 9.19 | 14.4 | 2,184.8 | -27.3 | -392.6 |
| BP | BP Plc | 37.36 | 6.5 | 126,012.0 | 14.1 | 92.1 |
| TTS | Tile Shop Holdings, Inc. | 3.07 | 6.5 | 156.3 | 59.5 | 387.6 |
| CIO | City Office REIT, Inc. | 13.28 | 7.1 | 526.5 | -33.6 | -238.0 |
| PACW | PacWest Bancorp | 36.87 | 6.5 | 4,358.3 | 9.5 | 62.1 |
| PPDF | PPDAI Group, Inc. | 2.79 | 0.0 | 493.1 | 2.0 | 0.0 |
| BBBY | Bed Bath & Beyond, Inc. | 11.98 | 5.5 | 1,516.3 | -2.1 | -11.4 |
| GAIN | Gladstone Investment Corp. | 12.46 | 6.5 | 409.0 | 7.4 | 48.2 |
| MVC | MVC Capital, Inc. | 8.93 | 6.7 | 158.3 | 14.2 | 95.1 |
| SPTN | SpartanNash Co. | 12.60 | 5.9 | 457.8 | 101.9 | 598.2 |
| BBGI | Beasley Broadcast Group, Inc. | 2.90 | 6.9 | 80.8 | 7.7 | 53.3 |
| OLP | One Liberty Properties, Inc. | 27.21 | 6.6 | 541.0 | 29.8 | 197.4 |
| JHG | Janus Henderson Group Plc | 21.92 | 6.6 | 4,200.9 | 10.3 | 67.6 |
| WBK | Westpac Banking Corp. | 19.67 | 6.7 | 68,512.5 | 13.1 | 87.5 |
| MNRL | Brigham Minerals, Inc. | 19.31 | 0.0 | 980.5 | ||
| NRP | Natural Resource Partners LP | 27.50 | 6.5 | 337.2 | 3.3 | 21.8 |
| GMRE | Global Medical REIT, Inc. | 11.53 | 6.9 | 453.5 | 31.4 | 218.0 |
| SAN | Banco Santander SA | 4.25 | 4.5 | 70,574.9 | 9.0 | 40.2 |
| F | Ford Motor Co. | 9.07 | 6.6 | 36,189.2 | 16.4 | 108.8 |
| BANX | StoneCastle Financial Corp. | 22.10 | 6.9 | 145.6 | 15.2 | 104.9 |
| NMM | Navios Maritime Partners LP | 19.96 | 6.0 | 219.2 | -43.9 | -263.7 |
| BXMT | Blackstone Mortgage Trust, Inc. | 35.84 | 6.9 | 4,812.9 | 14.4 | 99.8 |
| PAGP | Plains GP Holdings LP | 19.40 | 0.0 | 15,462.7 | ||
| VNOM | Viper Energy Partners LP | 26.30 | 7.9 | 3,551.8 | 38.6 | 303.5 |
| CVI | CVR Energy, Inc. | 43.79 | 6.9 | 4,402.3 | 11.2 | 76.6 |
| BPY | Brookfield Property Partners LP | 19.23 | 6.7 | 16,860.2 | 13.1 | 87.9 |
| BPR | Brookfield Property REIT, Inc. | 19.26 | 6.7 | 13,823.7 | 17.8 | 119.5 |
| TKC | TURKCELL Iletisim Hizmetleri AS | 5.21 | 0.0 | 4,553.0 | 12.6 | 0.0 |
| BHR | Braemar Hotels & Resorts, Inc. | 9.12 | 7.0 | 300.1 | -10.2 | -71.4 |
| CAMT | Camtek Ltd. | 10.08 | 0.0 | 388.3 | 16.1 | 0.0 |
| GLPI | Gaming & Leisure Properties, Inc. | 38.47 | 6.9 | 8,258.9 | 24.5 | 170.2 |
| CDR | Cedar Realty Trust, Inc. | 3.36 | 6.0 | 299.2 | 37.0 | 220.5 |
| SPKE | Spark Energy, Inc. | 10.11 | 7.2 | 356.7 | -13.4 | -95.8 |
| TUP | Tupperware Brands Corp. | 15.63 | 12.2 | 762.6 | 5.8 | 70.0 |
| ENIA | Enel Américas SA | 9.50 | 0.0 | 14,456.4 | 8.3 | 0.0 |
| TCO | Taubman Centers, Inc. | 36.41 | 7.3 | 2,228.6 | 49.2 | 359.6 |
| GBDC | Golub Capital BDC, Inc. | 17.91 | 7.1 | 2,373.0 | 15.1 | 108.2 |
| EVC | Entravision Communications Corp. | 2.58 | 7.8 | 219.2 | -36.3 | -281.7 |
| PAA | Plains All American Pipeline LP | 18.72 | 6.7 | 13,628.7 | 4.5 | 30.2 |
| ADES | Advanced Emissions Solutions, Inc. | 13.96 | 7.2 | 259.3 | 7.5 | 53.4 |
| BPL | Buckeye Partners LP | 41.41 | 8.5 | 6,373.9 | -66.8 | -566.3 |
| APTS | Preferred Apartment Communities, Inc. | 14.34 | 7.2 | 650.1 | -8.9 | -64.5 |
| RWT | Redwood Trust, Inc. | 16.58 | 7.2 | 1,858.5 | 12.1 | 87.9 |
| OPI | Office Properties Income Trust | 31.41 | 14.5 | 1,511.2 | -10.6 | -153.2 |
| JCAP | Jernigan Capital, Inc. | 18.85 | 7.4 | 419.2 | 8.4 | 62.2 |
| OXY | Occidental Petroleum Corp. | 40.80 | 7.6 | 36,494.8 | 8.1 | 61.6 |
| TGLS | Tecnoglass, Inc. | 7.73 | 5.4 | 346.8 | 18.8 | 102.4 |
| CODI | Compass Diversified Holdings | 20.01 | 7.2 | 1,198.6 | -30.4 | -218.8 |
| CLDT | Chatham Lodging Trust | 17.64 | 7.5 | 827.7 | 32.9 | 245.9 |
| HP | Helmerich & Payne, Inc. | 37.65 | 7.5 | 4,120.2 | -55.1 | -415.8 |
| APLE | Apple Hospitality REIT, Inc. | 16.10 | 7.5 | 3,604.3 | 18.6 | 138.3 |
| LOAN | Manhattan Bridge Capital, Inc. | 6.27 | 7.7 | 60.6 | 13.3 | 102.0 |
| OCSL | Oaktree Specialty Lending Corp. | 5.18 | 7.3 | 730.2 | 5.0 | 36.8 |
| BXG | Bluegreen Vacations Corp. | 9.40 | 6.8 | 699.8 | 15.9 | 108.0 |
| BBL | BHP Group Plc | 42.03 | 6.3 | 44,384.3 | 12.3 | 78.0 |
| SCU | Sculptor Capital Management, Inc. | 16.25 | 6.2 | 1,127.1 | 27.6 | 169.6 |
| CSWC | Capital Southwest Corp. | 21.91 | 6.7 | 387.7 | 13.4 | 89.7 |
| PK | Park Hotels & Resorts, Inc. | 23.35 | 8.7 | 5,604.0 | 16.6 | 144.4 |
| CC | The Chemours Co. | 14.75 | 6.8 | 2,411.4 | 4.2 | 28.3 |
| CLNY | Colony Capital, Inc. | 5.48 | 8.0 | 2,672.6 | -2.5 | -20.4 |
| IRM | Iron Mountain, Inc. | 32.79 | 7.4 | 9,414.2 | 32.2 | 237.5 |
| CATO | The Cato Corp. | 17.24 | 7.7 | 427.0 | 12.5 | 96.1 |
| OCSI | Oaktree Strategic Income Corp. | 8.10 | 7.7 | 238.7 | 19.3 | 148.1 |
| ING | ING Groep NV | 11.08 | 5.6 | 43,161.8 | 8.2 | 45.7 |
| AHT | Ashford Hospitality Trust, Inc. | 2.81 | 14.9 | 287.0 | -1.5 | -23.0 |
| ORCC | Owl Rock Capital Corp. | 16.95 | 0.0 | 6,529.0 | 18.8 | 0.0 |
| CINR | Ciner Resources LP | 17.52 | 11.6 | 345.8 | 7.5 | 87.8 |
| TSLX | TPG Specialty Lending, Inc. | 20.72 | 7.5 | 1,373.1 | 9.8 | 74.0 |
| HESM | Hess Midstream Partners LP | 21.10 | 6.9 | 1,152.6 | 16.9 | 116.7 |
| AFIN | American Finance Trust, Inc. | 14.19 | 6.7 | 1,507.6 | -41.6 | -280.5 |
| HT | Hersha Hospitality Trust | 13.98 | 8.0 | 549.0 | -26.0 | -208.6 |
| BTI | British American Tobacco plc | 34.60 | 7.4 | 79,105.1 | 9.9 | 73.6 |
| AB | AllianceBernstein Holding LP | 28.02 | 8.7 | 2,704.6 | 12.0 | 104.5 |
| IVZ | Invesco Ltd. | 15.79 | 7.7 | 14,836.1 | 10.8 | 83.1 |
| SNR | New Senior Investment Group, Inc. | 6.82 | 7.6 | 566.9 | -4.3 | -33.1 |
| HHR | Headhunter Group Plc | 18.75 | 0.0 | 937.5 | ||
| PMD | Psychemedics Corp. | 9.42 | 7.6 | 52.0 | 14.6 | 112.0 |
| AMID | Third Coast Midstream LLC | 5.24 | 0.0 | 284.1 | -7.4 | 0.0 |
| KRG | Kite Realty Group Trust | 16.47 | 7.7 | 1,383.2 | -59.1 | -455.4 |
| SBRA | Sabra Health Care REIT, Inc. | 23.17 | 7.8 | 4,391.1 | 203.2 | 1,578.9 |
| RLJ | RLJ Lodging Trust | 16.74 | 7.9 | 2,881.5 | 21.5 | 169.2 |
| SOHO | Sotherly Hotels, Inc. | 6.70 | 7.5 | 95.3 | -9.9 | -74.4 |
| WLKP | Westlake Chemical Partners LP | 23.36 | 7.3 | 822.0 | 14.5 | 106.3 |
| STWD | Starwood Property Trust, Inc. | 24.37 | 7.9 | 6,859.8 | 18.1 | 142.3 |
| MCC | Medley Capital Corp. | 2.49 | 0.0 | 135.6 | -1.5 | 0.0 |
| BLX | Banco Latinoamericano de Comercio Exterior SA | 19.84 | 7.8 | 739.9 | 33.4 | 258.9 |
| LADR | Ladder Capital Corp. | 17.19 | 7.8 | 2,058.2 | 11.9 | 93.0 |
| CPLG | CorePoint Lodging, Inc. | 9.78 | 6.4 | 564.4 | -2.4 | -15.1 |
| MO | Altria Group, Inc. | 43.43 | 7.4 | 81,131.6 | 12.9 | 95.0 |
| BCRH | Blue Capital Reinsurance Holdings Ltd. | 6.92 | 8.7 | 60.7 | -2.1 | -18.3 |
| IRCP | IRSA Propiedades Comerciales SA | 11.71 | 0.0 | 368.9 | -1.8 | 0.0 |
| SUNS | Solar Senior Capital Ltd. | 17.44 | 8.1 | 279.8 | 19.0 | 153.4 |
| AMC | AMC Entertainment Holdings, Inc. | 9.17 | 8.7 | 952.3 | 168.3 | 1,467.9 |
| ABDC | Alcentra Capital Corp. | 8.91 | 8.1 | 114.7 | 14.1 | 114.1 |
| SLRC | Solar Capital Ltd. | 20.19 | 8.1 | 853.2 | 11.9 | 96.9 |
| SHLX | Shell Midstream Partners LP | 20.75 | 7.5 | 4,840.8 | 11.5 | 86.8 |
| AEG | AEGON NV | 4.27 | 6.7 | 8,721.8 | 9.2 | 61.3 |
| SBR | Sabine Royalty Trust | 39.06 | 9.1 | 569.5 | 11.3 | 102.9 |
| PMT | PennyMac Mortgage Investment Trust | 22.44 | 8.4 | 1,970.4 | 8.9 | 74.7 |
| AJX | Great Ajax Corp. | 15.67 | 8.0 | 308.0 | 8.9 | 71.9 |
| EVA | Enviva Partners LP | 31.20 | 8.2 | 1,043.9 | 172.6 | 1,410.4 |
| NS | NuStar Energy LP | 28.35 | 8.5 | 3,055.1 | -4.3 | -36.3 |
| LMRK | Landmark Infrastructure Partners LP | 17.88 | 8.2 | 453.1 | 4.2 | 34.7 |
| NCMI | National CineMedia, Inc. | 8.29 | 8.2 | 1,931.9 | 18.1 | 148.4 |
| KEYLL | 0.00 | 0.0 | 0.0 | |||
| ENIC | Enel Chile SA | 4.76 | 0.0 | 6,676.8 | 15.2 | 0.0 |
| WSR | Whitestone REIT | 13.65 | 8.4 | 549.2 | 30.0 | 250.4 |
| AHC | A.H. Belo Corp. | 3.65 | 8.8 | 78.5 | 6.1 | 53.3 |
| SVC | Service Properties Trust | 25.17 | 8.5 | 4,137.0 | 17.0 | 144.1 |
| ACRE | Ares Commercial Real Estate Corp. | 15.30 | 8.2 | 441.7 | 11.4 | 94.0 |
| CTL | CenturyLink, Inc. | 12.11 | 13.0 | 13,209.2 | -1.6 | -21.3 |
| MFGP | Micro Focus International Plc | 13.87 | 13.7 | 4,623.1 | -13.0 | -178.4 |
| TRTX | TPG RE Finance Trust, Inc. | 19.72 | 8.7 | 1,461.0 | 11.7 | 102.0 |
| ARCC | Ares Capital Corp. | 18.40 | 8.6 | 7,851.7 | 10.1 | 86.8 |
| BCSF | Bain Capital Specialty Finance, Inc. | 18.69 | 0.0 | 965.3 | 14.4 | 0.0 |
| GLAD | Gladstone Capital Corp. | 9.78 | 8.6 | 296.8 | 65.9 | 566.0 |
| TPVG | TriplePoint Venture Growth BDC Corp. | 16.36 | 8.8 | 406.7 | 7.1 | 62.9 |
| KREF | KKR Real Estate Finance Trust, Inc. | 19.54 | 8.8 | 1,121.9 | 13.5 | 119.1 |
| XAN | Exantas Capital Corp. | 11.32 | 6.6 | 360.7 | 14.0 | 93.0 |
| ABR | Arbor Realty Trust, Inc. | 13.23 | 8.1 | 1,248.1 | 9.2 | 74.6 |
| FTAI | Fortress Transportation & Infrastructure Investors LLC | 15.12 | 8.7 | 1,282.9 | 66.2 | 577.7 |
| BPMP | BP Midstream Partners LP | 14.55 | 8.1 | 1,524.3 | 10.4 | 84.6 |
| TRGP | Targa Resources Corp. | 38.86 | 9.4 | 9,045.9 | -29.7 | -278.5 |
| APAM | Artisan Partners Asset Management, Inc. | 26.20 | 8.8 | 2,038.6 | 10.6 | 93.1 |
| SAR | Saratoga Investment Corp. | 24.78 | 8.6 | 241.5 | 7.2 | 62.4 |
| NHTC | Natural Health Trends Corp. | 6.88 | 0.0 | 74.2 | 6.7 | 0.0 |
| UAN | CVR Partners LP | 3.49 | 5.4 | 395.4 | -190.7 | -1,038.3 |
| HCFT | Hunt Companies Finance Trust, Inc. | 3.34 | 7.9 | 79.1 | 35.7 | 283.1 |
| SIG | Signet Jewelers Ltd. | 15.75 | 8.6 | 823.1 | -3.7 | -32.4 |
| GPMT | Granite Point Mortgage Trust, Inc. | 18.36 | 9.2 | 1,007.1 | 12.7 | 116.0 |
| GSBD | Goldman Sachs BDC, Inc. | 19.81 | 9.1 | 799.1 | 22.1 | 200.6 |
| BGFV | Big 5 Sporting Goods Corp. | 2.39 | 12.6 | 51.8 | -175.7 | -2,205.9 |
| KEN | Kenon Holdings Ltd. | 21.85 | 0.0 | 1,289.3 | -11.6 | 0.0 |
| EFC | Ellington Financial, Inc. | 18.18 | 9.8 | 614.0 | 16.7 | 164.6 |
| CELP | Cypress Energy Partners LP | 9.32 | 9.0 | 112.4 | 11.1 | 99.7 |
| FAT | FAT Brands, Inc. | 4.90 | 0.0 | 58.0 | -14.8 | 0.0 |
| ET | Energy Transfer LP | 12.49 | 9.8 | 32,810.7 | 10.0 | 97.3 |
| SNP | China Petroleum & Chemical Corp. | 59.11 | 0.0 | 15,081.0 | 10.3 | 0.0 |
| PBFX | PBF Logistics LP | 20.40 | 9.9 | 1,267.0 | 12.6 | 124.2 |
| XIN | Xinyuan Real Estate Co. Ltd. | 4.19 | 9.3 | 251.0 | 2.1 | 19.5 |
| HCAP | Harvest Capital Credit Corp. | 10.05 | 10.6 | 61.0 | 27.6 | 292.3 |
| MPLX | MPLX LP | 27.15 | 9.5 | 21,566.6 | 11.8 | 111.6 |
| HTGC | Hercules Capital, Inc. | 13.40 | 9.3 | 1,397.6 | 10.1 | 94.7 |
| SKT | Tanger Factory Outlet Centers, Inc. | 15.73 | 8.9 | 1,471.4 | 20.3 | 181.1 |
| SFL | SFL Corp Ltd | 14.73 | 9.5 | 1,585.1 | 17.2 | 163.5 |
| PBT | Permian Basin Royalty Trust | 4.10 | 12.0 | 191.1 | 8.3 | 100.0 |
| ARI | Apollo Commercial Real Estate Finance, Inc. | 18.97 | 9.7 | 2,912.5 | 12.0 | 116.1 |
| WES | Western Midstream Partners LP | 23.76 | 10.1 | 10,763.5 | 14.9 | 150.3 |
| GEL | Genesis Energy LP | 21.49 | 10.1 | 2,635.1 | -63.0 | -636.6 |
| PFLT | PennantPark Floating Rate Capital Ltd. | 11.53 | 9.9 | 447.0 | 29.7 | 293.6 |
| M | Macy's, Inc. | 15.69 | 9.6 | 4,846.9 | 4.7 | 45.5 |
| CIM | Chimera Investment Corp. | 20.03 | 10.0 | 3,748.8 | 21.9 | 218.5 |
| HRZN | Horizon Technology Finance Corp. | 11.94 | 10.1 | 161.7 | 9.6 | 96.6 |
| NMFC | New Mountain Finance Corp. | 13.48 | 10.1 | 1,167.5 | 11.3 | 114.5 |
| CHS | Chico's FAS, Inc. | 3.50 | 9.9 | 412.6 | -40.1 | -395.2 |
| BGCP | BGC Partners, Inc. | 5.60 | 11.4 | 1,932.6 | 10.5 | 119.7 |
| RC | Ready Capital Corp. | 15.82 | 10.1 | 702.7 | 8.1 | 81.7 |
| MIC | Macquarie Infrastructure Corp. | 38.83 | 10.3 | 3,349.5 | 32.7 | 336.6 |
| SPH | Suburban Propane Partners LP | 23.12 | 10.4 | 1,427.3 | 20.7 | 215.2 |
| SCM | Stellus Capital Investment Corp. | 13.31 | 10.2 | 251.6 | 8.1 | 82.8 |
| NBLX | Noble Midstream Partners LP | 24.19 | 9.5 | 961.6 | 6.2 | 58.7 |
| WHG | Westwood Holdings Group, Inc. | 27.92 | 10.2 | 249.7 | 18.0 | 183.0 |
| MAC | Macerich Co. | 27.39 | 10.9 | 4,154.5 | 35.7 | 389.7 |
| BGS | B&G Foods, Inc. | 16.56 | 11.5 | 1,082.6 | 6.1 | 69.8 |
| GLP | Global Partners LP | 19.83 | 9.9 | 674.1 | 12.6 | 124.9 |
| WHF | WhiteHorse Finance, Inc. | 13.85 | 10.3 | 284.6 | 7.2 | 73.6 |
| TGE | Tallgrass Energy LP | 19.36 | 10.6 | 5,446.6 | 13.1 | 139.0 |
| SUN | Sunoco LP | 31.84 | 10.4 | 3,157.2 | 20.7 | 215.0 |
| EARN | Ellington Residential Mortgage REIT | 10.61 | 12.5 | 132.3 | -654.9 | -8,209.9 |
| CGBD | TCG BDC, Inc. | 14.11 | 10.5 | 843.1 | 18.0 | 188.4 |
| PTMN | Portman Ridge Finance Corp. | 2.20 | 13.6 | 82.2 | -3.6 | -49.6 |
| NEWT | Newtek Business Services Corp. | 21.81 | 8.4 | 417.9 | 11.0 | 92.4 |
| TGA | TransGlobe Energy Corp. | 1.29 | 5.4 | 93.6 | 4.7 | 25.7 |
| CXW | CoreCivic, Inc. | 15.41 | 11.3 | 1,835.3 | 10.2 | 114.8 |
| KNOP | KNOT Offshore Partners LP | 19.46 | 10.7 | 636.2 | 13.0 | 139.1 |
| MFA | MFA Financial, Inc. | 7.53 | 10.6 | 3,392.7 | 10.7 | 113.4 |
| FDUS | Fidus Investment Corp. | 14.36 | 10.9 | 351.3 | 8.5 | 92.3 |
| DKL | Delek Logistics Partners LP | 31.05 | 10.3 | 758.1 | 12.6 | 129.4 |
| HEP | Holly Energy Partners LP | 21.95 | 12.1 | 2,314.4 | 12.2 | 148.2 |
| TCPC | Blackrock TCP Capital Corp. | 13.34 | 10.8 | 783.9 | 28.6 | 308.2 |
| BSM | Black Stone Minerals LP | 13.17 | 11.0 | 2,712.5 | 8.8 | 96.3 |
| KRP | Kimbell Royalty Partners LP | 14.28 | 11.6 | 669.9 | -14.3 | -165.7 |
| GNL | Global Net Lease, Inc. | 19.16 | 9.3 | 1,618.8 | 157.4 | 1,458.5 |
| VEON | VEON Ltd. | 2.31 | 10.5 | 4,040.5 | 33.5 | 351.4 |
| FLMN | Falcon Minerals Corp. | 6.36 | 7.4 | 546.1 | 10.3 | 75.8 |
| CNXM | CNX Midstream Partners LP | 13.03 | 10.9 | 830.5 | 6.0 | 65.4 |
| MBT | Mobile TeleSystems PJSC | 8.33 | 8.7 | 8,323.3 | 56.5 | 490.9 |
| PSEC | Prospect Capital Corp. | 6.52 | 11.0 | 2,394.7 | 16.5 | 182.5 |
| MNDO | MIND C.T.I. Ltd. | 2.34 | 0.0 | 46.4 | 8.5 | 0.0 |
| ENBL | Enable Midstream Partners LP | 10.71 | 11.9 | 4,660.0 | 8.9 | 106.0 |
| NGL | NGL Energy Partners LP | 11.88 | 13.1 | 1,521.1 | 4.6 | 60.2 |
| HMLP | Höegh Lng Partners LP | 16.14 | 10.9 | 536.1 | 12.5 | 136.1 |
| HIHO | Highway Holdings Ltd. | 1.70 | 0.0 | 6.5 | -7.9 | 0.0 |
| DMLP | Dorchester Minerals LP | 17.90 | 10.8 | 620.8 | 11.3 | 121.5 |
| SEMG | SemGroup Corp. | 15.97 | 11.8 | 1,256.6 | -18.5 | -219.1 |
| NLY | Annaly Capital Management, Inc. | 8.65 | 13.3 | 12,596.6 | -2.6 | -34.7 |
| PRT | PermRock Royalty Trust | 7.14 | 14.5 | 86.9 | 6.9 | 100.0 |
| BKCC | BlackRock Capital Investment Corp. | 4.84 | 14.9 | 333.2 | -64.3 | -956.2 |
| AINV | Apollo Investment Corp. | 15.57 | 11.6 | 1,055.5 | 13.2 | 152.2 |
| CPLP | Capital Product Partners LP | 11.84 | 14.8 | 215.2 | -1.4 | -20.5 |
| OFS | OFS Capital Corp. | 11.70 | 11.6 | 156.4 | 19.1 | 222.4 |
| GLOP | GasLog Partners LP | 19.64 | 11.0 | 934.0 | 14.9 | 163.3 |
| PNNT | PennantPark Investment Corp. | 6.11 | 11.8 | 409.6 | 21.0 | 247.5 |
| OMP | Oasis Midstream Partners LP | 16.15 | 10.9 | 545.8 | 5.9 | 64.0 |
| IVR | Invesco Mortgage Capital, Inc. | 15.49 | 11.2 | 2,212.0 | -15.3 | -172.2 |
| DCP | DCP Midstream LP | 23.63 | 13.2 | 3,386.6 | 23.0 | 304.2 |
| AGNC | AGNC Investment Corp. | 16.12 | 13.2 | 8,830.8 | -10.5 | -137.7 |
| SSI | Stage Stores, Inc. | 2.17 | 0.0 | 62.7 | -0.6 | 0.0 |
| GEO | The GEO Group, Inc. | 15.61 | 12.2 | 1,892.7 | 12.0 | 145.9 |
| TWO | Two Harbors Investment Corp. | 13.38 | 13.5 | 3,651.5 | -4.8 | -64.3 |
| CAPL | CrossAmerica Partners LP | 17.81 | 11.8 | 613.4 | 32.1 | 378.4 |
| USAC | USA Compression Partners LP | 17.44 | 12.0 | 1,796.3 | -74.4 | -896.3 |
| CPTA | Capitala Finance Corp. | 8.80 | 11.4 | 142.0 | -2.8 | -31.8 |
| MITT | AG Mortgage Investment Trust, Inc. | 14.90 | 13.4 | 487.8 | 26.2 | 351.3 |
| GECC | Great Elm Capital Corp. | 8.32 | 12.0 | 83.7 | -21.7 | -259.3 |
| DX | Dynex Capital, Inc. | 15.25 | 14.2 | 376.0 | -1.5 | -21.1 |
| ANH | Anworth Mortgage Asset Corp. | 3.35 | 15.2 | 330.8 | -3.5 | -52.7 |
| ARR | ARMOUR Residential REIT, Inc. | 16.78 | 13.6 | 988.2 | -1.8 | -24.3 |
| IEP | Icahn Enterprises LP | 67.74 | 11.1 | 13,653.1 | 16.1 | 178.6 |
| CLNC | Colony Credit Real Estate, Inc. | 13.96 | 12.5 | 1,794.4 | -6.5 | -81.3 |
| QUAD | Quad/Graphics, Inc. | 9.94 | 12.1 | 524.8 | -14.2 | -171.4 |
| CHMI | Cherry Hill Mortgage Investment Corp. | 12.84 | 15.3 | 220.4 | -3.3 | -50.2 |
| ETRN | Equitrans Midstream Corp. | 14.51 | 0.0 | 3,700.5 | 22.3 | 0.0 |
| CRT | Cross Timbers Royalty Trust | 8.13 | 14.7 | 48.8 | 6.8 | 100.0 |
| VEDL | Vedanta Ltd. | 8.74 | 0.0 | 8,122.1 | 8.3 | 0.0 |
| TCRD | THL Credit, Inc. | 6.85 | 14.0 | 212.8 | -7.9 | -111.1 |
| SHI | Sinopec Shanghai Petrochemical Co. Ltd. | 28.80 | 0.0 | 1,006.6 | 7.4 | 0.0 |
| AMPY | Amplify Energy Corp. | 6.40 | 0.0 | 255.9 | -8.3 | 0.0 |
| WMC | Western Asset Mortgage Capital Corp. | 9.86 | 12.6 | 524.8 | 10.8 | 135.7 |
| MTR | Mesa Royalty Trust | 8.15 | 14.8 | 15.2 | 6.8 | 100.0 |
| VGR | Vector Group Ltd. | 11.27 | 13.2 | 1,665.6 | 21.1 | 278.2 |
| FSK | FS KKR Capital Corp. | 5.80 | 13.1 | 3,007.6 | 2.3 | 30.4 |
| NYMT | New York Mortgage Trust, Inc. | 6.14 | 13.0 | 1,589.5 | 11.4 | 148.8 |
| OXSQ | Oxford Square Capital Corp. | 5.91 | 13.6 | 281.6 | -12.6 | -170.2 |
| NRZ | New Residential Investment Corp. | 15.44 | 13.0 | 6,415.6 | 18.4 | 238.4 |
| VET | Vermilion Energy, Inc. | 15.16 | 13.8 | 2,322.7 | 8.8 | 120.4 |
| GARS | Garrison Capital, Inc. | 6.58 | 14.7 | 105.6 | -40.0 | -590.0 |
| MRCC | Monroe Capital Corp. | 10.16 | 13.8 | 207.7 | 17.9 | 246.6 |
| PVL | Permianville Royalty Trust | 2.33 | 14.8 | 76.9 | 6.5 | 95.4 |
| GPP | Green Plains Partners LP | 13.32 | 14.3 | 308.5 | 7.2 | 103.3 |
| BKEP | BlueKnight Energy Partners LP | 1.16 | 24.1 | 47.3 | -0.7 | -17.2 |
| VOC | VOC Energy Trust | 5.10 | 14.2 | 86.7 | 7.0 | 100.0 |
| EQM | EQM Midstream Partners LP | 32.53 | 13.8 | 6,520.9 | 12.9 | 177.2 |
| USDP | USD Partners LP | 9.99 | 14.4 | 264.8 | 27.9 | 400.4 |
| ENLC | EnLink Midstream LLC | 7.22 | 15.1 | 3,945.0 | -9.3 | -140.3 |
| BBVA | Banco Bilbao Vizcaya Argentaria SA | 5.25 | 4.5 | 34,922.4 | 6.8 | 30.7 |
| NRT | North European Oil Royalty Trust | 5.85 | 13.8 | 53.8 | 7.3 | 100.8 |
| ARLP | Alliance Resource Partners LP | 13.69 | 15.4 | 1,757.7 | 3.9 | 60.3 |
| DLNG | Dynagas LNG Partners LP | 2.04 | 39.8 | 72.4 | -8.8 | -352.2 |
| SRLP | Sprague Resources LP | 17.46 | 15.3 | 396.9 | 10.2 | 155.6 |
| ICMB | Investcorp Credit Management BDC, Inc. | 6.53 | 15.3 | 89.0 | -6.1 | -93.7 |
| SMTA | Spirit MTA REIT | 8.63 | 15.3 | 372.5 | -1.3 | -19.9 |
| PEI | Pennsylvania Real Estate Investment Trust | 5.27 | 15.9 | 408.7 | -2.9 | -46.7 |
| CCR | CONSOL Coal Resources LP | 12.55 | 16.3 | 346.8 | 6.4 | 104.8 |
| MARPS | Marine Petroleum Trust | 2.10 | 15.5 | 4.2 | 6.6 | 102.8 |
| BMA | Banco Macro SA | 26.68 | 0.0 | 1,675.9 | 2.8 | 0.0 |
| ORC | Orchid Island Capital, Inc. | 5.89 | 16.5 | 371.4 | -20.7 | -341.4 |
| MVO | MV Oil Trust | 6.59 | 20.7 | 75.8 | 4.8 | 100.0 |
| MDRR | Medalist Diversified REIT, Inc. | 4.12 | 8.7 | 18.5 | -3.1 | -27.5 |
| GMLP | Golar LNG Partners LP | 10.01 | 17.9 | 709.6 | 75.3 | 1,345.9 |
| AI | Arlington Asset Investment Corp. | 5.46 | 24.7 | 200.2 | -4.5 | -112.1 |
| NNA | Navios Maritime Acquisition Corp. | 10.19 | 11.8 | 1,456.0 | -2.0 | -23.8 |
| SALM | Salem Media Group, Inc. | 1.50 | 17.3 | 31.6 | -7.7 | -132.8 |
| AM | Antero Midstream Corp. | 7.45 | 9.9 | 3,776.4 | 20.7 | 204.8 |
| TLRD | Tailored Brands, Inc. | 4.15 | 17.3 | 210.2 | 3.4 | 58.9 |
| NEWM | New Media Investment Group, Inc. | 8.50 | 17.8 | 514.1 | 570.5 | 10,134.2 |
| TRMT | Tremont Mortgage Trust | 4.99 | 6.6 | 40.9 | 12.8 | 84.9 |
| ROYT | Pacific Coast Oil Trust | 1.35 | 23.6 | 52.1 | 4.1 | 97.4 |
| MTLPR | 0.00 | 0.0 | 0.0 | |||
| CSS | CSS Industries, Inc. | 4.85 | 0.0 | 42.9 | -0.9 | 0.0 |
| MMLP | Martin Midstream Partners LP | 4.05 | 43.2 | 157.4 | -1.0 | -44.5 |
| PER | SandRidge Permian Trust | 1.61 | 25.5 | 84.5 | 3.9 | 99.7 |
| SMLP | Summit Midstream Partners LP | 4.58 | 43.9 | 378.8 | 10.9 | 476.9 |
| CHKR | Chesapeake Granite Wash Trust | 0.56 | 37.4 | 26.2 | 2.7 | 100.0 |
| ECT | ECA Marcellus Trust I | 1.12 | 28.5 | 19.7 | 3.8 | 109.1 |
| WPG | Washington Prime Group, Inc. | 4.00 | 25.0 | 746.3 | 22.3 | 558.7 |
| SDT | Sandridge Mississippian Trust I | 0.48 | 35.9 | 13.4 | 2.8 | 98.9 |
| SDR | Sandridge Mississippian Trust II | 0.47 | 36.4 | 23.4 | 2.7 | 99.7 |
| BPT | BP Prudhoe Bay Royalty Trust | 9.00 | 46.0 | 192.6 | 2.2 | 100.0 |
| CNSL | Consolidated Communications Holdings, Inc. | 3.50 | 33.2 | 252.3 | -5.6 | -185.6 |
| TGS | Transportadora de Gas del Sur SA | 8.27 | 0.0 | 610.2 | 3.3 | 0.0 |
| Ticker | Name | Price | Dividend Yield | Market Cap ($M) | P/E Ratio | Payout Ratio |
Investors do need to be careful when choosing to purchase stocks with higher yields, as this is sometimes a warning sign that the company is facing difficulties that could result in a reduction of the dividend payment down the road. If the reason for investing in a particular stock is due to income needs, a dividend reduction could be devastating to the investor.
High-yielding stocks might be seeing earnings growth slow down or decline. At the same time, high-yield stocks that are struggling to grow earnings are at risk of cutting their dividend if the business fundamentals deteriorate. Therefore, investors need to look past the high dividend yield and examine the company’s business model to determine whether the dividend is sustainable before making an investment decision.
This is particularly important if a recession hits the U.S. economy. Increasing a dividend during a period of growth is one thing, but being able to maintain payments to shareholders during a severe economic downturn shows that the company’s business is able to withstand a recessions.
Ford Motor (F) stock has a high dividend yield of 6.6%, which is very attractive for income investors. But while the dividend appears sustainable today, it could be in trouble should the U.S. economy enter a deep downturn.
Business Overview
Ford was founded by Henry Ford and 12 others in 1903. Ford was very interested in understanding how machines worked from a very early age. At the age of 12 he began working in a small machine in Michigan. By 15, he built his first steam engine. By the late 1890s, Ford completed the first Ford engine, a one-cylinder gasoline model, in the kitchen of his Detroit home. The Quadricycle, which used a later version of this original engine strapped to four bicycle wheels, would become Ford’s first car. The first Ford car sale occurred on July 15th, 1903.
The company’s famous Model T went into production in 1908. The car was very affordable and durable. Because there were fewer than 18,000 miles of paved road in the U.S. at the time, Ford used a light and strong steel alloys for important components so that the car could withstand the bump and grind of primitive roads. Mass production allowed Ford to market the car to the masses, helping the company to sell more than 15 million units through 1927, when production of the Model T ended.
Today, Ford is one of the world’s largest automakers and is the second largest domestic automaker. The company operates a manufacturing division, which produces popular cars, like the Mustang, trucks, like the F-150 and SUVs, like the Explorer, and a financing division. Ford trades with a market capitalization of $35 billion and generates $148 billion in annual revenues.
Ford reported second-quarter earnings results on July 24th, 2019.
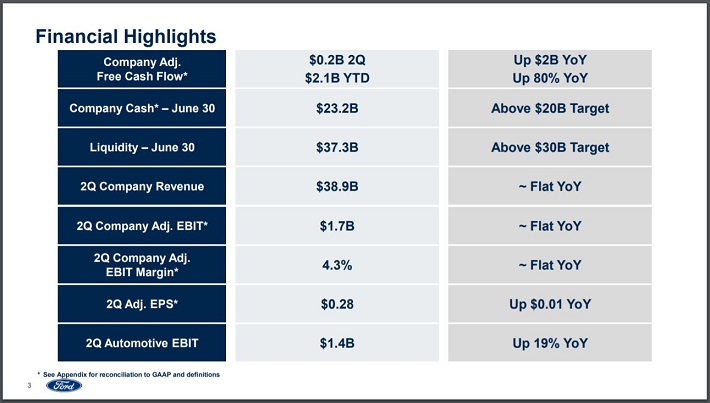
Source: Ford’s Second Quarter Results Presentation, slide 3.
Revenue of $38.9 billion was flat year-over-year, though this was higher than the average analysts’ estimate. The company’s adjusted earnings-per-share was $0.28 for the quarter. This was $0.03 below expectations, but a 3.7% increase from the previous year. Gains in pricing and volume and mix were more than offset by foreign exchange, which reduced revenue results by more than 3%.
Automotive earnings before interest and taxes, or EBIT, increased 19% to $1.4 billion, the second consecutive quarter of growth. This marks the first time in three years that EBIT has shown growth in back-to-back quarters. EBIT margins of 4.3% were flat from the prior year.
Improvements in EBIT were primarily due to strength in North America. EBIT for this region was $1.7 billion, down slightly from last year’s $1.8 billion results. Wholesale sales were lower by 7%, but vehicle mix and pricing were strong. This region had lower volumes for the new Ford Explorer and Police Interceptor models while the Lincoln brands performed very well during the quarter.
The F-Series pickup truck was the top selling truck in its market. Ford benefited from lower incentive spending, helping to increase revenues for the product group. Total pickup sales were the best they had been since 2004. New SUVs, notably the Expedition, EcoSport and Edge, were up 14%.
Europe posted negative EBIT in last year’s second quarter, but produced $53 million this quarter. This was the first improvement in profitability in two years. The company’s Transit model had a quarterly record profit, increasing 2.7% from the second quarter of 2018. Ford plans to launch a Transit Hybrid model later this year and an all-electric Transit is set to launch in 2021.
China EBIT loss improved from a loss of $328 million last year to a loss of $155 million. Consolidated revenue improved 48%, due to higher demand for the Lincoln brand. Retails sales were up 13% from the first quarter of 2019. Dealer inventory was at extremely low levels. The company’s new Territory SUV has been the best-selling Ford SUV in China this year.
Growth Prospects
Despite multiple potential headwinds, including a slowing global economy and margin pressures, Ford sees the potential for growth across multiple key metrics this year. And, the company expects 2019 to be another highly profitable year.
Ford’s guidance for 2019 is as follows:
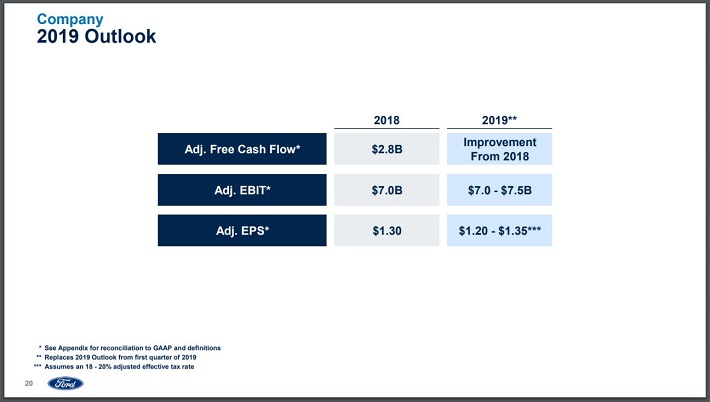
Source: Ford’s Second Quarter Results Presentation, slide 20.
Adjusted EBIT is expected to be flat to up 7% while cash flows should also improve. The midpoint for adjusted earnings-per-share is $0.02 below last year’s result.
Ford is in the process of restructuring its business in certain regions, most notably Europe.
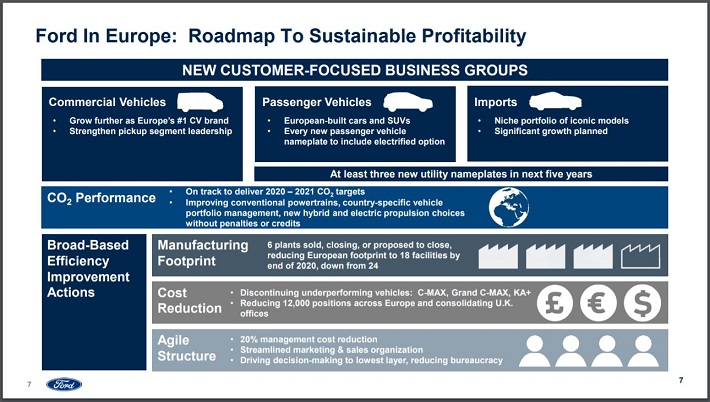
Source: Ford’s Second Quarter Results Presentation, slide 7.
In order to manage costs, Ford in the process of closing or selling six of the company’s 24 facilities in Europe. The company is also discontinuing unpopular brands C-MAX, Grand C-MAX and KA+. This will reduce Ford’s employee headcount by 12,000 people across the region. The goal of this restructuring is that Ford will be able to return to growth in Europe after several years of difficulties.
While quarterly results were decent and Ford saw some improvements in regions where they had previously struggled, not all was good for the company.
The company’s market share worldwide was 6.2%, a drop of 50 bps from the same period a year ago. This year-over-year decline was due to a 9% decline in wholesale units. Almost every region that Ford operates saw a drop-in market share, with North America market share down 20 bps to 12.8% on 7% lower wholesale units.
China market share dropped to 2.3% due to a 32% decrease in wholesale volumes. The company’s European market share declined 20 bps to 6.7% despite a 3% increase in wholesale volumes. These gains in Europe volumes were offset by a 1% decline in revenue for the region. The only region to increase market share was Middle East/Africa, which was up 50 bps to 3.1% although revenue was lower by 26% during the quarter.
Surrendering market share is something that investors should keep an eye on as it is quite possible that this will only worsen during a recession. When that happens, Ford’s dividend could be at risk.
Dividend Analysis
Despite a nearly 7% dividend yield, Ford’s dividend history leaves a lot to be desired. Leading up to the last financial crisis, Ford cut its dividend by 38% from $0.40 in 2005, to $0.25 in 2006. The company eliminated its dividend the very next year as the automaker suffered severe declines for both revenue and earnings-per-share.
Listed below are Ford’s adjusted earnings-per-share results before, during and after the last recession.
- 2004 adjusted earnings-per-share: $2.13
- 2005 adjusted earnings-per-share: $1.25
- 2006 adjusted earnings-per-share: $1.50
- 2007 adjusted earnings-per-share: $0.19
- 2008 adjusted earnings-per-share: $3.13
- 2009 adjusted earnings-per-share: $0.00
- 2010 adjusted earnings-per-share: $1.91
- 2011 adjusted earnings-per-share: $1.95
— - 2018 adjusted earnings-per-share: $1.30
As you can see, adjusted earnings-per-share bottomed out at $0.00 in 2009. Ford has rather consistently alternated between years of earning growth and decline for much of the past 15 years or so. The company has still not regained its high prior to the last recession. With results like this, it is not surprising that the company cut its dividend leading up to the last recession.
Ford paid a quarterly dividend of $0.15 per share in the second quarter of 2019. Using adjusted earnings-per-share of $0.28, this equates to a dividend payout ratio of 54%.
Looking out over a longer-term horizon, Ford has produced adjusted earnings-per-share of $1.31 over the last four quarters while paying out $0.60 in dividends during this same period of time. This results in a payout ratio of 46% over the last year.
These payout ratios are above Ford’s average payout ratio of 34% since 2012, the year the company started distributing dividends again.
Let’s examine Ford’s free cash flow, as this is often the preferred method to measuring dividend safety. Ford generated $4.5 billion of free cash flow in the second quarter and distributed $599 million of dividends for a payout ratio of just 13%.
Ford has generated $8.9 billion of free cash flow over the last four quarters. The company paid $2.4 billion to shareholders in the form of dividends, giving the company a free cash flow payout ratio of 27% in that period.
Ford has been prone to wild swings in free cash flow. For example, in the first quarter of the2019, free cash flow was $1.9 billion, less than half of the total for the most recent quarter. Free cash flow swung to negative in the fourth quarter of 2018 following an amount of nearly $3.2 billion in the previous quarter. The company is not a consistent producer of free cash flow.
These cash flow payout ratios are very low, but the variation in results helps explain why the company hasn’t increased its dividend since 2015. Given the changes in cash flow from quarter to quarter, the company is likely making the prudent move keeping the dividend at the current level.
Also factoring into a dividend’s safety is the company’s balance sheet. At the conclusion of the second quarter, Ford had $38 billion in cash and securities and $118 billion in total current assets against $98 billion in current liabilities and $226 billion in total liabilities.
While interest on automotive debt declined to $230 million from $287 in the most recent quarter and to $461 million from $562 million for the first half of the year, Ford’s total debt is immense and could make a dividend cut likely if business suffered through a prolonged slump, such as a recession.
Final Thoughts
Ford’s dividend yield of 6.6% is extremely attractive at first glance. Even without any dividend growth, this yield could offer investors a significant amount of income.
A closer look of the company reveals that Ford’s dividend could be at risk in the next recession. The company needed to cut its dividend twice before the last recession, including eliminating it all together in 2007. The company hasn’t been able to reach its pre-recession high for adjusted earnings-per-share either.
While earnings-per-share and free cash flow payout ratios are in a good position right now, Ford’s earnings and cash flows are very inconsistent. We fear that a prolonged downturn in the world’s economies could result in Ford lowering or eliminating its dividend once again.
For this reason, we feel that the stock should only be bought by investors who understand that they are taking a risk owning shares of Ford for its dividend.