

Falling In Love With Honeywell Stock After Earnings

 Shares of Honeywell International (NASDAQ: HON) are trading lower during the pre-market hours of Thursday morning, which is a completely uncalled-for reaction considering what is happening to the company. Honeywell released its second quarter 2023 earnings results earlier this morning, beating expectations across the board.
The initial direction may be an act of institutional investors looking to discount the price, with the sole objective of enabling purchases at a more favorable price given the deal flow. Whatever the case may be, there is an obvious disconnect between the stock price action and what the fundamental developments are saying.
Comparing Honeywell to another household name competitor in the space can begin to dismiss the doubters in the stock, backed by previous technical patterns pointing to momentum and a strong uptrend. Markets are seemingly voting for Honeywell stock to win this year's popularity contest, as the stock performed near lockstep with the S&P 500 while simultaneously beating its closest competitor.
Strength lies in the Name
Honeywell stock has risen by as much as 13.4% during the past twelve months, nothing too exciting compared to other blockbuster performances in different names and sectors. However, this move becomes critical for investors to note once they compare Honeywell to this one stock.
As Honeywell's size places it in a different basket of 'apples' completely, comparing apples to apples leaves only one other prospect, 3M (NYSE: MMM). 3M stock has underperformed Honeywell by as much as 32.3% during the past twelve months, the beginning evidence pointing toward market favoritism rewarding this stock.
Another sign of strength can be evidenced in the image below, as the stock has formed - and maintained - a strong uptrend channel that has lasted almost a solid six years. Not only is this uptrend channel being respected today, but the closely followed 200-day moving average has also made its influence felt in the stock recently.
Shown as the purple line across the price candles, Honeywell stock last tested - and rejected - the 200-day moving average during the first quarter of 2023. A quarter later, markets are driving the stock farther away from this critical technical level, a sign of bullishness that investors can check off their list.
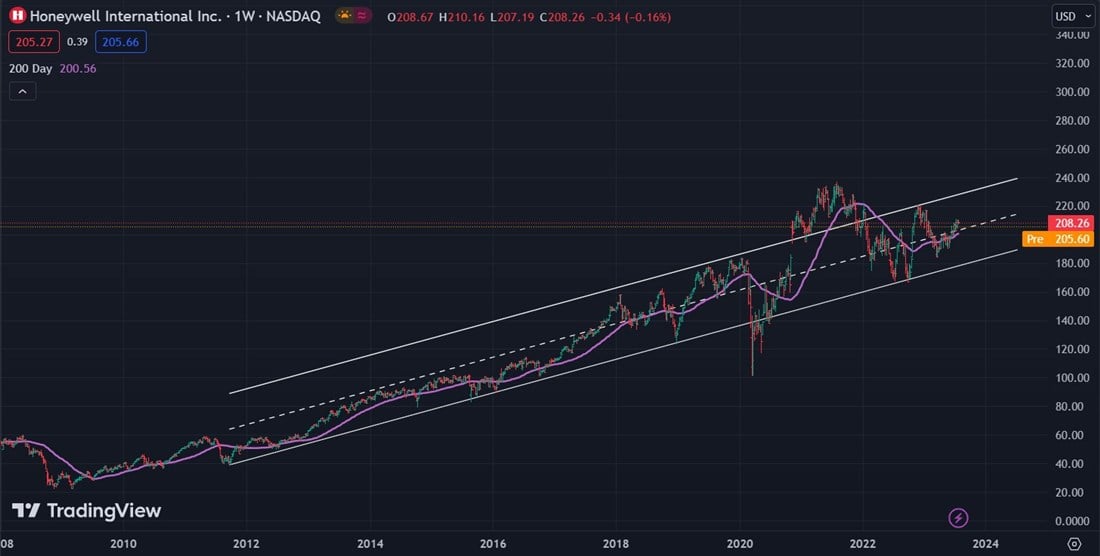
Understanding that markets are not allowing Honeywell stock to cross below the 200-day moving average (taken as a sign of a coming bear market in a stock) can lead investors into a more confident train of thought when considering a potential purchase. But wait, there's more; these fundamental valuation metrics will also explain why Honeywell is the favorite child in the sector.
Taking the forward price-to-earnings ratio, investors can begin to gauge where markets are valuing future growth the most. Honeywell trades at a superior forward P/E of 20.6x, whereas 3M is heavily compressed under a minute of 11.8x. While most investors will only see this as Honeywell being the more 'expensive' stock, just like anything else, there must be a reason why it is expensive.
Underpay for a roofing service, and you will likely feel some cold drops when the rain comes, overpay for good service and even if drops come, service will be right there to fix it in seconds. The same thought process applies to stocks that are 'expensive' as markets are willing to pay a higher price for each dollar of future earnings, pointing to higher perceived quality.
Making it All Make Sense: An Earnings Story
Despite a pre-market decline of 1.2%, investors should not have any reason to panic or sweat the red tape today. Honeywell's earnings release can be the final pillar to act as a foundation when considering a purchase of this stock, as has been reiterated by the previous dynamics.
Following the expected performance nature of such a sizable company (nearly $140 billion in market capitalization), net sales only grew by 3% organically. Investors can gain a sense of excitement through the one line item in financials that typically act as a proxy for future shareholder benefits.
Free cash flow grew by as much as 34% during the past twelve months, which could have been enough to push the stock higher for a channel breakout. This metric is so important because, along with other activities, management can allocate said funds toward debt repayments, share buybacks, and dividend increases. So, more free cash flow, more shareholder bullishness, or so the story goes.
Management has provided full-year 2023 guidance as well, suggesting another 4% to 6% growth in organic sales and a subsequent 3% to 6% growth in earnings per share. These expectations are brought to markets by the margin expansion seen in the business throughout the year, trends that are expected to continue.
Source MarketBeat
Honeywell International Stock
With 6 Buy predictions and not the single Sell prediction the community is currently very high on Honeywell International.
As a result the target price of 214 € shows a slightly positive potential of 13.95% compared to the current price of 187.8 € for Honeywell International.