

Dutch Bros' CapEx Efficiency Gains Traction: Can It Boost Returns?


Dutch Bros Inc. BROS is making measurable progress in improving capital efficiency, a development that is becoming increasingly relevant as the company continues executing its unit expansion strategy. Management highlighted a notable decline in build costs, with average capital expenditures per new shop reduced to approximately $1.3 million in the fourth quarter of 2025 from about $1.8 million in the prior-year quarter.
The reduction in per-unit investment is being driven by a more standardized and disciplined development model. Enhancements in site selection, streamlined store formats and greater operational experience are helping the company reduce construction complexity and improve consistency across new builds.
This improvement comes at a critical juncture, as Dutch Bros pursues a growth trajectory with a long-term target of exceeding 2,000 locations. Lower upfront investment per unit strengthens the return profile of new stores, enabling more efficient capital deployment while sustaining expansion momentum. In an environment where investors are increasingly focused on capital allocation, such gains in efficiency are particularly meaningful.
Importantly, the decline in build costs is not being achieved at the expense of store-level performance. Management indicated that new units continue to generate strong average unit volumes of approximately $2.1 million.
Looking ahead, Dutch Bros appears well-positioned to balance growth with capital discipline. While external pressures, including commodity inflation, remain a consideration, the company’s ability to enhance CapEx efficiency while maintaining strong unit performance could support sustained returns and reinforce confidence in its long-term expansion strategy.
BROS’ Price Performance, Valuation & Estimates
Shares of Dutch Bros have declined 2% in the past year against the industry’s 0.4% rise. In the same time frame, other industry players like Starbucks Corporation SBUX have gained 14.6%, while Chipotle Mexican Grill, Inc. CMG has lost 31.9%.
BROS’ One-Year Price Performance
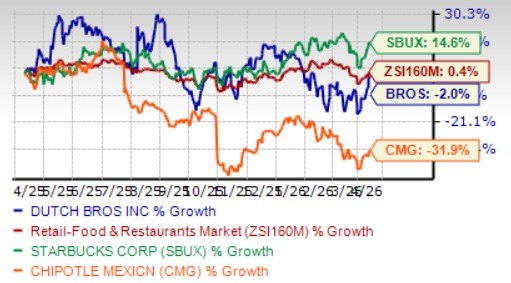
Image Source: Zacks Investment Research
From a valuation standpoint, BROS trades at a forward price-to-sales (P/S) multiple of 4.25, above the industry’s average of 3.50. Conversely, industry players, such as Starbucks and Chipotle, have P/S multiples of 2.79 and 3.35, respectively.
BROS’ P/S Ratio (Forward 12-Month) vs. Industry
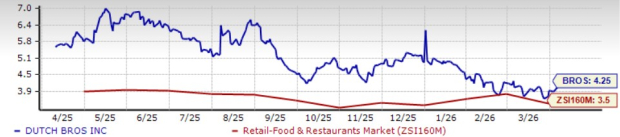
Image Source: Zacks Investment Research
The Zacks Consensus Estimate for BROS’ 2026 earnings per share has increased in the past 60 days.
EPS Trend of BROS Stock
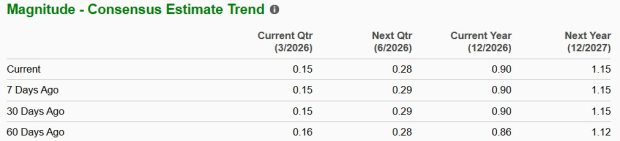
Image Source: Zacks Investment Research
The company is likely to report strong earnings, with projections indicating a 19.7% rise in 2026. Conversely, industry players like Chipotle are likely to witness a decline of 2.6%, year over year, in 2026 earnings. Meanwhile, Starbucks' fiscal 2026 earnings are likely to witness a rise of 8.5%, year over year.
BROS stock currently has a Zacks Rank #3 (Hold). You can see the complete list of today’s Zacks #1 Rank (Strong Buy) stocks here.
Zacks Names #1 Semiconductor Stock
This under-the-radar company specializes in semiconductor products that titans like NVIDIA don't build. It's uniquely positioned to take advantage of the next growth stage of this market. And it's just beginning to enter the spotlight, which is exactly where you want to be.
With strong earnings growth and an expanding customer base, it's positioned to feed the rampant demand for Artificial Intelligence, Machine Learning, and Internet of Things. Global semiconductor manufacturing is projected to explode from $452 billion in 2021 to $971 billion by 2028.
See This Stock Now for Free >>Want the latest recommendations from Zacks Investment Research? Today, you can download 7 Best Stocks for the Next 30 Days. Click to get this free report
Starbucks Corporation (SBUX): Free Stock Analysis Report
Chipotle Mexican Grill, Inc. (CMG): Free Stock Analysis Report
Dutch Bros Inc. (BROS): Free Stock Analysis Report
This article originally published on Zacks Investment Research (zacks.com).
Source Zacks-com