


Updated on November 22nd, 2019 by Josh Arnold
Automatic Data Processing (ADP) might not be a household name, but it should be for dividend growth investors. ADP has raised its dividend each year for 45 years in a row. Its most recent increase came in November 2019, when the company implemented another very strong 15% raise.
ADP is a member of the Dividend Aristocrats, a group of 57 stocks in the S&P 500 Index, with 25+ years of consecutive dividend increases. ADP has one of the longest streaks of dividend increases in the stock market.
In addition to the full downloadable spreadsheet, you can see a preview of the Dividend Aristocrats list in the table below:
| 3M Co. | 165.49 | 3.4 | 94,963 | 19.3 | 66.4 | 1.07 |
| A. O. Smith Corp. | 48.21 | 1.8 | 6,640 | 19.9 | 36.3 | 0.91 |
| Abbott Laboratories | 83.19 | 1.5 | 147,896 | 44.8 | 68.9 | 1.06 |
| AbbVie, Inc. | 86.02 | 4.9 | 127,947 | 39.5 | 196.3 | 0.88 |
| Aflac, Inc. | 53.88 | 2.0 | 39,541 | 13.2 | 26.3 | 0.71 |
| Air Products & Chemicals, Inc. | 237.41 | 1.9 | 52,365 | 29.8 | 57.4 | 0.81 |
| Archer-Daniels-Midland Co. | 42.71 | 3.2 | 23,837 | 20.2 | 65.5 | 0.81 |
| AT&T, Inc. | 37.81 | 5.4 | 274,668 | 16.9 | 91.0 | 0.61 |
| Automatic Data Processing, Inc. | 170.58 | 1.9 | 73,498 | 31.2 | 57.8 | 1.02 |
| Becton, Dickinson & Co. | 249.23 | 1.2 | 67,207 | 62.9 | 77.7 | 0.99 |
| Brown-Forman Corp. | 67.28 | 1.0 | 32,109 | 39.2 | 38.2 | 0.71 |
| Cardinal Health, Inc. | 55.43 | 3.5 | 16,136 | -4.0 | -13.6 | 0.92 |
| Caterpillar, Inc. | 143.41 | 2.5 | 79,229 | 13.5 | 34.0 | 1.38 |
| Chubb Ltd. | 150.57 | 2.0 | 67,966 | 18.9 | 37.2 | 0.63 |
| Chevron Corp. | 119.30 | 3.9 | 224,578 | 17.0 | 66.8 | 0.85 |
| Cincinnati Financial Corp. | 106.39 | 2.1 | 17,332 | 18.9 | 39.3 | 0.72 |
| Cintas Corp. | 256.13 | 1.0 | 26,250 | 29.4 | 29.3 | 1.01 |
| The Clorox Co. | 144.93 | 2.8 | 18,200 | 22.7 | 63.2 | 0.45 |
| The Coca-Cola Co. | 52.92 | 3.0 | 226,906 | 29.3 | 87.9 | 0.43 |
| Colgate-Palmolive Co. | 66.61 | 2.5 | 57,207 | 24.7 | 62.9 | 0.54 |
| Consolidated Edison, Inc. | 86.59 | 3.4 | 28,861 | 20.3 | 69.0 | 0.24 |
| Dover Corp. | 109.39 | 1.8 | 15,848 | 24.4 | 43.1 | 1.07 |
| Ecolab, Inc. | 182.96 | 1.0 | 52,754 | 34.6 | 34.8 | 0.80 |
| Emerson Electric Co. | 73.42 | 2.7 | 44,809 | 19.6 | 52.3 | 1.17 |
| Exxon Mobil Corp. | 69.60 | 4.9 | 294,781 | 20.3 | 98.5 | 0.92 |
| Federal Realty Investment Trust | 130.06 | 3.2 | 9,904 | 38.6 | 122.1 | 0.52 |
| Franklin Resources, Inc. | 27.40 | 3.8 | 13,572 | 11.6 | 44.1 | 1.11 |
| General Dynamics Corp. | 182.95 | 2.2 | 52,928 | 15.7 | 34.2 | 0.91 |
| Genuine Parts Co. | 102.82 | 2.9 | 14,901 | 18.8 | 55.0 | 0.78 |
| Hormel Foods Corp. | 42.76 | 1.9 | 22,811 | 23.2 | 44.3 | 0.48 |
| Illinois Tool Works, Inc. | 172.87 | 2.4 | 55,481 | 22.7 | 53.3 | 1.20 |
| Johnson & Johnson | 137.13 | 2.7 | 359,092 | 25.8 | 69.7 | 0.61 |
| Kimberly-Clark Corp. | 132.84 | 3.1 | 45,716 | 22.6 | 69.7 | 0.46 |
| Leggett & Platt, Inc. | 52.19 | 3.0 | 6,845 | 23.4 | 70.0 | 1.08 |
| Linde Plc | 205.03 | 1.7 | 110,797 | 21.0 | 35.3 | 0.78 |
| Lowe's Cos., Inc. | 117.62 | 1.8 | 89,871 | 31.1 | 54.4 | 1.04 |
| McCormick & Co., Inc. | 166.09 | 1.3 | 22,120 | 31.2 | 41.9 | 0.39 |
| McDonald's Corp. | 192.98 | 2.4 | 144,857 | 25.1 | 60.3 | 0.43 |
| Medtronic Plc | 111.28 | 1.9 | 148,098 | 32.0 | 59.7 | 0.67 |
| Nucor Corp. | 54.71 | 2.9 | 16,446 | 9.3 | 27.3 | 1.15 |
| People's United Financial, Inc. | 16.29 | 4.3 | 7,203 | 12.4 | 53.6 | 0.96 |
| Pentair Plc | 43.36 | 1.6 | 7,288 | 21.1 | 34.7 | 1.20 |
| PepsiCo, Inc. | 134.03 | 2.8 | 186,728 | 15.2 | 42.7 | 0.53 |
| PPG Industries, Inc. | 125.43 | 1.6 | 29,718 | 24.6 | 38.3 | 0.91 |
| Procter & Gamble Co. | 119.98 | 2.4 | 300,105 | 74.5 | 181.8 | 0.53 |
| Roper Technologies, Inc. | 352.90 | 0.5 | 36,838 | 31.7 | 16.6 | 1.04 |
| S&P Global, Inc. | 267.53 | 0.8 | 64,616 | 31.5 | 26.0 | 0.99 |
| The Sherwin-Williams Co. | 570.17 | 0.7 | 52,483 | 37.6 | 28.0 | 0.87 |
| Stanley Black & Decker, Inc. | 155.19 | 1.7 | 23,575 | 33.3 | 57.3 | 1.52 |
| Sysco Corp. | 79.32 | 2.0 | 40,420 | 24.0 | 47.2 | 0.51 |
| T. Rowe Price Group, Inc. | 120.67 | 2.5 | 28,048 | 15.1 | 37.3 | 1.22 |
| Target Corp. | 127.68 | 2.0 | 65,220 | 20.2 | 41.2 | 0.85 |
| United Technologies Corp. | 147.98 | 2.0 | 127,134 | 24.8 | 49.2 | 1.09 |
| VF Corp. | 85.22 | 2.3 | 33,866 | 26.2 | 60.3 | 1.14 |
| W.W. Grainger, Inc. | 316.50 | 1.8 | 16,840 | 18.4 | 32.5 | 1.07 |
| Walmart, Inc. | 119.96 | 1.8 | 340,915 | 23.8 | 41.9 | 0.61 |
| Walgreens Boots Alliance, Inc. | 61.11 | 2.9 | 54,105 | 14.2 | 41.2 | 1.03 |
| Certain securities may be excluded due to data limitations | ||||||
| Name | Price | Dividend Yield | Market Cap ($M) | Forward P/E Ratio | Payout Ratio | Beta |
ADP’s long history of dividend growth is the result of a strong business model and huge competitive advantages. This article will review ADP’s fundamentals and discuss whether the stock is trading at an attractive enough valuation to buy now.
Business Overview
ADP is a business outsourcing services company. It was founded in 1949, and began with a single client. In the 70 years since, ADP has grown into the leading payroll and human resource outsourcing company. It has approximately 800,000 clients, in more than 140 countries worldwide.
ADP provides services including payroll, benefits administration, and human resources management, to companies of all sizes. ADP enjoys high demand for these services, as companies would prefer to outsource these functions in order to better focus on their core business activities.
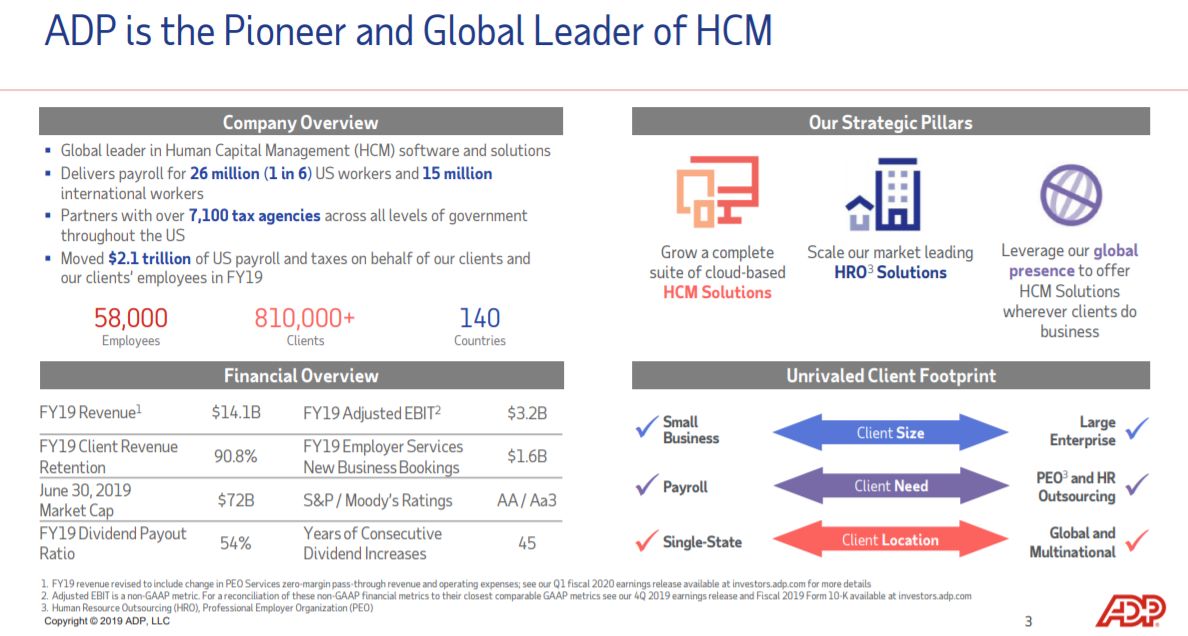
Source: Investor Day Presentation, page 3
ADP has a leading position across its strategic pillars, as well as a highly diversified client list; no single customer represents more than 2% of annual revenue.
The company has undergone a significant restructuring in recent years. In 2014, ADP spun off its human capital management business, which now trades as CDK Global (CDK).
Its reshaped business model will place greater emphasis on helping clients streamline their business functions, by investing in cloud-based software as a growth initiative.
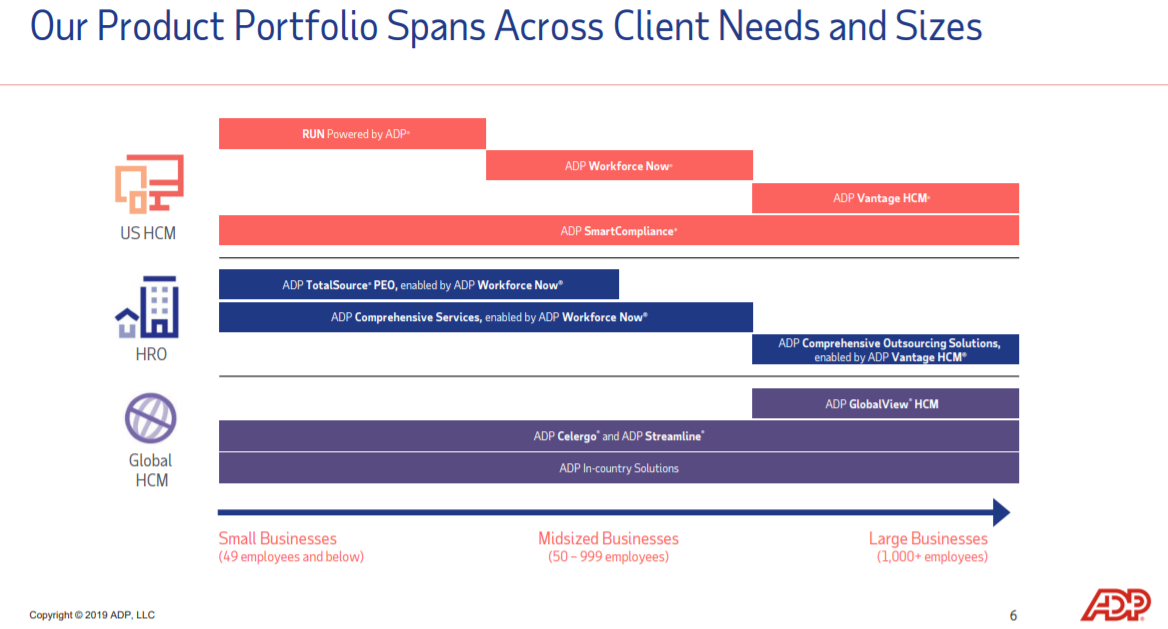
Source: Investor Day Presentation, page 6
As we can see above, ADP has built its business in such a way that it can offer a variety of solutions to businesses of any size, making it a true leader in the field. ADP has built its success on attracting small and large businesses alike, and we see its years-long transformation to this portfolio as a competitive advantage.
Growth Prospects
ADP has produced strong growth in recent years and we expect that will continue. The company recently reported fiscal 2020 first-quarter earnings, which was another terrific quarter. Total revenue gained 6% to $3.5 billion while adjusted earnings before interest and taxes, or EBIT, increased 8% to $745 million. EBIT margin rose 60bps to 21.3% of revenue.
Both segments produced gains as Employer Services saw its top line increase 4% and PEO Services’ revenue rose 8%. Earnings-per-share came in at $1.34 on an adjusted basis, which represented a 12% gain against the comparable period last year. We expect ADP to produce $6.16 in earnings-per-share for fiscal 2020.

Source: Investor Presentation, page 4
Two key growth catalysts for ADP are continued increases in payrolls, and regulation. First, as the economy continues to grow at a modest rate, businesses are adding employees. The number of employees on ADP clients’ payrolls continues to grow, and we believe this will continue for the foreseeable future.
Next, the increasingly complex regulatory environment creates significant compliance costs for businesses; this also helps provide ADP with steady growth. The company expects new business bookings to increase 6%-8% in the current fiscal year, in addition to a slightly higher customer retention rate.
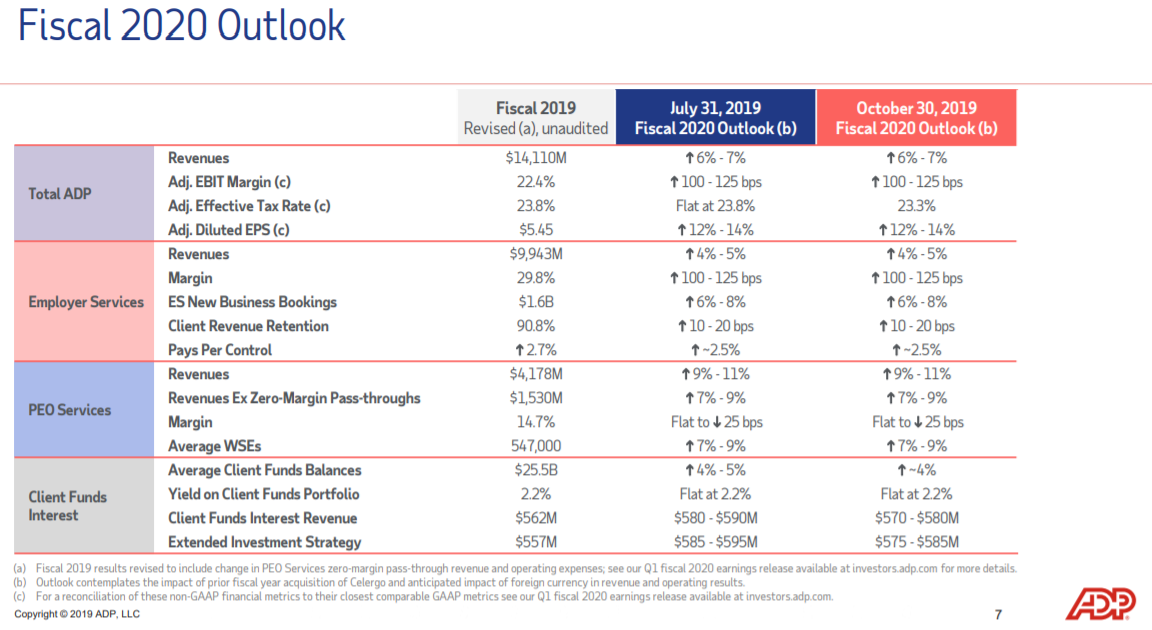
Source: Investor Presentation, page 7
ADP offered up favorable guidance for this year, continuing many years of strong growth. Revenue should be up 6% to 7%, while EBIT margin should rise 100bps to 125bps, and adjusted earnings-per-share should rise 12% to 14%. The strongest gains continue to accrue from the PEO Services segment, and we believe ADP will produce 8% earnings-per-share growth annually in the coming years.
Competitive Advantages & Recession Performance
ADP’s growth is fueled by its competitive advantages, of which it has many. ADP has a deep connection with its customers, and enjoys a strong reputation for customer service, which helps keep customer retention very high.
ADP enjoys tremendous scale that its competitors cannot match. As a global company, ADP is uniquely positioned to help companies with employees on multiple continents.
In addition, ADP benefits from a recession-resistant business model. ADP’s earnings-per-share during the Great Recession are shown below:
- 2007 earnings-per-share of $1.83
- 2008 earnings-per-share of $2.20 (20% increase)
- 2009 earnings-per-share of $2.39 (8.6% increase)
- 2010 earnings-per-share of $2.39 (flat)
ADP increased earnings-per-share in 2008 and 2009, which is a rare accomplishment. The reason for ADP’s continued growth during the Great Recession is that businesses still need payroll and human resource services, even in an economic downturn.
This helps insulates ADP from the effects of a recession. Given ADP’s increased size and scale, we believe it will perform well during the next recession, which increases the attractiveness of the stock. Rarely do investors find a combination of strong growth prospects and recession resilience, along with a world-class dividend increase streak.
Valuation & Expected Returns
We forecast adjusted earnings-per-share of approximately $6.16 for fiscal 2020. Based on the current share price, the stock has a price-to-earnings ratio of 27.7. This is a fairly rich valuation by most standards, and it is high by ADP’s own historical norms as well. We see fair value for ADP at 22 times earnings, which is a meaningful discount to the current valuation. Indeed, should the stock return to its historical norm in terms of valuation, it would be a mid-single digit (-4.5%) headwind to total returns annually.
As a result, investors cannot rely on an expanding price-to-earnings ratio to fuel shareholder returns. Instead, future returns will be generated from earnings growth and dividends. The good news is that the company is growing at a high enough rate that it could help justify something close its current valuation. Still, the recent rally in the stock has made ADP less attractive from a valuation perspective.
We expect ADP to grow earnings-per-share by 8% annually over the next five years. In addition, the stock has a current dividend yield of 2.1%. The combination of a contracting P/E multiple, earnings growth, and dividends yields a total expected return of 5.4% per year through fiscal 2025.
ADP will almost certainly continue to increase its dividend for many years to come given that its fundamentals are so strong. ADP maintains a target payout ratio of 55%-60% of annual earnings, so the payout is very safe with room to grow.
The payout for fiscal 2019 is $3.64 per share after the November 2019 increase. Based upon the forecast for earnings-per-share management provided, the payout ratio for this year should be right at 60%. With robust forecast earnings-per-share growth, ADP should have ample room to continue to raise the payout for many years to come.
Final Thoughts
ADP is a strong business. The company maintains a large list of customers, and holds a top position in the industry. This gives it a wide economic “moat”, a term popularized by investing legend Warren Buffett. Indeed, ADP’s moat keeps competitors at bay, and leads to high levels of profitability.
There should be plenty of growth going forward, both in terms of earnings and dividends. Regulations continue to increase and become more complex. And, as the economy expands, companies are adding employees and increasingly use ADP’s services.
If a recession occurs, ADP should continue to increase its dividend, as customers will still need its services. Although ADP is a highly consistent dividend growth stock, its mid-single-digit expected total returns make the stock a hold. But ADP stock would be an attractive buy on any meaningful pullback in the share price, which would result in a lower valuation and higher dividend yield.