


Updated November 21st, 2019 by Nate Parsh
There are just 57 stocks on the list of Dividend Aristocrats, members of the S&P 500 Index that have raised their dividends for 25+ consecutive years.
In addition to the full downloadable spreadsheet, you can see a preview of the Dividend Aristocrats list in the table below:
| MMM | 3M Co. | 167.77 | 3.386 | 96,476 | 19.6 | 66.4 | 1.07 |
| AOS | A. O. Smith Corp. | 48.09 | 1.830 | 6,591 | 19.8 | 36.3 | 0.91 |
| ABT | Abbott Laboratories | 83.89 | 1.526 | 148,267 | 45.1 | 68.9 | 1.06 |
| ABBV | AbbVie, Inc. | 87.20 | 4.908 | 128,953 | 40.0 | 196.3 | 0.87 |
| AFL | Aflac, Inc. | 54.13 | 1.977 | 39,732 | 13.3 | 26.3 | 0.71 |
| APD | Air Products & Chemicals, Inc. | 237.90 | 1.925 | 52,422 | 29.8 | 57.4 | 0.81 |
| ADM | Archer-Daniels-Midland Co. | 42.50 | 3.259 | 23,659 | 20.1 | 65.5 | 0.81 |
| T | AT&T, Inc. | 37.18 | 5.487 | 271,599 | 16.6 | 91.0 | 0.62 |
| ADP | Automatic Data Processing, Inc. | 170.58 | 1.853 | 73,809 | 31.2 | 57.8 | 1.02 |
| BDX | Becton, Dickinson & Co. | 246.78 | 1.248 | 66,619 | 62.3 | 77.7 | 0.99 |
| BF.B | Brown-Forman Corp. | 67.00 | 0.979 | 31,995 | 39.0 | 38.2 | 0.70 |
| CAH | Cardinal Health, Inc. | 55.41 | 3.456 | 16,206 | -3.9 | -13.6 | 0.92 |
| CAT | Caterpillar, Inc. | 141.52 | 2.551 | 78,212 | 13.3 | 34.0 | 1.39 |
| CB | Chubb Ltd. | 152.51 | 1.941 | 69,117 | 19.2 | 37.2 | 0.62 |
| CVX | Chevron Corp. | 117.34 | 3.997 | 221,874 | 16.7 | 66.8 | 0.86 |
| CINF | Cincinnati Financial Corp. | 107.93 | 2.048 | 17,632 | 19.2 | 39.3 | 0.72 |
| CTAS | Cintas Corp. | 259.46 | 0.983 | 26,854 | 29.8 | 29.3 | 1.01 |
| CLX | The Clorox Co. | 146.38 | 2.760 | 18,371 | 22.9 | 63.2 | 0.44 |
| KO | The Coca-Cola Co. | 53.22 | 2.988 | 228,020 | 29.4 | 87.9 | 0.43 |
| CL | Colgate-Palmolive Co. | 67.21 | 2.529 | 57,601 | 24.9 | 62.9 | 0.54 |
| ED | Consolidated Edison, Inc. | 87.31 | 3.362 | 29,024 | 20.5 | 69.0 | 0.23 |
| DOV | Dover Corp. | 108.57 | 1.778 | 15,771 | 24.2 | 43.1 | 1.07 |
| ECL | Ecolab, Inc. | 186.22 | 0.988 | 53,676 | 35.2 | 34.8 | 0.80 |
| EMR | Emerson Electric Co. | 72.75 | 2.694 | 44,748 | 19.4 | 52.3 | 1.18 |
| XOM | Exxon Mobil Corp. | 68.03 | 4.968 | 287,842 | 19.8 | 98.5 | 0.93 |
| FRT | Federal Realty Investment Trust | 130.96 | 3.138 | 9,972 | 38.9 | 122.1 | 0.52 |
| BEN | Franklin Resources, Inc. | 27.33 | 3.805 | 13,612 | 11.6 | 44.1 | 1.10 |
| GD | General Dynamics Corp. | 184.33 | 2.165 | 53,327 | 15.8 | 34.2 | 0.90 |
| GPC | Genuine Parts Co. | 103.31 | 2.911 | 15,010 | 18.9 | 55.0 | 0.78 |
| HRL | Hormel Foods Corp. | 42.85 | 1.908 | 22,880 | 23.2 | 44.3 | 0.48 |
| ITW | Illinois Tool Works, Inc. | 172.44 | 2.360 | 55,423 | 22.6 | 53.3 | 1.20 |
| JNJ | Johnson & Johnson | 135.94 | 2.722 | 357,776 | 25.6 | 69.7 | 0.60 |
| KMB | Kimberly-Clark Corp. | 134.60 | 3.039 | 46,141 | 22.9 | 69.7 | 0.45 |
| LEG | Leggett & Platt, Inc. | 52.37 | 2.979 | 6,892 | 23.5 | 70.0 | 1.08 |
| LIN | Linde Plc | 206.18 | 1.673 | 110,754 | 21.1 | 35.3 | 0.78 |
| LOW | Lowe's Cos., Inc. | 117.83 | 1.689 | 90,941 | 36.8 | 62.1 | 1.04 |
| MKC | McCormick & Co., Inc. | 167.95 | 1.328 | 22,322 | 31.6 | 41.9 | 0.39 |
| MCD | McDonald's Corp. | 194.13 | 2.390 | 146,197 | 25.2 | 60.3 | 0.43 |
| MDT | Medtronic Plc | 111.79 | 1.825 | 149,985 | 33.9 | 61.9 | 0.67 |
| NUE | Nucor Corp. | 54.10 | 2.957 | 16,403 | 9.2 | 27.3 | 1.15 |
| PBCT | People's United Financial, Inc. | 16.32 | 4.320 | 7,248 | 12.4 | 53.6 | 0.95 |
| PNR | Pentair Plc | 43.18 | 1.656 | 7,258 | 21.0 | 34.7 | 1.20 |
| PEP | PepsiCo, Inc. | 133.74 | 2.815 | 186,491 | 15.2 | 42.7 | 0.53 |
| PPG | PPG Industries, Inc. | 126.50 | 1.542 | 29,912 | 24.8 | 38.3 | 0.90 |
| PG | Procter & Gamble Co. | 122.29 | 2.393 | 304,968 | 76.0 | 181.8 | 0.53 |
| ROP | Roper Technologies, Inc. | 353.08 | 0.524 | 36,740 | 31.7 | 16.6 | 1.04 |
| SPGI | S&P Global, Inc. | 268.10 | 0.824 | 65,523 | 31.6 | 26.0 | 1.00 |
| SHW | The Sherwin-Williams Co. | 576.02 | 0.738 | 53,171 | 38.0 | 28.0 | 0.86 |
| SWK | Stanley Black & Decker, Inc. | 153.67 | 1.737 | 23,359 | 33.0 | 57.3 | 1.52 |
| SYY | Sysco Corp. | 79.82 | 1.954 | 40,726 | 24.2 | 47.2 | 0.51 |
| TROW | T. Rowe Price Group, Inc. | 120.93 | 2.464 | 28,258 | 15.1 | 37.3 | 1.22 |
| TGT | Target Corp. | 126.43 | 2.041 | 64,596 | 20.8 | 42.3 | 0.86 |
| UTX | United Technologies Corp. | 146.65 | 2.005 | 126,573 | 24.5 | 49.2 | 1.08 |
| VFC | VF Corp. | 85.50 | 2.292 | 34,146 | 26.3 | 60.3 | 1.14 |
| GWW | W.W. Grainger, Inc. | 312.35 | 1.793 | 16,825 | 18.1 | 32.5 | 1.08 |
| WMT | Walmart, Inc. | 119.13 | 1.771 | 338,839 | 23.7 | 41.9 | 0.61 |
| WBA | Walgreens Boots Alliance, Inc. | 61.34 | 2.898 | 54,748 | 14.2 | 41.2 | 1.02 |
| Ticker | Name | Price | Dividend Yield | Market Cap ($M) | P/E Ratio | Payout Ratio | Beta |
In order to achieve Dividend Aristocrat status, a company must have clear competitive advantages that it can sustain over long periods of time. It must have a strong position in its industry, a highly profitable business model, and the ability to grow through innovation.
Ecolab (ECL) is a perfect example of a company that possess all of these qualities. This article will examine the various factors behind Ecolab’s rise to prominence.
Business Overview
Ecolab was created in 1923, when its founder Merritt J. Osborn invented a new cleaning product called “Absorbit”. This product cleaned carpets without the need for businesses to shut down operations to conduct carpet cleaning. Osborn created a company revolving around the product, called Economics Laboratory, or Ecolab.
Today, Ecolab is the industry leader and generates annual sales of roughly $15 billion.
Ecolab operates three major business segments: Global Industrial, Global Institutional, and Global Energy, each of roughly equal size. The business is diversified in terms of operating segments, and also geography. Approximately 42% of the company’s sales took place outside North America in 2018.
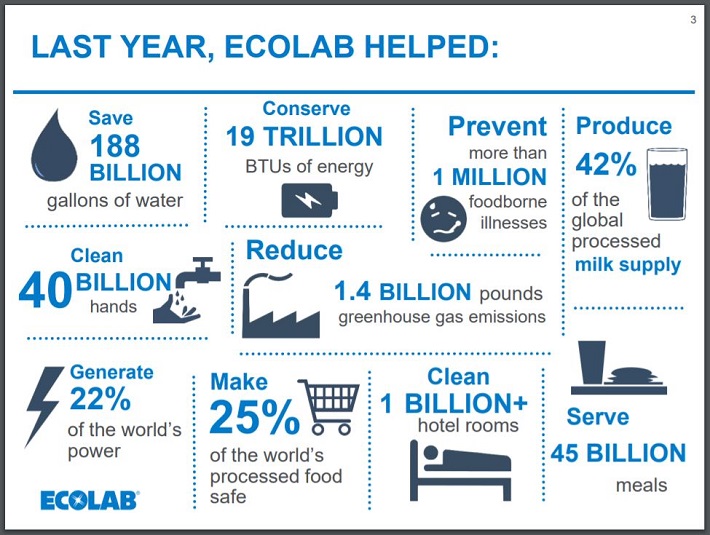
Source: Investor Presentation
The Global Industrial group provides water treatment, cleaning, and sanitation. Customers in this segment are primarily large firms in the food and beverage, manufacturing, chemical, and mining industries.
The Global Institutional business provides specialized cleaning and sanitation services, such as on-premise laundry, housekeeping, and food safety. Customers are primarily in the foodservice, hospitality, lodging, healthcare, and retail industries.
Lastly, the Global Energy segment includes the Nalco brand. Nalco provides chemical and water treatment services to the petroleum and petrochemical industries, specifically to oilfield services and refineries. Ecolab is planning to spin off its upstream energy business in mid-2020.
Growth Prospects
Ecolab has many positive growth catalysts. One of the company’s most important growth catalysts is acquisitions.
In 2016, Ecolab acquired UltraClenz, a developer of electronic hand hygiene systems and dispensers. It also acquired Anios, a European healthcare and hygiene business. These deals helped Ecolab expand its scale, particularly in the international markets.
In 2017, Ecolab announced the acquisition of Georgia Pacific’s paper chemicals business. The purchase will help boost Ecolab’s growing paper business, which helps paper manufactures improve their efficiency, product quality, and profitability.
More recently, Ecolab announced last December that it would be purchasing U.K. based Holchem Group Limited for US$56 million. Holchem Group Limited is a supplier of hygiene and cleaning products and services for the foodservice and hospitality industries. In early October, the U.K. antitrust authorities blocked the deal due to concerns regarding reduced competition.
Ecolab has proven successful at integrating other acquisitions, so we remain positive on the company’s ability to do so in the future.
Acquisitions such as these, along with organic investment, have fueled steady earnings growth for decades.
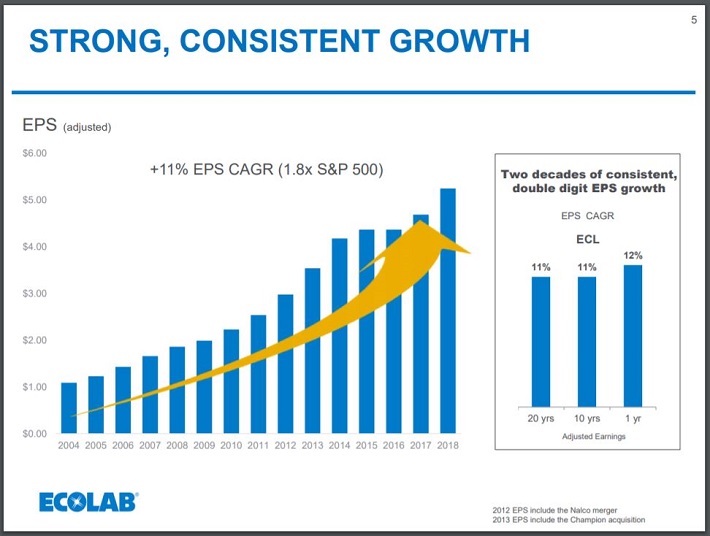
Source: Investor Presentation
Ecolab generates steady growth. In 2018, adjusted earnings-per-share grew 12% to $4.25. Growth returned with improving volume growth, and higher pricing, across all business segments.
2019 has also been a year of growth for the company. Through the first three quarters of 2019, Ecolab has seen adjusted earnings-per-share increase 12.1%. Revenue is up 1.7% to $11.1 billion over this same time period.
Ecolab has been able to accomplish this growth even in the face of higher raw material and transportation costs as well as a higher tax rate through sizable product price hikes. However, Ecolab’s management lowered its guidance for adjusted earnings-per-share to $5.80-$5.90 from $5.80-$6.00. Still, the midpoint would represent an 11.4% increase from the previous year, a strong growth rate for this Dividend Aristocrat.
Competitive Advantages & Recession Performance
Ecolab’s many competitive advantages include scale, a strong reputation among its customers, and innovation.
Ecolab serves more than 1 million customer locations, spread across more than 170 countries. The company is not afraid to spend significant resources on research and development of new products and services.
Management refers to R&D spending as its “innovation pipeline”. Ecolab often spends more than a $1 billion on the innovation pipeline. Due in large part to this R&D spend, the company’s number of patents in nearing 8,000.
Ecolab’s R&D investments and intellectual property help the company stay ahead of the competition.

Source: Investor Presentation
Ecolab’s R&D investments have created an incredibly strong business, one that can hold up very well even during economic downturns. For clear evidence of Ecolab’s competitive advantages, look no further than its performance during the Great Recession:
- 2006 earnings-per-share of $1.43
- 2007 earnings-per-share of $1.66 (16% increase)
- 2008 earnings-per-share of $1.86 (12% increase)
- 2009 earnings-per-share of $1.99 (7% increase)
- 2010 earnings-per-share of $2.23 (12% increase)
Ecolab’s growth during the Great Recession was truly remarkable. Not only did the company generate positive earnings growth in each year of the recession, but in three of those years, it achieved double-digit earnings growth. This growth came during arguably the worst economic downturn in the U.S. since the Great Depression. Ecolab’s recession performance makes abundantly clear that the company holds sustainable competitive advantages.
Valuation & Expected Returns
Based on the current trading price of $186 and expected earnings-per-share of $5.85, Ecolab has a price-to-earnings ratio of 31.8. The company is expected to produce 9% annual earnings growth due to its history of its business model and strong execution.
The stock has a five-year average price-to-earnings ratio of 26.7. We have a target price-to-earnings ratio of 20. If shares of Ecolab were to return to our target valuation by 2024, this would reduce total annual returns by 8.9%.
The stock is in danger of experiencing contraction of the valuation multiple, which would negatively impact total returns. A breakdown of potential returns is as follows:
- 9.0% earnings growth
- 1.0% dividend yield
- 8.9% valuation reversion
We expect that Ecolab will offer a total annual return of 1.1% through 2024. This is a fairly weak expected return, primarily due to the high valuation. The stock’s current valuation is well above our target, and a decline toward fair value would be a significant headwind for investors buying at the current price.
Ecolab’s dividend is not likely to represent a large portion of total returns. This is because the current dividend yield is just 1.0%. This is about half the average dividend yield of the S&P 500 Index. While Ecolab is an attractive dividend growth stock due to its high rate of dividend increases, it is not as appealing for investors looking for high yields.
Final Thoughts
Ecolab has an excellent track record of profitability and growth and is one of the few companies to have a dividend growth streak of at least 25 years. However, now is not the best time to buy the stock, due to its high valuation, low dividend yield and low projected total returns through 2024.
Ecolab is not likely to be an attractive stock for investors interested solely in high levels of income. That said, it is a very strong stock for investors interested in a recession-resistant business, and dividend growth.