


Updated on November 21st, 2019 by Eli Inkrot
Chevron (CVX) is one of the largest and most well-known oil stocks in the world.
It is also one of the most stable, having increased its dividend for 32 consecutive years. As a result, Chevron is a member of the exclusive Dividend Aristocrats – a group of 57 elite dividend stocks with 25+ years of consecutive dividend increases.
In addition to the full downloadable spreadsheet, you can see a preview of the Dividend Aristocrats list in the table below:
| MMM | 3M Co. | 167.77 | 3.386 | 96,476 | 19.6 | 66.4 | 1.07 |
| AOS | A. O. Smith Corp. | 48.09 | 1.830 | 6,591 | 19.8 | 36.3 | 0.91 |
| ABT | Abbott Laboratories | 83.89 | 1.526 | 148,267 | 45.1 | 68.9 | 1.06 |
| ABBV | AbbVie, Inc. | 87.20 | 4.908 | 128,953 | 40.0 | 196.3 | 0.87 |
| AFL | Aflac, Inc. | 54.13 | 1.977 | 39,732 | 13.3 | 26.3 | 0.71 |
| APD | Air Products & Chemicals, Inc. | 237.90 | 1.925 | 52,422 | 29.8 | 57.4 | 0.81 |
| ADM | Archer-Daniels-Midland Co. | 42.50 | 3.259 | 23,659 | 20.1 | 65.5 | 0.81 |
| T | AT&T, Inc. | 37.18 | 5.487 | 271,599 | 16.6 | 91.0 | 0.62 |
| ADP | Automatic Data Processing, Inc. | 170.58 | 1.853 | 73,809 | 31.2 | 57.8 | 1.02 |
| BDX | Becton, Dickinson & Co. | 246.78 | 1.248 | 66,619 | 62.3 | 77.7 | 0.99 |
| BF.B | Brown-Forman Corp. | 67.00 | 0.979 | 31,995 | 39.0 | 38.2 | 0.70 |
| CAH | Cardinal Health, Inc. | 55.41 | 3.456 | 16,206 | -3.9 | -13.6 | 0.92 |
| CAT | Caterpillar, Inc. | 141.52 | 2.551 | 78,212 | 13.3 | 34.0 | 1.39 |
| CB | Chubb Ltd. | 152.51 | 1.941 | 69,117 | 19.2 | 37.2 | 0.62 |
| CVX | Chevron Corp. | 117.34 | 3.997 | 221,874 | 16.7 | 66.8 | 0.86 |
| CINF | Cincinnati Financial Corp. | 107.93 | 2.048 | 17,632 | 19.2 | 39.3 | 0.72 |
| CTAS | Cintas Corp. | 259.46 | 0.983 | 26,854 | 29.8 | 29.3 | 1.01 |
| CLX | The Clorox Co. | 146.38 | 2.760 | 18,371 | 22.9 | 63.2 | 0.44 |
| KO | The Coca-Cola Co. | 53.22 | 2.988 | 228,020 | 29.4 | 87.9 | 0.43 |
| CL | Colgate-Palmolive Co. | 67.21 | 2.529 | 57,601 | 24.9 | 62.9 | 0.54 |
| ED | Consolidated Edison, Inc. | 87.31 | 3.362 | 29,024 | 20.5 | 69.0 | 0.23 |
| DOV | Dover Corp. | 108.57 | 1.778 | 15,771 | 24.2 | 43.1 | 1.07 |
| ECL | Ecolab, Inc. | 186.22 | 0.988 | 53,676 | 35.2 | 34.8 | 0.80 |
| EMR | Emerson Electric Co. | 72.75 | 2.694 | 44,748 | 19.4 | 52.3 | 1.18 |
| XOM | Exxon Mobil Corp. | 68.03 | 4.968 | 287,842 | 19.8 | 98.5 | 0.93 |
| FRT | Federal Realty Investment Trust | 130.96 | 3.138 | 9,972 | 38.9 | 122.1 | 0.52 |
| BEN | Franklin Resources, Inc. | 27.33 | 3.805 | 13,612 | 11.6 | 44.1 | 1.10 |
| GD | General Dynamics Corp. | 184.33 | 2.165 | 53,327 | 15.8 | 34.2 | 0.90 |
| GPC | Genuine Parts Co. | 103.31 | 2.911 | 15,010 | 18.9 | 55.0 | 0.78 |
| HRL | Hormel Foods Corp. | 42.85 | 1.908 | 22,880 | 23.2 | 44.3 | 0.48 |
| ITW | Illinois Tool Works, Inc. | 172.44 | 2.360 | 55,423 | 22.6 | 53.3 | 1.20 |
| JNJ | Johnson & Johnson | 135.94 | 2.722 | 357,776 | 25.6 | 69.7 | 0.60 |
| KMB | Kimberly-Clark Corp. | 134.60 | 3.039 | 46,141 | 22.9 | 69.7 | 0.45 |
| LEG | Leggett & Platt, Inc. | 52.37 | 2.979 | 6,892 | 23.5 | 70.0 | 1.08 |
| LIN | Linde Plc | 206.18 | 1.673 | 110,754 | 21.1 | 35.3 | 0.78 |
| LOW | Lowe's Cos., Inc. | 117.83 | 1.689 | 90,941 | 36.8 | 62.1 | 1.04 |
| MKC | McCormick & Co., Inc. | 167.95 | 1.328 | 22,322 | 31.6 | 41.9 | 0.39 |
| MCD | McDonald's Corp. | 194.13 | 2.390 | 146,197 | 25.2 | 60.3 | 0.43 |
| MDT | Medtronic Plc | 111.79 | 1.825 | 149,985 | 33.9 | 61.9 | 0.67 |
| NUE | Nucor Corp. | 54.10 | 2.957 | 16,403 | 9.2 | 27.3 | 1.15 |
| PBCT | People's United Financial, Inc. | 16.32 | 4.320 | 7,248 | 12.4 | 53.6 | 0.95 |
| PNR | Pentair Plc | 43.18 | 1.656 | 7,258 | 21.0 | 34.7 | 1.20 |
| PEP | PepsiCo, Inc. | 133.74 | 2.815 | 186,491 | 15.2 | 42.7 | 0.53 |
| PPG | PPG Industries, Inc. | 126.50 | 1.542 | 29,912 | 24.8 | 38.3 | 0.90 |
| PG | Procter & Gamble Co. | 122.29 | 2.393 | 304,968 | 76.0 | 181.8 | 0.53 |
| ROP | Roper Technologies, Inc. | 353.08 | 0.524 | 36,740 | 31.7 | 16.6 | 1.04 |
| SPGI | S&P Global, Inc. | 268.10 | 0.824 | 65,523 | 31.6 | 26.0 | 1.00 |
| SHW | The Sherwin-Williams Co. | 576.02 | 0.738 | 53,171 | 38.0 | 28.0 | 0.86 |
| SWK | Stanley Black & Decker, Inc. | 153.67 | 1.737 | 23,359 | 33.0 | 57.3 | 1.52 |
| SYY | Sysco Corp. | 79.82 | 1.954 | 40,726 | 24.2 | 47.2 | 0.51 |
| TROW | T. Rowe Price Group, Inc. | 120.93 | 2.464 | 28,258 | 15.1 | 37.3 | 1.22 |
| TGT | Target Corp. | 126.43 | 2.041 | 64,596 | 20.8 | 42.3 | 0.86 |
| UTX | United Technologies Corp. | 146.65 | 2.005 | 126,573 | 24.5 | 49.2 | 1.08 |
| VFC | VF Corp. | 85.50 | 2.292 | 34,146 | 26.3 | 60.3 | 1.14 |
| GWW | W.W. Grainger, Inc. | 312.35 | 1.793 | 16,825 | 18.1 | 32.5 | 1.08 |
| WMT | Walmart, Inc. | 119.13 | 1.771 | 338,839 | 23.7 | 41.9 | 0.61 |
| WBA | Walgreens Boots Alliance, Inc. | 61.34 | 2.898 | 54,748 | 14.2 | 41.2 | 1.02 |
| Ticker | Name | Price | Dividend Yield | Market Cap ($M) | P/E Ratio | Payout Ratio | Beta |
Due to the industry’s reliance on high commodity prices for profitability, there are just two energy stocks on the list of Dividend Aristocrats – Chevron and Exxon Mobil (XOM). Chevron’s dividend consistency and stability help it to stand out in the otherwise-volatile energy industry.
This article will analyze the intermediate-term investment prospects of Chevron.
Business Overview
Chevron is one of six oil and gas supermajors, along with:
- BP (BP)
- Eni SpA (E)
- Total SA (TOT)
- Exxon Mobil (XOM)
- Royal Dutch Shell (RDS-B)
Chevron is one of only two oil and gas supermajors to be headquartered in the United States, along with fellow Dividend Aristocrat Exxon Mobil. Like the other integrated supermajors, Chevron engages in upstream oil and gas production, as well as downstream refining businesses.
After a difficult period for the oil and gas supermajors from 2014-2016, when oil prices sank from over $100 per barrel to under $30 per barrel, the industry has enjoyed a recovery as of late.
Indeed, Chevron actually posted a loss in 2016, before rebounding to $3.79 and $7.74 in earnings-per-share in 2017 and 2018, respectively. These numbers are still well below the company’s peak ($13.44 in 2011), but they do show that the environment has improved somewhat.
In early November, Chevron reported (11/1/19) financial results for the third quarter of fiscal 2019. The company grew its production 3% over last year’s quarter thanks to 55% growth in the Permian Basin. However, the average realized price of oil and gas slumped over last year’s quarter. In addition, Chevron incurred a tax charge of $430 million due to repatriation of cash. As a result, its earnings fell from $4.0 billion in last year’s quarter to $2.6 billion and its earnings-per-share dropped from $2.11 to $1.36.
For the first 9 months of 2019, Chevron has generated $9.5 billion in profit, down from $11.1 billion in the prior year, with earnings-per-share of $5.02 compared to $5.79 previously. For the full the expectation is for the company to earn roughly $6.60 per share.
Growth Prospects
Chevron is one of the largest publicly-traded energy corporations in the world and stands to benefit tremendously from the continued rebound and stabilization in oil prices. Moreover, the demand for the company’s products is a very long-tail event.
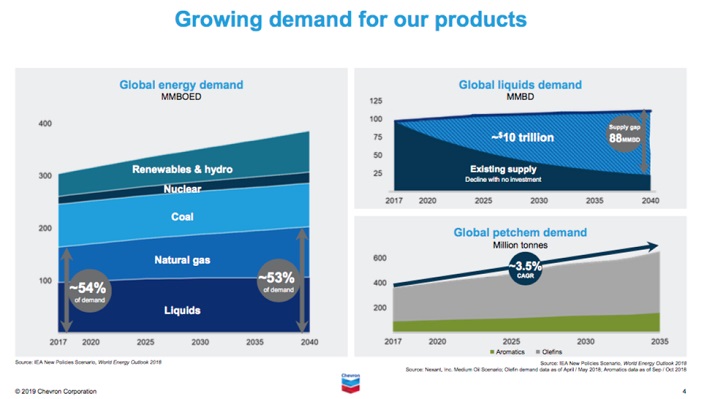
Source: Chevron 2019 Investor Presentation
Chevron invested heavily in growth projects for years but failed to grow its output during the last decade. However, Chevron is now in the positive phase of its investing cycle, as it is growing its output thanks to past investments while it has simultaneously reduced its capital expenses.
Chevron grew its output by 5% in 2017 and 7% in 2018 and expects to grow its output by 4%-7% this year and by 3%-4% per year until 2024.

Source: Chevron 2019 Investor Presentation
We believe that the sustained growth in the Permian Basin and in Australia will help the oil major meet its production guidance. Notably, Chevron has more than doubled the value of its assets in the Permian in the last two years thanks to new discoveries and technological advances.
Chevron also learned its lesson from the recent downturn and now invests most of its funds on projects that begin delivering cash flows within two years. We continue to expect the company to grow its earnings-per-share by about 8% per year on average over the next five years.
Furthermore, the dividend should continue to grow as well, as the company continues its 30+ year streak of higher payouts. This does not necessarily mean that investors will receive a dividend boost each and every four quarters. There have been numerous instances when Chevron held the dividend steady for more than four quarters and eventually increased it such that the year-over-year comparison showed improvement.
The important thing to note is that Chevron is committed to the payout in all environments.
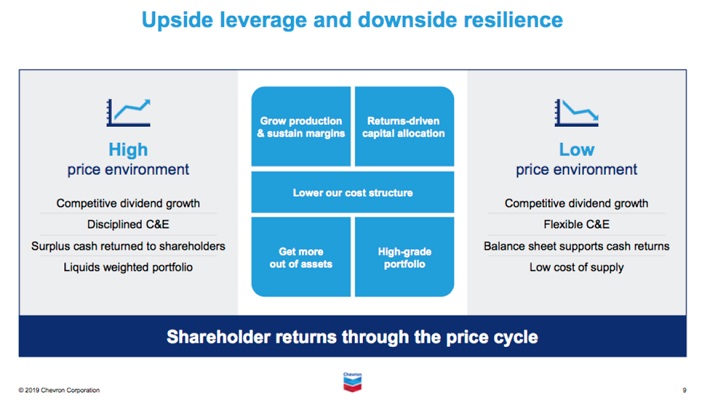
Source: Chevron 2019 Investor Presentation
Chevron has multiple competitive advantages that provide the company with growth opportunities over the long-term. While it is vulnerable to recessions, due to its commodity exposure, it has proved the ability to raise its dividend consistently, even during recessions.
Competitive Advantages & Recession Performance
Chevron’s competitive advantage in the highly-cyclical energy sector comes primarily from its size and financial strength. The company’s operational expertise allowed it to successfully navigate 2014-2016, one of the worst oil bear markets on record.
Chevron’s aggressive cost-cutting efforts helped it maintain consistent profitability. Chevron reduced its capital expenditures and exploratory budget from ~$10 billion to ~$5 billion between fiscal 2014 and fiscal 2015. The company has continued to reduce drilling costs, making it more profitable even if oil prices do not get back to $100 per barrel.
In fact, today Chevron claims to be the best-positioned for commodity price uncertainty, as it boasts one of the lowest cash flow breakeven among its oil major counterparts.
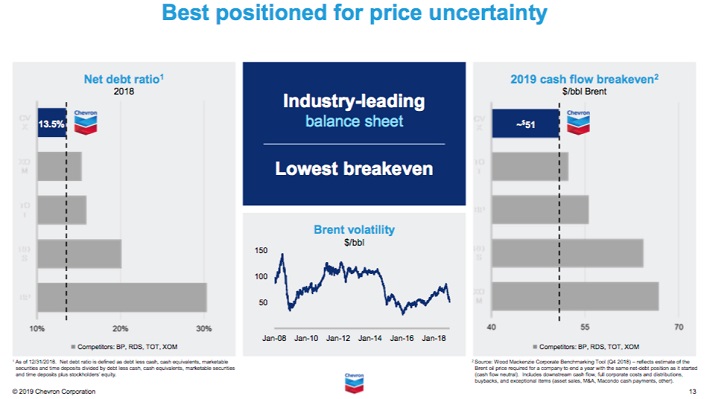
Source: Chevron 2019 Investor Presentation
Chevron stacks up well among its peer in the energy sector. However, the company is certainly not the most recession-resistant Dividend Aristocrat, as evidenced by its performance during the 2007-2009 financial crisis:
- 2007 adjusted earnings-per-share: $8.77
- 2008 adjusted earnings-per-share: $11.67 (33% increase)
- 2009 adjusted earnings-per-share: $5.24 (55% decline)
- 2010 adjusted earnings-per-share: $9.48 (81% increase)
Chevron’s adjusted earnings-per-share declined by more than 50% during the 2007-2009 financial crisis, but the company did manage to remain profitable during a bear market that drove many of its competitors out of business. This allowed Chevron to continue raising its dividend payment each year of the Great Recession and indeed for the last 3 decades. Chevron’s dividend safety is far above the average in the energy industry.
Valuation & Expected Total Returns
Chevron’s expected total returns are more difficult to assess than many of the companies we cover at Sure Dividend. This is primarily due to the fact that the company’s earnings can be quite volatile.
With a share price near $118 currently, the price-to-earnings ratio has declined somewhat to 17.8 times this year’s expectation. If the security were to revert to its 10-year average of 15.8, this would result in a -2% to -3% annualized valuation headwind.
Shareholder returns will be fueled by the possibility of growth (which will be lumpy over the short-term) and the 4.0% starting dividend yield, perhaps offset by the valuation to a moderate degree. Looking at these components collectively, total expected returns could be in the 8% to 10% range over the intermediate-term. This is a solid expected rate of return for a high-quality Dividend Aristocrat.
Final Thoughts
Chevron is one of the rare oil and gas companies that was able to navigate through both the Great Recession of 2007-2009 and the oil downturn of 2014-2016, without cutting its dividend. It has even managed to grow its dividend lately, including a 3.7% increase in 2018 and a 6.3% increase in 2019.
As a result of Chevron’s lower cost structure, it can now profitably handle a much lower average price of oil. Further, new projects in the U.S. and international markets will also help the company continue to grow.
Chevron’s stock appears to be reasonably valued at this juncture, with expected returns in the high single-digits over the next five years. It also has high appeal for income investors due to its 4% yield and annual dividend increases.