


Updated on December 9th, 2019 by Nate Parsh
The Dividend Aristocrats are a group of stocks in the S&P 500 Index, with 25+ years of consecutive dividend increases. These companies have high-quality business models that have stood the test of time, and showed a remarkable ability to raise dividends every year regardless of the economy.
You can download an Excel spreadsheet with the full list of Dividend Aristocrats by using the link below:
In addition to the downloadable spreadsheet, you can see a preview of the Dividend Aristocrats list in the table below:
| 3M Co. | 171.47 | 3.3 | 98,603 | 20.0 | 66.4 | 1.12 |
| A. O. Smith Corp. | 46.79 | 1.9 | 6,412 | 19.3 | 36.3 | 0.87 |
| Abbott Laboratories | 85.48 | 1.5 | 151,077 | 46.0 | 68.9 | 1.04 |
| AbbVie, Inc. | 86.98 | 4.9 | 128,627 | 39.9 | 196.3 | 0.87 |
| Aflac, Inc. | 52.99 | 2.0 | 38,895 | 13.0 | 26.3 | 0.72 |
| Air Products & Chemicals, Inc. | 232.03 | 2.0 | 51,147 | 29.1 | 57.4 | 0.81 |
| Archer-Daniels-Midland Co. | 43.91 | 3.2 | 24,444 | 20.8 | 65.5 | 0.83 |
| AT&T, Inc. | 38.20 | 5.3 | 279,051 | 17.1 | 91.0 | 0.58 |
| Automatic Data Processing, Inc. | 169.98 | 1.9 | 73,550 | 31.1 | 57.8 | 1.02 |
| Becton, Dickinson & Co. | 260.69 | 1.2 | 70,506 | 65.8 | 77.8 | 1.01 |
| Brown-Forman Corp. | 63.35 | 1.0 | 30,271 | 35.4 | 37.1 | 0.66 |
| Cardinal Health, Inc. | 54.87 | 3.5 | 16,048 | -3.9 | -13.6 | 0.95 |
| Caterpillar, Inc. | 142.72 | 2.5 | 78,875 | 13.4 | 34.0 | 1.31 |
| Chubb Ltd. | 152.20 | 1.9 | 68,977 | 19.1 | 37.2 | 0.66 |
| Chevron Corp. | 118.01 | 4.0 | 223,141 | 16.8 | 66.8 | 0.86 |
| Cincinnati Financial Corp. | 105.37 | 2.1 | 17,214 | 18.7 | 39.3 | 0.74 |
| Cintas Corp. | 256.22 | 1.0 | 26,518 | 29.4 | 29.3 | 0.96 |
| The Clorox Co. | 151.86 | 2.7 | 19,058 | 23.8 | 63.2 | 0.48 |
| The Coca-Cola Co. | 54.42 | 2.9 | 233,161 | 30.1 | 87.9 | 0.47 |
| Colgate-Palmolive Co. | 68.24 | 2.5 | 58,484 | 25.3 | 62.9 | 0.58 |
| Consolidated Edison, Inc. | 86.79 | 3.4 | 28,851 | 20.4 | 69.0 | 0.28 |
| Dover Corp. | 112.59 | 1.7 | 16,355 | 25.1 | 43.1 | 1.11 |
| Ecolab, Inc. | 186.41 | 1.0 | 53,731 | 35.2 | 34.8 | 0.82 |
| Emerson Electric Co. | 75.09 | 2.6 | 45,741 | 20.1 | 52.3 | 1.19 |
| Exxon Mobil Corp. | 69.51 | 4.9 | 294,104 | 20.3 | 98.5 | 0.94 |
| Federal Realty Investment Trust | 131.77 | 3.1 | 10,034 | 39.1 | 122.1 | 0.53 |
| Franklin Resources, Inc. | 27.00 | 3.9 | 13,447 | 11.5 | 44.1 | 1.17 |
| General Dynamics Corp. | 183.55 | 2.2 | 53,102 | 15.8 | 34.2 | 0.90 |
| Genuine Parts Co. | 103.70 | 2.9 | 15,066 | 19.0 | 55.0 | 0.81 |
| Hormel Foods Corp. | 45.34 | 1.9 | 24,210 | 24.8 | 45.9 | 0.49 |
| Illinois Tool Works, Inc. | 174.19 | 2.3 | 55,985 | 22.8 | 53.3 | 1.21 |
| Johnson & Johnson | 140.38 | 2.6 | 369,461 | 26.5 | 69.7 | 0.65 |
| Kimberly-Clark Corp. | 136.98 | 3.0 | 46,957 | 23.3 | 69.7 | 0.53 |
| Leggett & Platt, Inc. | 53.07 | 2.9 | 6,984 | 23.8 | 70.0 | 1.07 |
| Linde Plc | 205.53 | 1.7 | 110,405 | 21.0 | 35.3 | 0.77 |
| Lowe's Cos., Inc. | 116.28 | 1.8 | 89,125 | 30.7 | 54.4 | 1.04 |
| McCormick & Co., Inc. | 171.99 | 1.3 | 22,859 | 32.4 | 41.9 | 0.42 |
| McDonald's Corp. | 195.35 | 2.4 | 147,116 | 25.4 | 60.3 | 0.45 |
| Medtronic Plc | 113.09 | 1.8 | 151,583 | 32.5 | 59.7 | 0.66 |
| Nucor Corp. | 57.61 | 2.8 | 17,468 | 9.8 | 27.3 | 1.19 |
| People's United Financial, Inc. | 16.51 | 4.3 | 7,332 | 12.6 | 53.6 | 0.96 |
| Pentair Plc | 44.79 | 1.6 | 7,528 | 21.8 | 34.7 | 1.23 |
| PepsiCo, Inc. | 137.36 | 2.7 | 191,538 | 15.6 | 42.7 | 0.55 |
| PPG Industries, Inc. | 132.54 | 1.5 | 31,340 | 26.0 | 38.3 | 0.91 |
| Procter & Gamble Co. | 124.19 | 2.4 | 309,706 | 77.1 | 181.8 | 0.57 |
| Roper Technologies, Inc. | 346.22 | 0.5 | 36,026 | 31.1 | 16.6 | 1.03 |
| S&P Global, Inc. | 274.38 | 0.8 | 67,058 | 32.3 | 26.0 | 0.96 |
| The Sherwin-Williams Co. | 578.54 | 0.7 | 53,404 | 38.2 | 28.0 | 0.88 |
| Stanley Black & Decker, Inc. | 158.87 | 1.7 | 24,150 | 34.1 | 57.3 | 1.51 |
| Sysco Corp. | 82.77 | 1.9 | 42,231 | 25.1 | 47.2 | 0.51 |
| T. Rowe Price Group, Inc. | 123.90 | 2.4 | 28,952 | 15.5 | 37.3 | 1.24 |
| Target Corp. | 125.03 | 2.1 | 63,357 | 19.8 | 41.2 | 0.81 |
| United Technologies Corp. | 146.99 | 2.0 | 126,866 | 24.6 | 49.2 | 1.18 |
| VF Corp. | 90.42 | 2.2 | 36,111 | 27.8 | 60.3 | 1.14 |
| W.W. Grainger, Inc. | 321.49 | 1.7 | 17,317 | 18.7 | 32.5 | 1.03 |
| Walmart, Inc. | 119.78 | 1.8 | 339,837 | 23.8 | 41.9 | 0.58 |
| Walgreens Boots Alliance, Inc. | 58.63 | 3.0 | 52,329 | 13.6 | 41.2 | 1.04 |
| Name | Price | Dividend Yield | Market Cap ($M) | Forward P/E Ratio | Payout Ratio | Beta |
The list of Dividend Aristocrats is diversified across multiple sectors, including consumer goods, financials, industrials, and healthcare. One group that is surprisingly under-represented, is the utility sector. There is only one utility stock on the list of Dividend Aristocrats: Consolidated Edison (ED).
The fact that there is only one utility on the list may come as a surprise, especially since utilities are widely regarded as being steady dividend stocks.
Consolidated Edison is about as consistent a dividend stock as they come. The company has over 100+ years of steady dividends and more than 40 years of annual dividend increases.
This article will discuss what makes Consolidated Edison an appealing stock for income investors.
Business Overview
Consolidated Edison is a large-cap utility. The company generates approximately $12 billion in annual revenue and has a market capitalization of nearly $29 billion.
The company serves over 3 million electric customers, and another 1 million gas customers, in New York. It operates electric, gas, steam transmission, and green energy businesses.

Source: Investor Presentations
2019 has been an uneven year for Consolidated Edison. The company’s revenue declined 1.1% to $3.4 billion in the third quarter. Adjusted earnings-per-share declined 2% to $1.54. Both results were lower than expected by the analyst community.
Consolidated Edison’s New York operations added $0.11 to quarterly results, but higher expenses, maintenance costs and property taxes more than offset these benefits. The company recognized a $5 million negative revenue adjustment during the quarter due to a July 31st, 2019 power outage on Manhattan’s west side that left more than 72,000 customers without power.
Consolidated Edison should continue to generate modest earnings growth each year, through a combination of new customer acquisitions and rate increases.
Growth Prospects
Earnings growth across the utility industry typically mimics GDP growth. Over the next five years, we expect Consolidated Edison to increase earnings-per-share by 3.5% per year.
The growth drivers for Consolidated Edison are new customers and rate increases. One benefit of operating in a regulated industry is that utilities are permitted to raise rates on a regular basis, which virtually assures a steady level of growth.
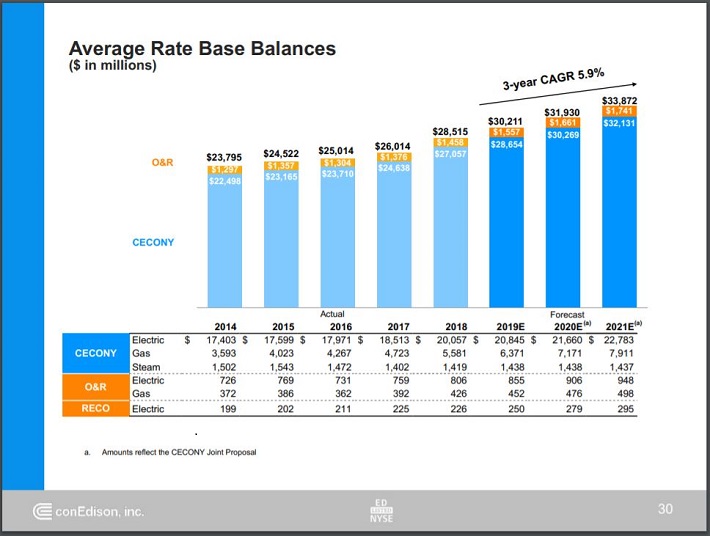
Source: Investor Presentation
In 2018, the company received approval for rate base plans over the next three years, in both the electric and gas delivery segments. Consolidated Edison expects to increase its rate base by 5.9% each year, through 2021. This is a natural way for a utility to generate steady revenue and earnings growth.
One potential threat to future growth is rising interest rates, which could increase the cost of capital for companies that utilize debt, such as utilities. Fortunately, the Federal Reserve has cut rates several times this year, making it unlikely that policy will be reversed and rates will be raised. Lowering rates helps companies that rely heavily on debt financing, such as utilities, so investors do not need to be concerned about Consolidated Edison in a falling-rate cycle.
Even if rates do go up, Consolidated Edison is in strong financial condition. It has an investment-grade credit rating of BBB+, and a modest capital structure with balanced debt maturities over the next several years. A healthy balance sheet and strong business model help provide security to Consolidated Edison’s dividends. Investors can reasonably expect low double-digit dividend increases each year, at a rate similar to the company’s annual earnings-per-share growth.
Competitive Advantages & Recession Performance
Consolidated Edison’s main competitive advantage is the high regulatory hurdles of the utility industry. Electricity and gas service are necessary and vital to society. As a result, the industry is highly regulated, making it virtually impossible for a new competitor to enter the market. This provides a great deal of certainty to Consolidated Edison.
In addition, the utility business model is highly recession-resistant. While many companies experienced large earnings declines in 2008 and 2009, Consolidated Edison held up relatively well. Earnings-per-share during the Great Recession are shown below:
- 2007 earnings-per-share of $3.48
- 2008 earnings-per-share of $3.36 (3% decline)
- 2009 earnings-per-share of $3.14 (7% decline)
- 2010 earnings-per-share of $3.47 (11% increase)
Consolidated Edison’s earnings fell in 2008 and 2009, but recovered in 2010. The company still generated healthy profits, even during the worst of the economic downturn. This resilience allowed Consolidated Edison to continue increasing its dividend each year.
Valuation & Expected Returns
Consolidated Edison lowered its full year forecast following third quarter results and now expects earnings-per-share in a range of $4.25 and $4.45 for 2019. Using the current share price of $87 and the midpoint of updated guidance, the stock trades with a price-to-earnings ratio of 20. This is above our fair value estimate of 15.4, which is equal to the 10-year average price-to-earnings ratio for the stock.
As a result, Consolidated Edison shares appear to be overvalued. If the stock valuation retraces to the fair value estimate, the corresponding multiple contraction would reduce annual returns by 5.1%. This could be a significant headwind for future returns.
Fortunately, the stock could still provide positive returns to shareholders, through earnings growth and dividends. We expect the company to grow earnings by 3.5% per year over the next five years. In addition, the stock has a current dividend yield of 3.4%. Consolidated Edison last raised its dividend by 3.5% for the March 15th, 2019 payment. This marks the 44th year of dividend growth.
Putting it all together, Consolidated Edison’s total expected returns could look like the following:
- 3.5% earnings growth
- 5.1% multiple reversion
- 3.4% dividend yield
Added up and Consolidated Edison is expected to return just 1.8% annually over the next five years. This is a poor rate of return, which makes the stock unattractive for investors interested in total returns.
Income investors may find the yield attractive, but it should be noted that the current yield is at the low end of its average yield over the last 10 years. The company has a projected 2019 payout ratio below 70%, which indicates a sustainable dividend. However, growth investors or those looking for a higher rate of return are likely not attracted to Consolidated Edison stock.
Final Thoughts
Consolidated Edison stock is overvalued currently, making it relatively unattractive for value investors today. The run-up in utility stocks over the past several years has far exceeded their earnings growth in the same period, resulting in bloated valuation multiples across the utility sector.
That said, Consolidated Edison can still serve a valuable purpose in an income investor’s portfolio. The stock offers secure dividend income, and its 3.4% dividend yield exceeds the 1.8% average dividend yield of the S&P 500 Index. Consolidated Edison is also a Dividend Aristocrat, and should raise its dividend each year. Therefore, risk-averse investors looking primarily for income right now–such as retirees–could see greater value in buying utility stocks like Consolidated Edison.
That being said, shares are quite expensive at the moment, with a very low expected rate of return, which means Consolidated Edison is a sell recommendation from Sure Dividend.