


Updated on December 4th, 2019 by Josh Arnold
Long histories of dividend growth are not typical in the energy sector. The oil and gas industry is highly cyclical, which often prevents companies from raising their dividends every year without interruption. When oil and gas prices are high, energy companies enjoy a windfall that flows through to investors. But when commodity prices decline, profits evaporate, and in some cases, dividends as well.
As a result, there are just two energy stocks on the list of Dividend Aristocrats. One of them, Exxon Mobil (XOM), is the largest oil company in the U.S.
In addition to the downloadable spreadsheet, you can see a preview of the Dividend Aristocrats list in the table below:
| 3M Co. | 165.17 | 3.4 | 94,981 | 19.3 | 66.4 | 1.09 |
| A. O. Smith Corp. | 46.70 | 1.9 | 6,400 | 19.3 | 36.3 | 0.91 |
| Abbott Laboratories | 84.36 | 1.5 | 149,097 | 45.4 | 68.9 | 1.05 |
| AbbVie, Inc. | 85.95 | 5.0 | 127,104 | 39.4 | 196.3 | 0.89 |
| Aflac, Inc. | 51.73 | 2.1 | 37,970 | 12.7 | 26.3 | 0.74 |
| Air Products & Chemicals, Inc. | 229.69 | 2.0 | 50,613 | 28.8 | 57.4 | 0.81 |
| Archer-Daniels-Midland Co. | 42.92 | 3.2 | 23,892 | 20.3 | 65.5 | 0.82 |
| AT&T, Inc. | 37.55 | 5.4 | 274,302 | 16.8 | 91.0 | 0.59 |
| Automatic Data Processing, Inc. | 167.13 | 1.9 | 72,316 | 30.6 | 57.8 | 1.02 |
| Becton, Dickinson & Co. | 255.73 | 1.2 | 69,035 | 64.6 | 77.8 | 1.01 |
| Brown-Forman Corp. | 66.70 | 1.0 | 31,851 | 38.9 | 38.2 | 0.71 |
| Cardinal Health, Inc. | 54.53 | 3.5 | 15,949 | -3.9 | -13.6 | 0.93 |
| Caterpillar, Inc. | 140.06 | 2.6 | 77,405 | 13.2 | 34.0 | 1.36 |
| Chubb Ltd. | 149.38 | 2.0 | 67,699 | 18.8 | 37.2 | 0.63 |
| Chevron Corp. | 115.89 | 4.0 | 219,132 | 16.5 | 66.8 | 0.84 |
| Cincinnati Financial Corp. | 104.39 | 2.1 | 17,054 | 18.6 | 39.3 | 0.72 |
| Cintas Corp. | 255.38 | 1.0 | 26,431 | 29.3 | 29.3 | 1.01 |
| The Clorox Co. | 147.95 | 2.7 | 18,568 | 23.1 | 63.2 | 0.47 |
| The Coca-Cola Co. | 53.80 | 3.0 | 230,505 | 29.7 | 87.9 | 0.44 |
| Colgate-Palmolive Co. | 67.30 | 2.5 | 57,679 | 24.9 | 62.9 | 0.56 |
| Consolidated Edison, Inc. | 86.29 | 3.4 | 28,685 | 20.3 | 69.0 | 0.23 |
| Dover Corp. | 109.03 | 1.8 | 15,838 | 24.4 | 43.1 | 1.11 |
| Ecolab, Inc. | 185.34 | 1.0 | 53,423 | 35.0 | 34.8 | 0.81 |
| Emerson Electric Co. | 72.61 | 2.7 | 44,230 | 19.4 | 52.3 | 1.18 |
| Exxon Mobil Corp. | 67.88 | 5.0 | 287,207 | 19.8 | 98.5 | 0.91 |
| Federal Realty Investment Trust | 130.54 | 3.1 | 9,940 | 38.8 | 122.1 | 0.52 |
| Franklin Resources, Inc. | 26.38 | 3.9 | 13,139 | 11.2 | 44.1 | 1.13 |
| General Dynamics Corp. | 177.04 | 2.3 | 51,218 | 15.2 | 34.2 | 0.93 |
| Genuine Parts Co. | 102.71 | 2.9 | 14,923 | 18.8 | 55.0 | 0.78 |
| Hormel Foods Corp. | 45.54 | 1.8 | 24,316 | 24.9 | 45.9 | 0.50 |
| Illinois Tool Works, Inc. | 170.71 | 2.4 | 54,867 | 22.4 | 53.3 | 1.22 |
| Johnson & Johnson | 137.16 | 2.7 | 360,987 | 25.8 | 69.7 | 0.61 |
| Kimberly-Clark Corp. | 136.03 | 3.0 | 46,631 | 23.2 | 69.7 | 0.50 |
| Leggett & Platt, Inc. | 51.75 | 3.0 | 6,810 | 23.2 | 70.0 | 1.08 |
| Linde Plc | 202.04 | 1.7 | 108,531 | 20.7 | 35.3 | 0.77 |
| Lowe's Cos., Inc. | 114.55 | 1.8 | 87,974 | 30.3 | 54.4 | 1.05 |
| McCormick & Co., Inc. | 170.84 | 1.3 | 22,706 | 32.1 | 41.9 | 0.40 |
| McDonald's Corp. | 193.12 | 2.4 | 145,437 | 25.1 | 60.3 | 0.43 |
| Medtronic Plc | 110.99 | 1.9 | 148,768 | 31.9 | 59.7 | 0.66 |
| Nucor Corp. | 55.28 | 2.9 | 16,761 | 9.4 | 27.3 | 1.17 |
| People's United Financial, Inc. | 16.15 | 4.4 | 7,172 | 12.3 | 53.6 | 0.96 |
| Pentair Plc | 43.62 | 1.6 | 7,332 | 21.2 | 34.7 | 1.22 |
| PepsiCo, Inc. | 135.46 | 2.8 | 188,889 | 15.4 | 42.7 | 0.53 |
| PPG Industries, Inc. | 127.96 | 1.5 | 30,257 | 25.1 | 38.3 | 0.92 |
| Procter & Gamble Co. | 122.95 | 2.4 | 306,613 | 76.4 | 181.8 | 0.55 |
| Roper Technologies, Inc. | 351.76 | 0.5 | 36,603 | 31.6 | 16.6 | 1.05 |
| S&P Global, Inc. | 264.00 | 0.8 | 64,521 | 31.1 | 26.0 | 0.98 |
| The Sherwin-Williams Co. | 577.91 | 0.7 | 53,346 | 38.1 | 28.0 | 0.89 |
| Stanley Black & Decker, Inc. | 151.80 | 1.8 | 23,075 | 32.6 | 57.3 | 1.54 |
| Sysco Corp. | 81.30 | 1.9 | 41,481 | 24.6 | 47.2 | 0.51 |
| T. Rowe Price Group, Inc. | 120.79 | 2.5 | 28,225 | 15.1 | 37.3 | 1.23 |
| Target Corp. | 124.04 | 2.1 | 62,848 | 19.7 | 41.2 | 0.84 |
| United Technologies Corp. | 143.73 | 2.0 | 124,053 | 24.1 | 49.2 | 1.14 |
| VF Corp. | 85.99 | 2.3 | 34,342 | 26.5 | 60.3 | 1.15 |
| W.W. Grainger, Inc. | 312.58 | 1.8 | 16,837 | 18.2 | 32.5 | 1.06 |
| Walmart, Inc. | 118.67 | 1.8 | 337,530 | 23.6 | 41.9 | 0.60 |
| Walgreens Boots Alliance, Inc. | 58.99 | 3.0 | 52,650 | 13.7 | 41.2 | 1.03 |
| Name | Price | Dividend Yield | Market Cap ($M) | Forward P/E Ratio | Payout Ratio | Beta |
Oil and gas can be a “boom-and-bust” industry. Profits are highly dependent upon commodity prices, which can fluctuate wildly in any given year depending upon supply and demand forces.
But Exxon Mobil is different. It has been remarkably stable, even through various downturns in the oil and gas industry. The company traces its roots to Standard Oil, which was founded by John D. Rockefeller all the way back in 1870. With a 5.1% dividend yield, Exxon Mobil is on our list of high-yield stocks.
Despite the company’s REIT-like yield, Exxon Mobil’s dividend is quite safe. This article will provide an in-depth look at the founder of Big Oil, Exxon Mobil.
Business Overview
In its early days, Standard Oil dominated the U.S. oil and gas industry. It did this with a laser-like focus on drilling innovation, production growth, and limiting costs to beat its competitors. Standard Oil was almost too successful—it grew at such a rapid pace that in 1911, it was dissolved by the U.S. Supreme Court on antitrust grounds. Standard Oil was broken up into 33 smaller companies, many of which became giants on their own, such as Chevron (CVX).
Many of the same business practices used by Standard Oil are still used today by Exxon Mobil. Specifically, the company focuses on high-return projects that allow for profitable growth. The company generates a high return on invested capital, a key measure of a management team’s ability to effectively deploy capital. Exxon Mobil has consistently generated industry-leading returns on capital employed.
The company operates three large business segments. The Upstream segment includes oil and gas exploration and production. Downstream activities include refining and marketing. Manufactured chemicals include olefins, aromatics, polyethylene, and polypropylene plastics.

Source: Investor presentation, page 16
Above we can see the massive global scale on which Exxon operates, with its vast portfolio of diverse assets. The company has stated it expects increased divestment activity in the near future, raising cash to invest in more profitable projects.
Management believes it can raise $15 billion by the end of 2021, money which it will use to acquire or improve projects with better return profiles. Investing in higher-quality projects will allow Exxon Mobil to grow profits, even in an environment of stagnant oil and gas prices.
Growth Prospects
The climate for oil and gas majors remains challenged because oil prices are still down by nearly half from the peak levels of 2014. Fortunately, Exxon Mobil is an integrated company that was built – in part – to insulate itself against price declines. Its upstream and downstream businesses complement each other well and help shield it from swings in the prices of commodities. When oil and gas prices decline, upstream profits do fall. But downstream profits tend to benefit from sharp fluctuations in oil prices.
This helps Exxon Mobil’s profits hold up relatively well compared with other oil and gas majors. Earnings-per-share have declined significantly in the first three quarters of this year as the company has struggled with pricing in its upstream business in particular.
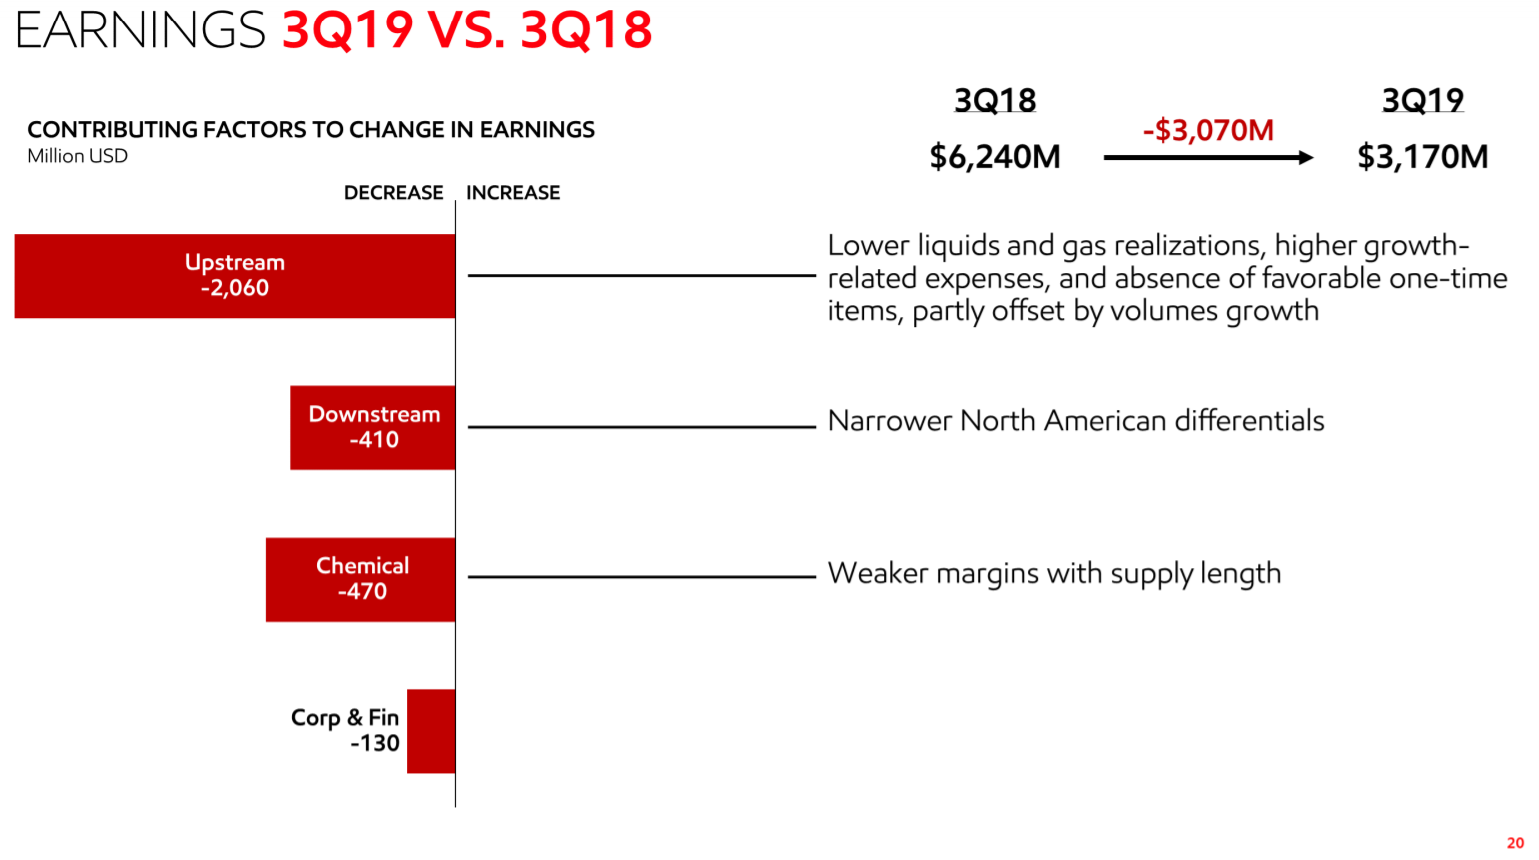
Source: Investor Presentation, page 20
Earnings were roughly in-line with this year’s Q2 as the upstream business struggled, but the downstream business provided a diversifying effect, along with a small increase in chemicals earnings, as well as a one-time tax benefit. However, against last year’s Q3, results were weak across the board, as seen above. On the whole, Exxon’s Q3 was predictably weak against last year’s very strong results, and we see $2.70 in earnings-per-share for this year. Indeed, through the first three quarters of the year, earnings-per-share have declined from $3.47 to $2.03.
ExxonMobil has also boosted cash flow, thanks to its focus on cost discipline. After years of cutting capital expenditures when oil prices were the lowest, ExxonMobil has begun the process of rebuilding its spending. Capital expenditures are up 25% in the first three quarters of the year on top of a similarly-sized increase in 2018, but are still somewhat low by historical standards. Capital spending during the peak oil days was significantly higher than today’s levels, so ExxonMobil hasn’t lost its sense of discipline by any means.
Despite relative weakness in earnings, Exxon has more than enough cash on hand, plus what it generates, to continue paying the dividend, which has cost about $11 billion over the first three quarters of the year.

Source: Investor presentation, page 9
Exxon Mobil has a massive project pipeline, consisting of more than 100 new projects. In addition to the Permian Basin, Exxon Mobil has significant international projects located in Guyana, Brazil, and Angola, among others.
Production increases have been somewhat spotty in recent quarters as Exxon Mobil is now feeling the impact of lower capital expenditures in past years. However, production is set to rise in the coming years as its legacy projects contribute more and as some of its larger growth projects come online.
Thanks to these factors, we expect a low-single-digit tailwind to production volumes in the coming years.
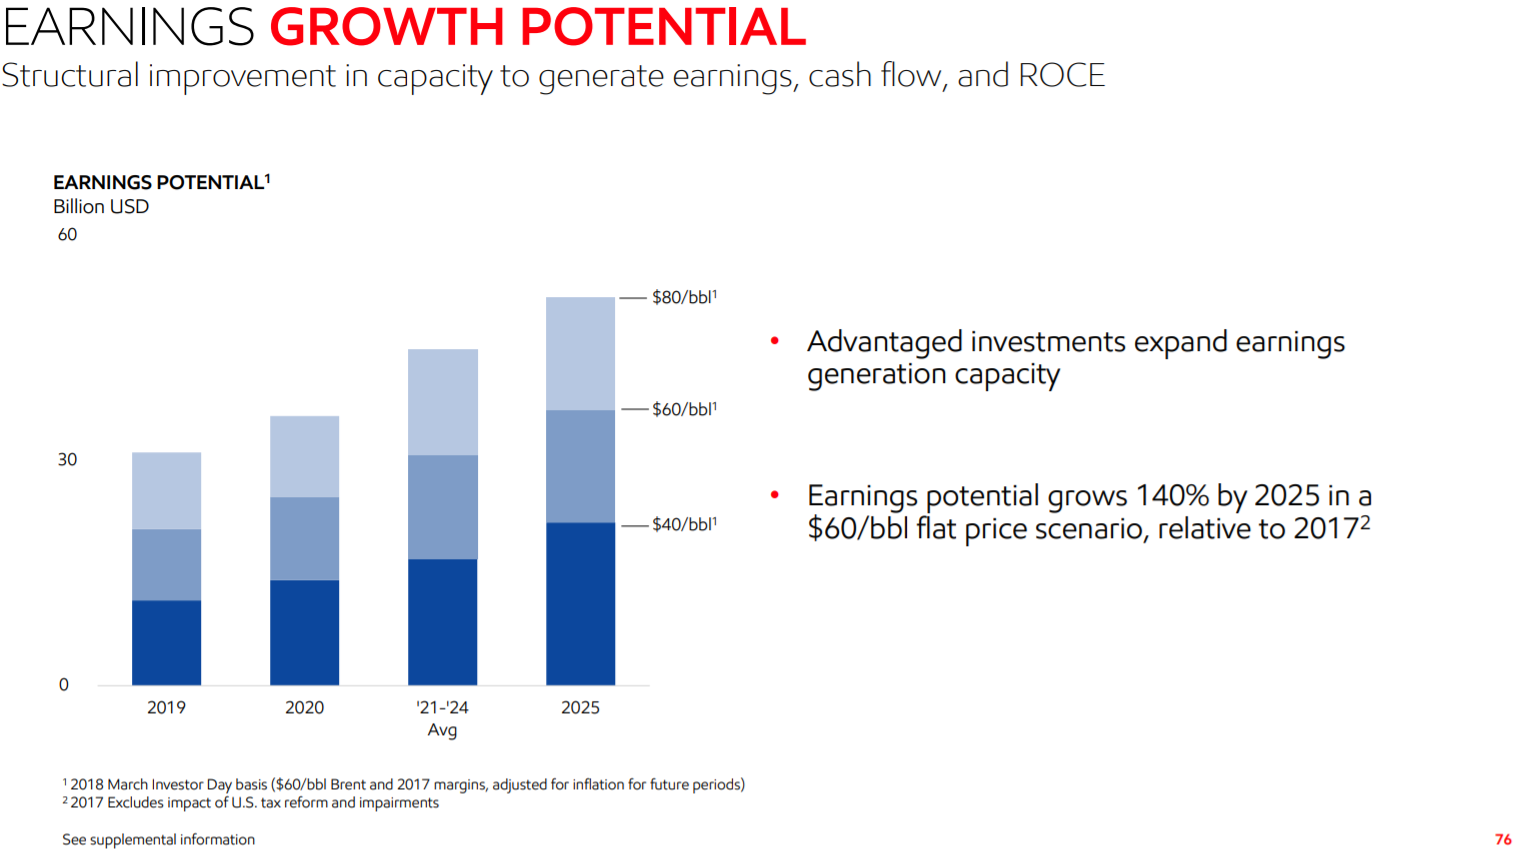
Source: Investor presentation, page 76
Exxon believes it has tremendous leverage to oil prices in the coming years thanks to the way it has built its portfolio in recent years. By 2025, Exxon thinks it would earn perhaps $20 billion at $40/bbl. At $80/bbl, earnings would more than double as operating leverage would take over. We saw this during the run up in oil prices before the Great Recession, as profits soared. We expect that will happen again the next time oil prices see a large uptrend.
In total, we expect Exxon to produce 17% annual earnings-per-share growth for the next five years off of what is a very low base for 2019.
Competitive Advantages & Recession Performance
Exxon Mobil enjoys several competitive advantages, primarily its tremendous scale, which provides the ability to cut costs when times are tough.
It also has the financial strength to invest heavily in new growth opportunities. The company has allocated tens of billions of dollars in the past few years to capital expenditures to support future growth:
- 2015 capital expenditures of $26.5 billion
- 2016 capital expenditures of $16.2 billion
- 2017 capital expenditures of $15.4 billion
- 2018 capital expenditures of $19.6 billion
Another competitive advantage is Exxon Mobil’s industry-leading balance sheet. It has a credit rating of AA+, which helps it keep a low cost of capital.
Exxon Mobil’s integrated business model allows the company to remain profitable, even during recessions and periods of low commodity prices. The company saw volatility during the Great Recession, but still remained profitable:
- 2007 earnings-per-share of $7.26
- 2008 earnings-per-share of $8.66 (19% increase)
- 2009 earnings-per-share of $3.98 (54% decline)
- 2010 earnings-per-share of $6.22 (56% increase)
Continuing to generate steady profits allowed Exxon Mobil to keep raising its dividend each year.
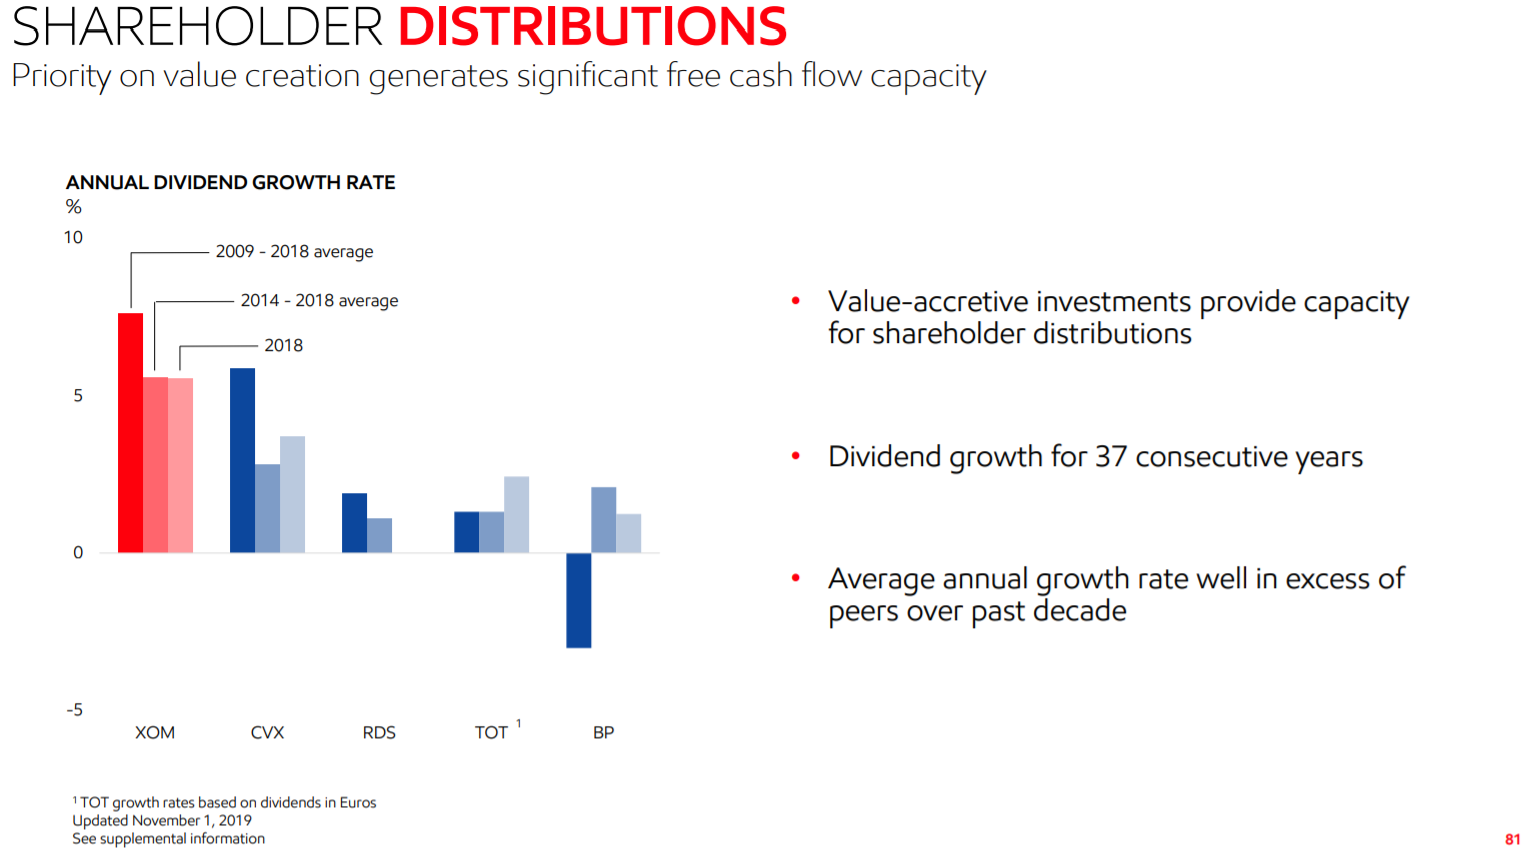
Source: Investor presentation, page 81
Exxon has greatly outperformed its peers in terms of dividend growth in the past ten years, and certainly in the past couple of years.
Exxon’s streak of 37 consecutive years of dividend increases puts it in rare company in the S&P 500, but elite company when its industry is considered. Exxon has been – and in all likelihood, will continue to be – a top-tier dividend payer for a long time to come.
Valuation & Expected Returns
Exxon Mobil appears to be somewhat overvalued today. We estimate earnings-per-share of $2.70 for 2019, implying a current price-to-earnings multiple of 25.5. That compares extremely unfavorably to our fair value estimate of 13 times earnings. However, keep in mind that this year’s earnings are seeing the impacts of lower pricing and investment spending that should be transitory. In other words, earnings are unusually weak this year, so the very high multiple isn’t particularly concerning, as it should be temporary.
As shown above, even modest increases in the prices of natural gas and oil could see Exxon Mobil produce sizable earnings growth. Indeed, we expect the company to produce more than $7 per share in earnings by 2023, so the opportunity for growth is sizable. Given this, the high valuation makes sense. Of course, much of this depends on the direction of oil and gas prices, which are difficult to predict.
Contraction of Exxon Mobil’s valuation multiple could reduce annual returns by 10.4% per year. However, expected earnings-per-share growth of 17.4% should more than offset this. Including the 5.1% dividend yield, we expect total annual returns of 12.1% per year.
Of course, earnings growth is not likely to be smooth, and is subject to change depending on oil and gas prices. Still, it appears that Exxon Mobil stock is poised to deliver meaningful returns to shareholders in the coming years.
Final Thoughts
Exxon Mobil has had a difficult past few years demonstrating that it is susceptible to falling oil and gas prices. However, it has performed better than many other energy stocks in this time frame by maintaining profitability and balance sheet quality.
And, Exxon Mobil has a bright future. The company has many promising new projects nearing completion, and it generates more than enough cash to continue raising the dividend. As a result, Exxon Mobil stock appears attractive based on earnings and dividend growth potential, and its high yield above 5%.