


Updated on December 4th, 2019 by Josh Arnold
When it comes to dividend growth stocks, the Dividend Aristocrats are the “cream of the crop”. These are stocks in the S&P 500 Index, with 25+ consecutive years of dividend increases.
In addition to the downloadable spreadsheet, you can see a preview of the Dividend Aristocrats list in the table below:
| 3M Co. | 165.17 | 3.4 | 94,981 | 19.3 | 66.4 | 1.09 |
| A. O. Smith Corp. | 46.70 | 1.9 | 6,400 | 19.3 | 36.3 | 0.91 |
| Abbott Laboratories | 84.36 | 1.5 | 149,097 | 45.4 | 68.9 | 1.05 |
| AbbVie, Inc. | 85.95 | 5.0 | 127,104 | 39.4 | 196.3 | 0.89 |
| Aflac, Inc. | 51.73 | 2.1 | 37,970 | 12.7 | 26.3 | 0.74 |
| Air Products & Chemicals, Inc. | 229.69 | 2.0 | 50,613 | 28.8 | 57.4 | 0.81 |
| Archer-Daniels-Midland Co. | 42.92 | 3.2 | 23,892 | 20.3 | 65.5 | 0.82 |
| AT&T, Inc. | 37.55 | 5.4 | 274,302 | 16.8 | 91.0 | 0.59 |
| Automatic Data Processing, Inc. | 167.13 | 1.9 | 72,316 | 30.6 | 57.8 | 1.02 |
| Becton, Dickinson & Co. | 255.73 | 1.2 | 69,035 | 64.6 | 77.8 | 1.01 |
| Brown-Forman Corp. | 66.70 | 1.0 | 31,851 | 38.9 | 38.2 | 0.71 |
| Cardinal Health, Inc. | 54.53 | 3.5 | 15,949 | -3.9 | -13.6 | 0.93 |
| Caterpillar, Inc. | 140.06 | 2.6 | 77,405 | 13.2 | 34.0 | 1.36 |
| Chubb Ltd. | 149.38 | 2.0 | 67,699 | 18.8 | 37.2 | 0.63 |
| Chevron Corp. | 115.89 | 4.0 | 219,132 | 16.5 | 66.8 | 0.84 |
| Cincinnati Financial Corp. | 104.39 | 2.1 | 17,054 | 18.6 | 39.3 | 0.72 |
| Cintas Corp. | 255.38 | 1.0 | 26,431 | 29.3 | 29.3 | 1.01 |
| The Clorox Co. | 147.95 | 2.7 | 18,568 | 23.1 | 63.2 | 0.47 |
| The Coca-Cola Co. | 53.80 | 3.0 | 230,505 | 29.7 | 87.9 | 0.44 |
| Colgate-Palmolive Co. | 67.30 | 2.5 | 57,679 | 24.9 | 62.9 | 0.56 |
| Consolidated Edison, Inc. | 86.29 | 3.4 | 28,685 | 20.3 | 69.0 | 0.23 |
| Dover Corp. | 109.03 | 1.8 | 15,838 | 24.4 | 43.1 | 1.11 |
| Ecolab, Inc. | 185.34 | 1.0 | 53,423 | 35.0 | 34.8 | 0.81 |
| Emerson Electric Co. | 72.61 | 2.7 | 44,230 | 19.4 | 52.3 | 1.18 |
| Exxon Mobil Corp. | 67.88 | 5.0 | 287,207 | 19.8 | 98.5 | 0.91 |
| Federal Realty Investment Trust | 130.54 | 3.1 | 9,940 | 38.8 | 122.1 | 0.52 |
| Franklin Resources, Inc. | 26.38 | 3.9 | 13,139 | 11.2 | 44.1 | 1.13 |
| General Dynamics Corp. | 177.04 | 2.3 | 51,218 | 15.2 | 34.2 | 0.93 |
| Genuine Parts Co. | 102.71 | 2.9 | 14,923 | 18.8 | 55.0 | 0.78 |
| Hormel Foods Corp. | 45.54 | 1.8 | 24,316 | 24.9 | 45.9 | 0.50 |
| Illinois Tool Works, Inc. | 170.71 | 2.4 | 54,867 | 22.4 | 53.3 | 1.22 |
| Johnson & Johnson | 137.16 | 2.7 | 360,987 | 25.8 | 69.7 | 0.61 |
| Kimberly-Clark Corp. | 136.03 | 3.0 | 46,631 | 23.2 | 69.7 | 0.50 |
| Leggett & Platt, Inc. | 51.75 | 3.0 | 6,810 | 23.2 | 70.0 | 1.08 |
| Linde Plc | 202.04 | 1.7 | 108,531 | 20.7 | 35.3 | 0.77 |
| Lowe's Cos., Inc. | 114.55 | 1.8 | 87,974 | 30.3 | 54.4 | 1.05 |
| McCormick & Co., Inc. | 170.84 | 1.3 | 22,706 | 32.1 | 41.9 | 0.40 |
| McDonald's Corp. | 193.12 | 2.4 | 145,437 | 25.1 | 60.3 | 0.43 |
| Medtronic Plc | 110.99 | 1.9 | 148,768 | 31.9 | 59.7 | 0.66 |
| Nucor Corp. | 55.28 | 2.9 | 16,761 | 9.4 | 27.3 | 1.17 |
| People's United Financial, Inc. | 16.15 | 4.4 | 7,172 | 12.3 | 53.6 | 0.96 |
| Pentair Plc | 43.62 | 1.6 | 7,332 | 21.2 | 34.7 | 1.22 |
| PepsiCo, Inc. | 135.46 | 2.8 | 188,889 | 15.4 | 42.7 | 0.53 |
| PPG Industries, Inc. | 127.96 | 1.5 | 30,257 | 25.1 | 38.3 | 0.92 |
| Procter & Gamble Co. | 122.95 | 2.4 | 306,613 | 76.4 | 181.8 | 0.55 |
| Roper Technologies, Inc. | 351.76 | 0.5 | 36,603 | 31.6 | 16.6 | 1.05 |
| S&P Global, Inc. | 264.00 | 0.8 | 64,521 | 31.1 | 26.0 | 0.98 |
| The Sherwin-Williams Co. | 577.91 | 0.7 | 53,346 | 38.1 | 28.0 | 0.89 |
| Stanley Black & Decker, Inc. | 151.80 | 1.8 | 23,075 | 32.6 | 57.3 | 1.54 |
| Sysco Corp. | 81.30 | 1.9 | 41,481 | 24.6 | 47.2 | 0.51 |
| T. Rowe Price Group, Inc. | 120.79 | 2.5 | 28,225 | 15.1 | 37.3 | 1.23 |
| Target Corp. | 124.04 | 2.1 | 62,848 | 19.7 | 41.2 | 0.84 |
| United Technologies Corp. | 143.73 | 2.0 | 124,053 | 24.1 | 49.2 | 1.14 |
| VF Corp. | 85.99 | 2.3 | 34,342 | 26.5 | 60.3 | 1.15 |
| W.W. Grainger, Inc. | 312.58 | 1.8 | 16,837 | 18.2 | 32.5 | 1.06 |
| Walmart, Inc. | 118.67 | 1.8 | 337,530 | 23.6 | 41.9 | 0.60 |
| Walgreens Boots Alliance, Inc. | 58.99 | 3.0 | 52,650 | 13.7 | 41.2 | 1.03 |
| Name | Price | Dividend Yield | Market Cap ($M) | Forward P/E Ratio | Payout Ratio | Beta |
At the same time, Real Estate Investment Trusts (REITs) seem like natural fits for the Dividend Aristocrats. REITs are required to distribute at least 90% of their earnings to shareholders, which leads to steady dividend growth for the asset class, provided earnings grow over time.
And yet, there is only one REIT on the list of Dividend Aristocrats: Federal Realty Investment Trust (FRT). The reason for the relative lack of REITs in the Dividend Aristocrats Index is primarily due to the high payout requirement of REITs. It’s difficult to grow dividends year-in-and-year-out when the bulk of income is being distributed, as this leaves little margin for error.
Federal Realty has a very impressive dividend history, particularly for a REIT. Federal Realty has increased its dividend for over 50 years in a row, which makes it a Dividend King as well. This article will discuss the only REIT on the list of Dividend Aristocrats and Dividend Kings.
Business Overview
Federal Realty was founded in 1962. As a REIT, Federal Realty’s business model is to own and rent out real estate properties. It uses a significant portion of its rental income, as well as external financing, to acquire new properties. This helps create a “snow-ball” effect of rising income over time.
Federal Realty primarily owns shopping centers. However, it also operates in redevelopment of multi-purpose properties including retail, apartments, and condominiums. The portfolio is highly diversified in terms of tenant base. No individual industry represents more than 9% of the portfolio, and no single tenant accounts for more than 3%. Federal Realty has a high-quality tenant portfolio.
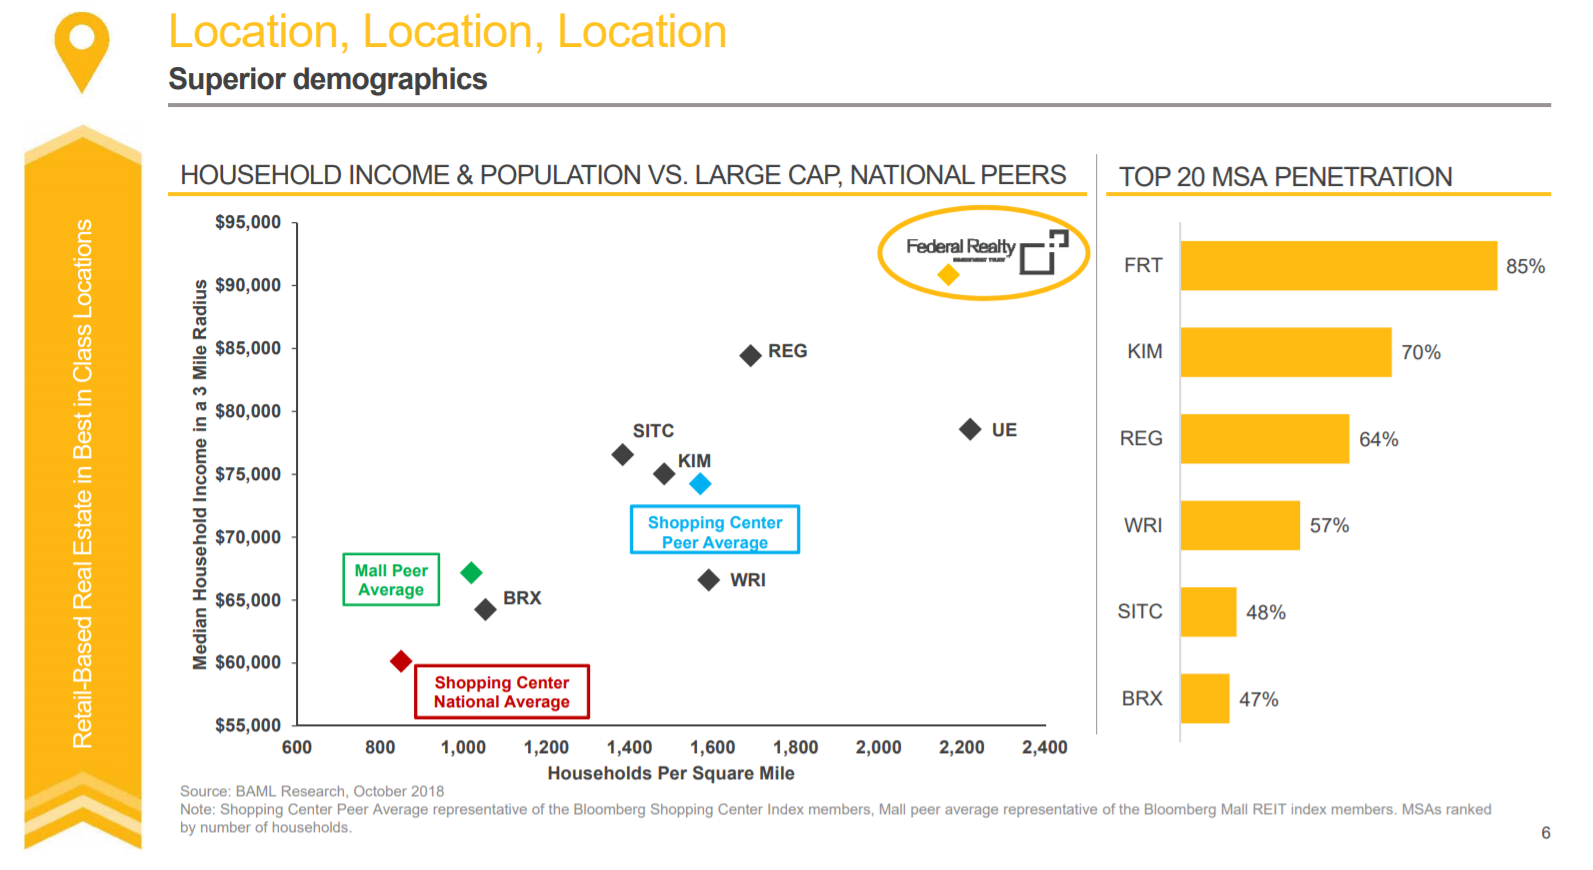
Source: Investor Presentation, page 6
Federal Realty’s retail portfolio is second to none in the industry in terms of average base rent, and consists of 104 properties. Approximately 94% of Federal Realty’s properties were leased, as of the most recent quarter, which is consistent with recent results.

Source: Investor Presentation, page 5
Its properties are geographically focused on the East and West coasts, and the trust now has properties in Miami and Chicago. Its major markets are Washington, D.C., New York, Philadelphia, Boston, San Francisco, and Los Angeles.
The trust’s investment strategy is to pursue densely-populated, affluent communities, with high demand for commercial and residential real estate. This strategy has fueled strong growth over the past several years.
Growth Prospects
Federal Realty’s growth comes from new properties, and rental increases. In 2018, Federal Realty produced robust 8.5% funds-from-operations, or FFO, growth per share, improving on growth in 2017. This year, we expect much more muted growth in the low-single-digits.
Since 2009, Federal Realty increased FFO by just over 5% per year, on average, which is more in line with our expected growth rate for the trust.
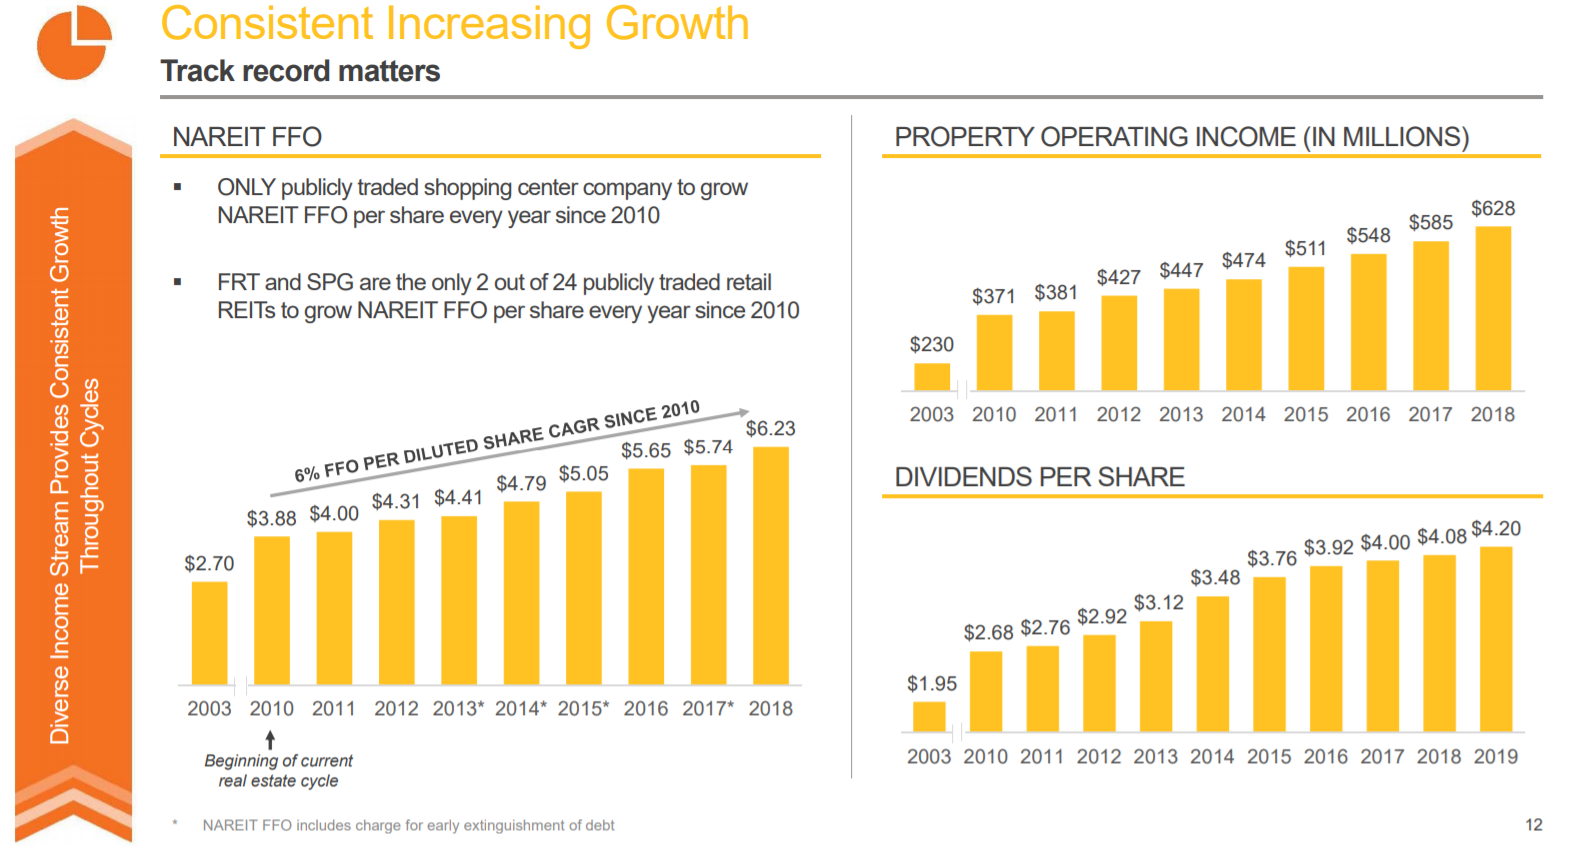
Source: Investor Presentation, page 5
The strong rebound in growth for 2018 should slow materially this year, with FFO expected to come in at $6.38 per share in 2019, or ~2% higher than 2018. Federal Realty’s occupancy rate has dipped slightly but it has managed to offset that with development and pricing increases, as it has for many years.
Recent leasing activity is being completed at higher average rents than properties in the existing portfolio, which is a good sign that future rental income will grow. Indeed, Federal Realty has been doing this for decades, so we have no reason to expect it will change.
2019’s growth is being fueled by the familiar tailwinds of high occupancy – although occupancy is down slightly year-over-year to 94% – and the trust rolling over leases at higher rates than before. This is leading to significant comparable property income growth, which is fueling higher FFO-per-share.
In the most recent quarter, Federal Realty had an overall lease rate of 94.2% against a comparable lease rate of 94.9% in the year-ago period. However, comparable property operating income rose 2.1%, signifying the tailwind of higher rent rates achieved through escalations.
The trust signed 103 leases for 491,414 square feet of rental space in Q3 with average cash basis rollover growth of 7%. In essence, this means that Federal Realty is continuing its long tradition of improving rental income and operating income through constantly recycling its portfolio at higher lease rates. New properties, therefore, should keep the “snowball effect” intact for the foreseeable future.
The trust expects FFO-per-share in a range of $6.30 to $6.46 for 2019. Our estimate is for $6.38 and would represent modest growth over 2018.
Competitive Advantages & Recession Performance
One way in which REITs establish a competitive advantage is through investing in the highest-quality portfolios. Federal Realty has done this by focusing on affluent areas of the country, where demand exceeds supply. This is also how it can continue to boost its cash basis rollover growth over time; it owns properties in the most desirable areas and tenants are willing to pay more to gain access to the best consumers.
Federal Realty benefits from a favorable economic backdrop, with high occupancy rates, and the ability to raise rents over time.
Another competitive advantage for Federal Realty is a strong balance sheet. The trust’s senior unsecured debt holds a credit rating of A- from Standard & Poor’s, which is solidly investment-grade, and is a high rating for a REIT. Indeed, there are only five REITs with a “A” rating, with Federal Realty being one of them.
A strong balance sheet helps keep borrowing costs low, which is critical for the REIT business model.
These competitive strengths allowed Federal Realty to perform well during the last recession. Federal Realty’s FFO during the Great Recession is shown below:
- 2007 FFO-per-share of $3.63
- 2008 FFO-per-share of $3.87 (6.6% increase)
- 2009 FFO-per-share of $3.87 (flat)
- 2010 FFO-per-share of $3.88 (0.3% increase)
- 2011 FFO-per-share of $4.00 (3% increase)
FFO either held steady, or increased, during each year of the recession. This was a remarkable achievement, and speaks to the strength of the business. We expect Federal Realty to hold up well during the next downturn, but we note that growth will certainly slow during such a period. Federal Realty, thanks to its strong balance sheet, would likely be a net acquirer during the next downturn to build for future growth.
Valuation & Expected Returns
Based on 2019 FFO-per-share of $6.38, Federal Realty stock trades for a price-to-FFO ratio of 20.6. Investors can think of this as similar to a price-to-earnings ratio.
On a valuation basis, Federal Realty appears slightly undervalued. The trust has generally traded with a price-to-FFO ratio in the low 20s, and we expect it will again. Should the stock return to our forecast fair value of 22 times FFO, it would provide a ~1% tailwind to total annual returns. Federal Realty has spent much of 2019 trading around $130 per share, which is just under our fair value estimate of $140.
Therefore, future returns will be comprised of a roughly congruent mix of FFO growth, valuation expansion, and dividends. In this scenario, total returns would reach between 9% and 10% annually, as the trust would see growth in its business while also enjoying a small tailwind from a higher valuation.
The current dividend yield of 3.1% is a low yield for a REIT. However, Federal Realty helps make up for this with strong dividend growth and its impeccable track record.
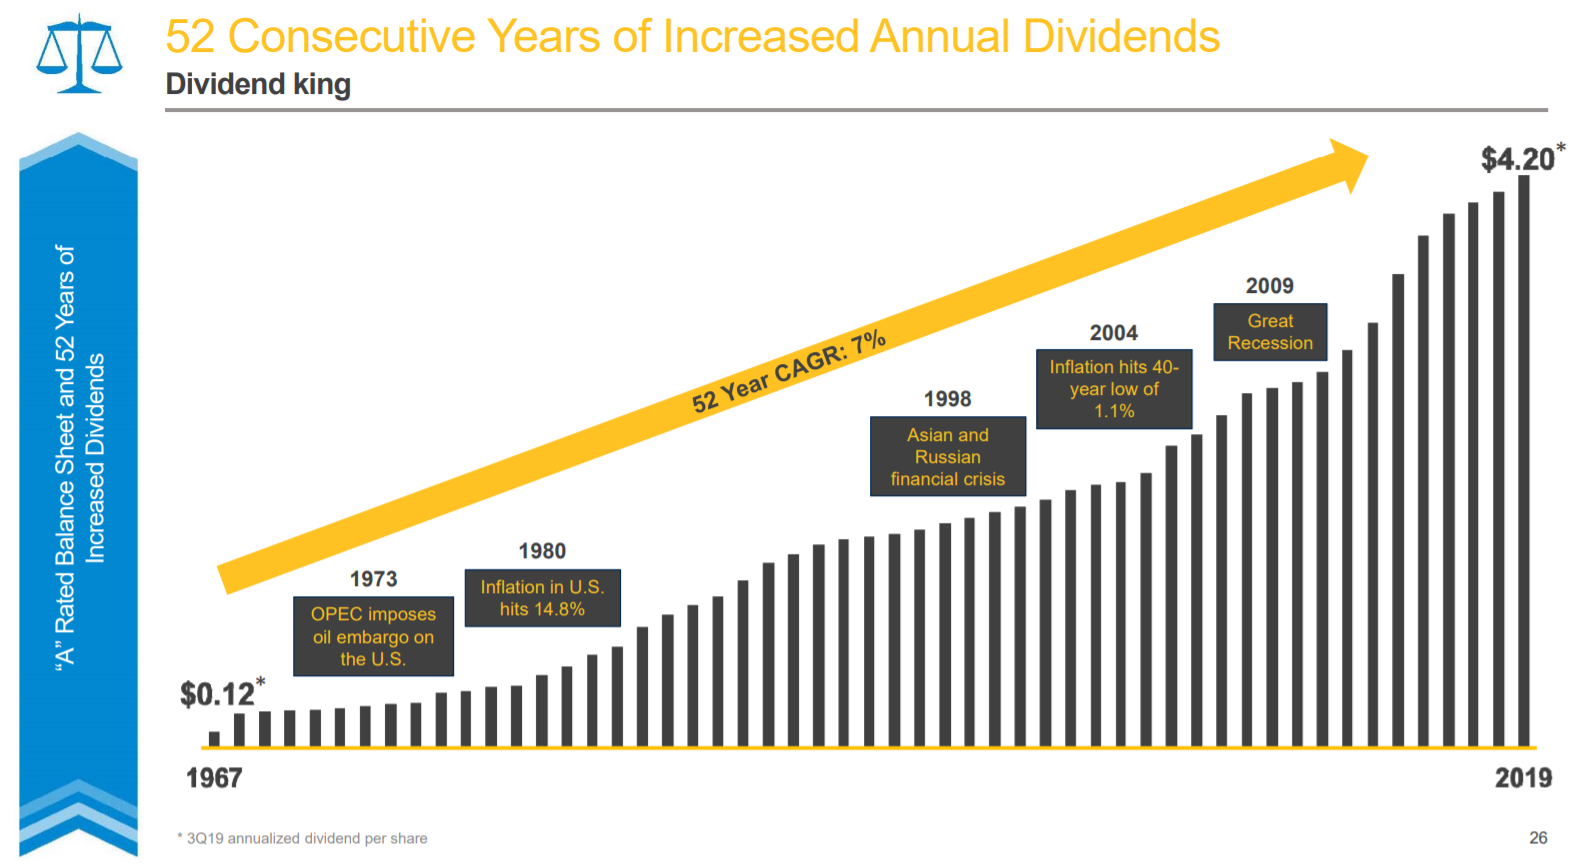
Source: Investor Presentation, page 26
It has increased its dividend for 52 years in a row, including another 3% raise for 2019, which is consistent with recent years.
And, the trust has increased its dividend at a consistently high rate. According to Federal Realty, it has maintained a 7% compound annual dividend growth rate, over the course of its 52-year streak. Growth has slowed in recent years as a result of Federal Realty paying less of its FFO-per-share in distributions. We expect growth to return in the future to past levels as the trust has seen ups and downs in its payout growth rate, but it always moves higher.
The dividend appears quite secure. Federal Realty has a payout ratio of about 64% of FFO for this year, and a debt-to-EBITDA ratio of 5.3, which is a slight improvement upon 2018, although this metric has been largely flat for a couple of years.
The combination of 5.5% expected FFO growth, the 3.1% dividend yield, and a small positive boost from valuation changes leads to total expected returns of 9%-10% per year through 2024.
Final Thoughts
Investors flock to REITs for dividends, and with high yields across the asset class, it is easy to see why they are so popular for income investors.
We have compiled a list of 150+ REITs, that are worthy of further consideration, based on their dividend yields and dividend growth potential. You can see all 150+ REITs here.
Federal Realty does not have a high dividend yield, particularly for a REIT. This is because the stock consistently trades for a relatively high valuation. However, high-quality businesses tend to sport above-average valuations. Investors interested solely in receiving high income right now may not be impressed by Federal Realty.
That said, it is a strong choice for dividend growth investors, and we rate the stock a buy due to its valuation, growth, and yield.