


Updated on December 3rd, 2019 by Josh Arnold
Investors looking for the best dividend growth stocks should consider the Dividend Aristocrats. We believe these are the “cream of the crop” when it comes to dividend growth stocks. Out of the 500 stocks in the S&P 500 Index, there are just 57 Dividend Aristocrats, which have raised their dividends for 25+ consecutive years.
In addition to the downloadable spreadsheet, you can see a preview of the Dividend Aristocrats list in the table below:
| 3M Co. | 168.27 | 3.4 | 96,763 | 19.7 | 66.4 | 1.08 |
| A. O. Smith Corp. | 47.33 | 1.9 | 6,487 | 19.5 | 36.3 | 0.91 |
| Abbott Laboratories | 84.51 | 1.5 | 149,362 | 45.5 | 68.9 | 1.04 |
| AbbVie, Inc. | 87.03 | 4.9 | 128,701 | 39.9 | 196.3 | 0.88 |
| Aflac, Inc. | 52.68 | 2.0 | 38,668 | 12.9 | 26.3 | 0.73 |
| Air Products & Chemicals, Inc. | 230.97 | 2.0 | 50,895 | 28.9 | 57.4 | 0.82 |
| Archer-Daniels-Midland Co. | 43.29 | 3.2 | 24,098 | 20.5 | 65.5 | 0.83 |
| AT&T, Inc. | 37.32 | 5.5 | 272,622 | 16.7 | 91.0 | 0.60 |
| Automatic Data Processing, Inc. | 168.59 | 1.9 | 72,948 | 30.8 | 57.8 | 1.01 |
| Becton, Dickinson & Co. | 259.03 | 1.2 | 69,926 | 65.4 | 77.8 | 1.00 |
| Brown-Forman Corp. | 67.42 | 1.0 | 32,195 | 39.3 | 38.2 | 0.72 |
| Cardinal Health, Inc. | 54.64 | 3.5 | 15,981 | -3.9 | -13.6 | 0.94 |
| Caterpillar, Inc. | 142.96 | 2.5 | 79,007 | 13.5 | 34.0 | 1.36 |
| Chubb Ltd. | 149.78 | 2.0 | 67,880 | 18.8 | 37.2 | 0.62 |
| Chevron Corp. | 116.80 | 4.0 | 220,853 | 16.6 | 66.8 | 0.84 |
| Cincinnati Financial Corp. | 105.63 | 2.1 | 17,257 | 18.8 | 39.3 | 0.72 |
| Cintas Corp. | 255.89 | 1.0 | 26,484 | 29.4 | 29.3 | 1.01 |
| The Clorox Co. | 148.93 | 2.7 | 18,691 | 23.3 | 63.2 | 0.46 |
| The Coca-Cola Co. | 53.75 | 3.0 | 230,291 | 29.7 | 87.9 | 0.43 |
| Colgate-Palmolive Co. | 67.57 | 2.5 | 57,910 | 25.0 | 62.9 | 0.55 |
| Consolidated Edison, Inc. | 85.55 | 3.4 | 28,439 | 20.1 | 69.0 | 0.24 |
| Dover Corp. | 110.31 | 1.7 | 16,024 | 24.6 | 43.1 | 1.11 |
| Ecolab, Inc. | 185.16 | 1.0 | 53,371 | 35.0 | 34.8 | 0.81 |
| Emerson Electric Co. | 73.36 | 2.7 | 44,687 | 19.6 | 52.3 | 1.18 |
| Exxon Mobil Corp. | 68.42 | 4.9 | 289,492 | 19.9 | 98.5 | 0.91 |
| Federal Realty Investment Trust | 129.76 | 3.2 | 9,881 | 38.5 | 122.1 | 0.53 |
| Franklin Resources, Inc. | 26.98 | 3.9 | 13,437 | 11.5 | 44.1 | 1.13 |
| General Dynamics Corp. | 177.99 | 2.2 | 51,493 | 15.3 | 34.2 | 0.91 |
| Genuine Parts Co. | 104.72 | 2.9 | 15,215 | 19.1 | 55.0 | 0.77 |
| Hormel Foods Corp. | 45.43 | 1.8 | 24,258 | 24.8 | 45.9 | 0.50 |
| Illinois Tool Works, Inc. | 172.08 | 2.4 | 55,307 | 22.6 | 53.3 | 1.21 |
| Johnson & Johnson | 137.36 | 2.7 | 361,513 | 25.9 | 69.7 | 0.60 |
| Kimberly-Clark Corp. | 136.30 | 3.0 | 46,724 | 23.2 | 69.7 | 0.48 |
| Leggett & Platt, Inc. | 52.21 | 3.0 | 6,870 | 23.4 | 70.0 | 1.09 |
| Linde Plc | 200.63 | 1.7 | 107,773 | 20.5 | 35.3 | 0.79 |
| Lowe's Cos., Inc. | 116.00 | 1.8 | 89,088 | 30.7 | 54.4 | 1.04 |
| McCormick & Co., Inc. | 169.21 | 1.3 | 22,490 | 31.8 | 41.9 | 0.40 |
| McDonald's Corp. | 195.18 | 2.4 | 146,988 | 25.4 | 60.3 | 0.42 |
| Medtronic Plc | 110.91 | 1.9 | 148,661 | 31.9 | 59.7 | 0.67 |
| Nucor Corp. | 56.64 | 2.8 | 17,174 | 9.7 | 27.3 | 1.16 |
| People's United Financial, Inc. | 16.31 | 4.3 | 7,243 | 12.4 | 53.6 | 0.95 |
| Pentair Plc | 43.79 | 1.6 | 7,360 | 21.3 | 34.7 | 1.21 |
| PepsiCo, Inc. | 135.88 | 2.8 | 189,475 | 15.4 | 42.7 | 0.52 |
| PPG Industries, Inc. | 128.50 | 1.5 | 30,385 | 25.2 | 38.3 | 0.92 |
| Procter & Gamble Co. | 122.72 | 2.4 | 306,040 | 76.2 | 181.8 | 0.54 |
| Roper Technologies, Inc. | 353.87 | 0.5 | 36,823 | 31.8 | 16.6 | 1.05 |
| S&P Global, Inc. | 262.19 | 0.8 | 64,079 | 30.9 | 26.0 | 0.98 |
| The Sherwin-Williams Co. | 574.83 | 0.7 | 53,061 | 37.9 | 28.0 | 0.88 |
| Stanley Black & Decker, Inc. | 153.28 | 1.7 | 23,300 | 32.9 | 57.3 | 1.55 |
| Sysco Corp. | 80.82 | 1.9 | 41,236 | 24.5 | 47.2 | 0.51 |
| T. Rowe Price Group, Inc. | 122.26 | 2.4 | 28,569 | 15.3 | 37.3 | 1.22 |
| Target Corp. | 123.98 | 2.1 | 62,817 | 19.7 | 41.2 | 0.85 |
| United Technologies Corp. | 144.99 | 2.0 | 125,140 | 24.3 | 49.2 | 1.14 |
| VF Corp. | 87.99 | 2.2 | 35,140 | 27.1 | 60.3 | 1.15 |
| W.W. Grainger, Inc. | 315.03 | 1.8 | 16,969 | 18.3 | 32.5 | 1.06 |
| Walmart, Inc. | 119.28 | 1.8 | 339,265 | 23.7 | 41.9 | 0.60 |
| Walgreens Boots Alliance, Inc. | 59.27 | 3.0 | 52,900 | 13.7 | 41.2 | 1.04 |
| Name | Price | Dividend Yield | Market Cap ($M) | Forward P/E Ratio | Payout Ratio | Beta |
Each year, we individually review all of the Dividend Aristocrats. The next installment in the series is industrial giant Emerson Electric (EMR).
Emerson is not just a Dividend Aristocrat; it is also a Dividend King, which is an even smaller group of just 27 companies with 50+ consecutive years of dividend increases. You can see all the Dividend Kings here.
Emerson has increased its dividend for a staggering 63 years in a row. This means Emerson has one of the longest dividend growth streaks in the entire stock market. This article will discuss Emerson’s business model, growth prospects, and whether the stock is a buy right now based on these factors.
Business Overview
Emerson Electric was founded in Missouri in 1890 by two Scottish brothers, Charles and Alexander Meston, who saw a potential business opportunity in manufacturing reliable electric motors. The two brothers received a start-up investment from John Wesley Emerson, a former Union army officer, judge, and lawyer. Together, the three formed The Emerson Manufacturing Company.
Since its founding, Emerson has evolved through organic growth, as well as strategic acquisitions and divestitures, from a regional manufacturer of electric motors and fans into a diversified global leader in technology and engineering. Its global customer base affords it $18+ billion in annual revenue and a current market capitalization of $45 billion.
Emerson is organized into two major reporting segments called Automation Solutions and Commercial & Residential Solutions. Automation Solutions helps manufacturers minimize energy usage, waste, and other costs in their processes.
The Commercial & Residential Solutions segment makes products that protect food quality and safety, as well as boost efficiency in the production process. The company prides itself on solving complex engineering tasks for its customers, which leads to high customer retention rates as Emerson provides unique solutions to its customers’ problems. Today, Emerson does business around the world, and has about 75,000 employees.
Growth Prospects
Emerson is emerging from of a period of intense transition. The company has endured a difficult few years due to a number of headwinds including a strong U.S. dollar, slowing economic growth rates in China, and the steep decline in oil and gas prices. All of these factors weighed on Emerson by varying degrees, and more recently, oil and gas prices have been a larger issue. Many of Emerson’s customers are in the energy sector, which is why low oil and gas prices affect the company negatively. With oil prices remaining fairly low, Emerson remains exposed to these risks.
As a result, Emerson’s revenue results have been very weak in recent years, as fiscal 2019’s total revenue was only ~4% higher than in fiscal 2014, implying essentially no annual top line growth for five years. Part of this is due to nearly constant divestitures as Emerson remade itself, but it has added companies to its portfolio as well during that time. Its performance has still been weak in recent years. In response, Emerson has undertaken a significant restructuring of its business model.
First, it slashed costs to boost profits. The restructuring has resulted in hundreds of millions in additional operating profits hitting Emerson’s bottom line. This has helped boost Emerson’s earnings-per-share significantly in the past couple of years, with 2018 earnings-per-share growing 36% over the prior year, and fiscal 2019 improving a further 7% over 2018’s strong results. Cost reductions, combined with organic sales growth, acquisitions, and share repurchases, are expected to fuel at least 10% annual earnings growth through 2021.
Emerson produced a 5.5% gain on the top line in fiscal 2019 on top of a similar gain in the prior year, as Emerson finally saw some revenue growth on a meaningful scale. However, fiscal 2020 promises to be another weak year on the top line as the company expects essentially flat sales against fiscal 2019.
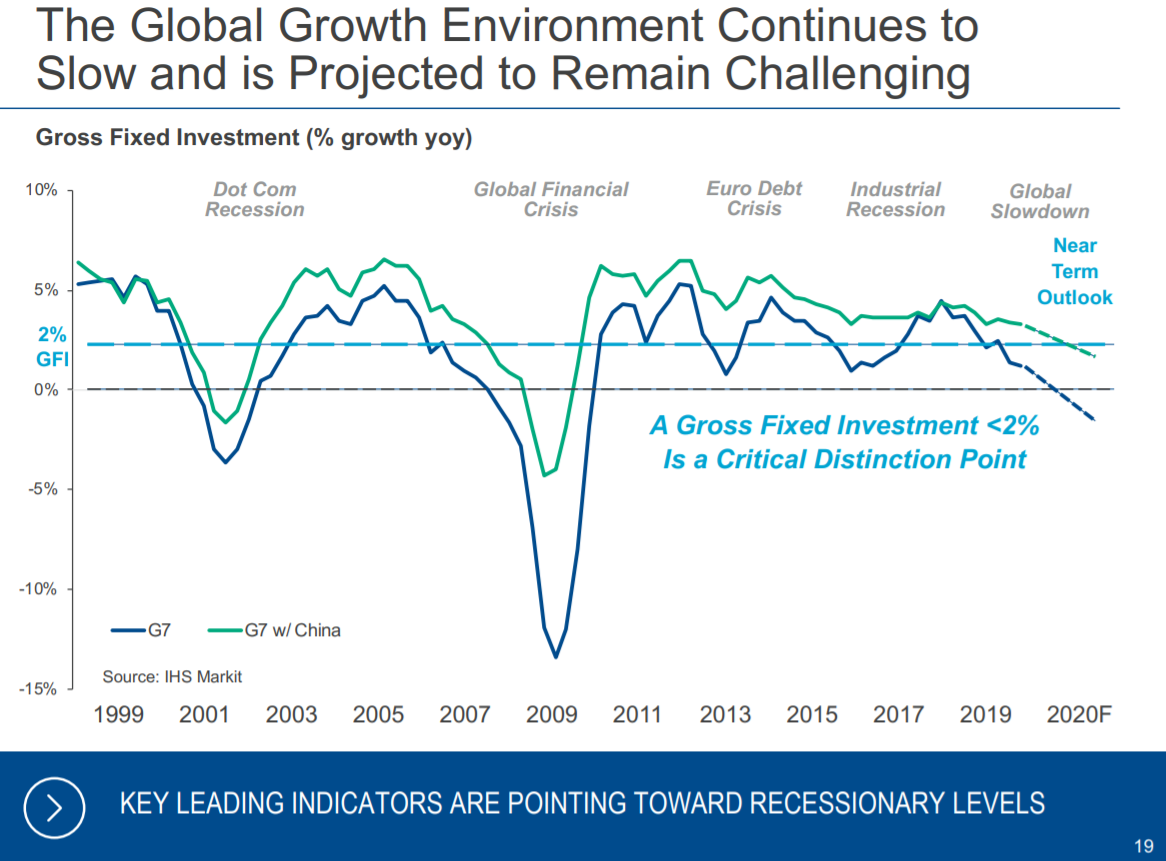
Source: Investor presentation, page 19
Global fixed investment growth continues to slow, and Emerson is quite cautious on the near-term outlook. We can see that gross fixed investment, which is what Emerson needs from its customers to buy its services, has been slowing gradually since 2011. When China is removed from the equation, gross fixed investment is expected to contract very soon, possibly next year. Even with China, it is below 2% for 2020, so Emerson will almost certainly struggle with the top line as its customers pull back on investment spending. To this end, we expect Emerson to produce flat revenue in fiscal 2020.
For all of fiscal 2020, Emerson expects earnings-per-share to come in at $3.48 to $3.72, which compares somewhat favorably to 2019’s earnings-per-share number of $3.71. At the midpoint, that suggests a slightly negative earnings-per-share growth this year.
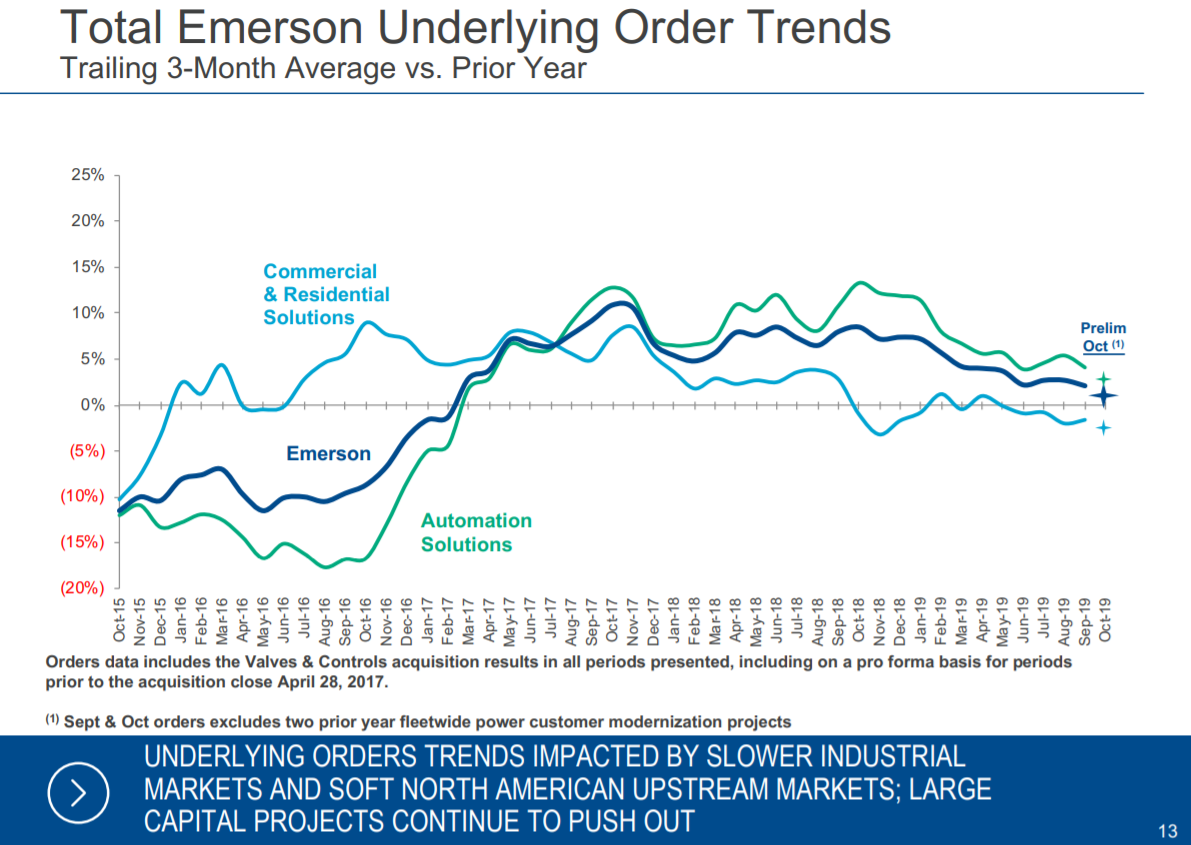
Source: Investor presentation, page 13
Part of the problem is the company’s underlying order growth rate, which has slowed materially since 2017, and is approaching zero. Commercial & Residential Solutions business is already negative and Automation Solutions has slowed towards 5%. We see this as a key risk to Emerson’s top line and margins in the near term. We expect 3% annual earnings-per-share over the next five years.
Its exposure to cyclical industries such as oil and gas is a risk over time, and its spotty performance in recent years – while improving – is a key factor as well. Emerson has made progress on many fronts including revenue growth and margin expansion.
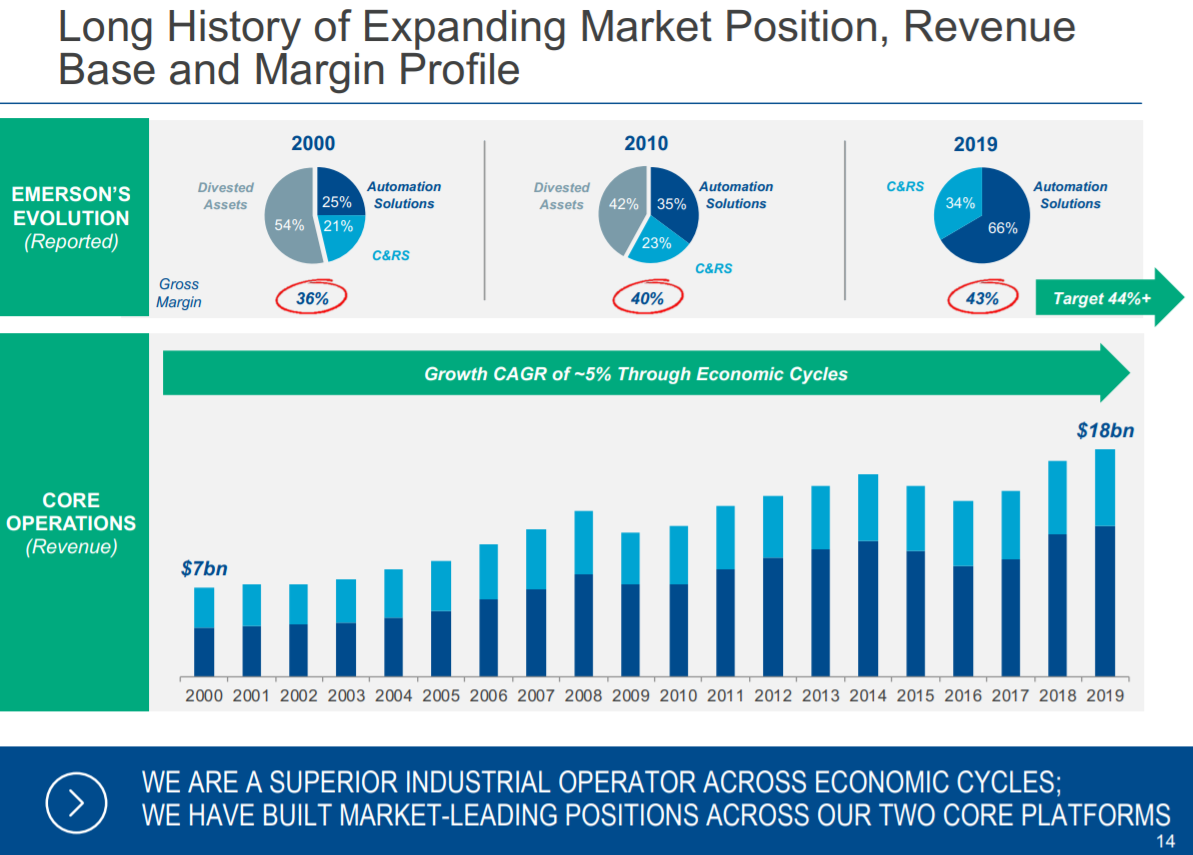
Source: Investor presentation, page 14
Emerson’s spotty revenue growth can be seen above as the long-term trend is higher, but there are many years where year-over-year revenue is lower. We see fiscal 2020 as the potential top in the current cycle for revenue given the headwinds mentioned above. The company has boosted its margins over time via the acquisitions and divestitures it has completed in recent years, but Emerson is still quite cyclical.
Competitive Advantages & Recession Performance
Emerson’s two main competitive advantages are its global scale, and proprietary technology. Emerson generates high margins and returns on capital thanks to its enormous global distribution network.
Emerson’s constant investment in new technology – totaling hundreds of millions of dollars annually – has given the company a leadership position across its two product segments. Its competitive advantages also allow it to navigate recessions better than most industrials.
Emerson’s earnings-per-share during the Great Recession are below:
- 2007 earnings-per-share of $2.66
- 2008 earnings-per-share of $3.11 (17% increase)
- 2009 earnings-per-share of $2.27 (27% decline)
- 2010 earnings-per-share of $2.60 (15% increase)
- 2011 earnings-per-share of $3.24 (25% increase, new post-recession high)
Emerson performed relatively well during the Great Recession, with only one year of declining earnings. Normally, industrial manufacturers are tied to the health of the global economy. Its resilience during the Great Recession is a credit to its competitive advantages. However, we note that Emerson can see cycle tops without a recession, as has been the case in the past.
Valuation & Expected Returns
Emerson’s valuation has increased significantly in recent months, and it is trading well above our estimate of fair value. Indeed, the stock trades for 20.7 times the midpoint of earnings-per-share guidance provided by management, which compares to our estimate of fair value at 17 times earnings.
Today, the stock is meaningfully overvalued. This is more akin to recent years’ valuations when Emerson routinely traded in excess of 20 times earnings. However, given the concerns over global fixed investment and the company’s own order forecast, we think now is the wrong time to boost the valuation of the stock.
Looking ahead, we see Emerson as producing just ~2% total annual returns for shareholders. This will consist of the current yield near 3%, earnings-per-share growth of 3% and a ~4% negative impact from the valuation declining over time. Given this move up in the valuation, we see Emerson as much less attractive.
As a result, while we like Emerson’s outstanding dividend history, we think the stock is substantially overvalued, and that growth is at or near a top for this cycle. Given this, we rate Emerson a sell.
Final Thoughts
Emerson is a high-quality business, with a long history of steady growth. It has rewarded shareholders along the way, with more than six decades of annual dividend growth.
Right now is not be the best buying opportunity for the stock. The valuation has expanded thanks to a sharp rally in the stock, so investors that want to initiate a position would do well to wait for a much lower valuation closer to our target of 17 times earnings.
Emerson has a solid 2.7% dividend yield, and remains a sure bet to increase its dividend each year. However, investors looking more closely at total returns are likely to be disappointed with Emerson stock at the current valuation.