


Updated on December 3rd, 2019 by Nate Parsh
Johnson & Johnson (JNJ) is a company that many investors are likely familiar with. J&J has been in operation for more than 130 years, and has raised its dividend for 57 years in a row. It has one of the longest and most impressive histories of any dividend growth stock.
J&J is a long-standing member of the Dividend Aristocrats. You can see a full downloadable list of all Dividend Aristocrats (along with important financial metrics that matter) by clicking the link below:
In addition to the downloadable spreadsheet, you can see a preview of the Dividend Aristocrats list in the table below:
| 3M Co. | 168.27 | 3.4 | 96,763 | 19.7 | 66.4 | 1.08 |
| A. O. Smith Corp. | 47.33 | 1.9 | 6,487 | 19.5 | 36.3 | 0.91 |
| Abbott Laboratories | 84.51 | 1.5 | 149,362 | 45.5 | 68.9 | 1.04 |
| AbbVie, Inc. | 87.03 | 4.9 | 128,701 | 39.9 | 196.3 | 0.88 |
| Aflac, Inc. | 52.68 | 2.0 | 38,668 | 12.9 | 26.3 | 0.73 |
| Air Products & Chemicals, Inc. | 230.97 | 2.0 | 50,895 | 28.9 | 57.4 | 0.82 |
| Archer-Daniels-Midland Co. | 43.29 | 3.2 | 24,098 | 20.5 | 65.5 | 0.83 |
| AT&T, Inc. | 37.32 | 5.5 | 272,622 | 16.7 | 91.0 | 0.60 |
| Automatic Data Processing, Inc. | 168.59 | 1.9 | 72,948 | 30.8 | 57.8 | 1.01 |
| Becton, Dickinson & Co. | 259.03 | 1.2 | 69,926 | 65.4 | 77.8 | 1.00 |
| Brown-Forman Corp. | 67.42 | 1.0 | 32,195 | 39.3 | 38.2 | 0.72 |
| Cardinal Health, Inc. | 54.64 | 3.5 | 15,981 | -3.9 | -13.6 | 0.94 |
| Caterpillar, Inc. | 142.96 | 2.5 | 79,007 | 13.5 | 34.0 | 1.36 |
| Chubb Ltd. | 149.78 | 2.0 | 67,880 | 18.8 | 37.2 | 0.62 |
| Chevron Corp. | 116.80 | 4.0 | 220,853 | 16.6 | 66.8 | 0.84 |
| Cincinnati Financial Corp. | 105.63 | 2.1 | 17,257 | 18.8 | 39.3 | 0.72 |
| Cintas Corp. | 255.89 | 1.0 | 26,484 | 29.4 | 29.3 | 1.01 |
| The Clorox Co. | 148.93 | 2.7 | 18,691 | 23.3 | 63.2 | 0.46 |
| The Coca-Cola Co. | 53.75 | 3.0 | 230,291 | 29.7 | 87.9 | 0.43 |
| Colgate-Palmolive Co. | 67.57 | 2.5 | 57,910 | 25.0 | 62.9 | 0.55 |
| Consolidated Edison, Inc. | 85.55 | 3.4 | 28,439 | 20.1 | 69.0 | 0.24 |
| Dover Corp. | 110.31 | 1.7 | 16,024 | 24.6 | 43.1 | 1.11 |
| Ecolab, Inc. | 185.16 | 1.0 | 53,371 | 35.0 | 34.8 | 0.81 |
| Emerson Electric Co. | 73.36 | 2.7 | 44,687 | 19.6 | 52.3 | 1.18 |
| Exxon Mobil Corp. | 68.42 | 4.9 | 289,492 | 19.9 | 98.5 | 0.91 |
| Federal Realty Investment Trust | 129.76 | 3.2 | 9,881 | 38.5 | 122.1 | 0.53 |
| Franklin Resources, Inc. | 26.98 | 3.9 | 13,437 | 11.5 | 44.1 | 1.13 |
| General Dynamics Corp. | 177.99 | 2.2 | 51,493 | 15.3 | 34.2 | 0.91 |
| Genuine Parts Co. | 104.72 | 2.9 | 15,215 | 19.1 | 55.0 | 0.77 |
| Hormel Foods Corp. | 45.43 | 1.8 | 24,258 | 24.8 | 45.9 | 0.50 |
| Illinois Tool Works, Inc. | 172.08 | 2.4 | 55,307 | 22.6 | 53.3 | 1.21 |
| Johnson & Johnson | 137.36 | 2.7 | 361,513 | 25.9 | 69.7 | 0.60 |
| Kimberly-Clark Corp. | 136.30 | 3.0 | 46,724 | 23.2 | 69.7 | 0.48 |
| Leggett & Platt, Inc. | 52.21 | 3.0 | 6,870 | 23.4 | 70.0 | 1.09 |
| Linde Plc | 200.63 | 1.7 | 107,773 | 20.5 | 35.3 | 0.79 |
| Lowe's Cos., Inc. | 116.00 | 1.8 | 89,088 | 30.7 | 54.4 | 1.04 |
| McCormick & Co., Inc. | 169.21 | 1.3 | 22,490 | 31.8 | 41.9 | 0.40 |
| McDonald's Corp. | 195.18 | 2.4 | 146,988 | 25.4 | 60.3 | 0.42 |
| Medtronic Plc | 110.91 | 1.9 | 148,661 | 31.9 | 59.7 | 0.67 |
| Nucor Corp. | 56.64 | 2.8 | 17,174 | 9.7 | 27.3 | 1.16 |
| People's United Financial, Inc. | 16.31 | 4.3 | 7,243 | 12.4 | 53.6 | 0.95 |
| Pentair Plc | 43.79 | 1.6 | 7,360 | 21.3 | 34.7 | 1.21 |
| PepsiCo, Inc. | 135.88 | 2.8 | 189,475 | 15.4 | 42.7 | 0.52 |
| PPG Industries, Inc. | 128.50 | 1.5 | 30,385 | 25.2 | 38.3 | 0.92 |
| Procter & Gamble Co. | 122.72 | 2.4 | 306,040 | 76.2 | 181.8 | 0.54 |
| Roper Technologies, Inc. | 353.87 | 0.5 | 36,823 | 31.8 | 16.6 | 1.05 |
| S&P Global, Inc. | 262.19 | 0.8 | 64,079 | 30.9 | 26.0 | 0.98 |
| The Sherwin-Williams Co. | 574.83 | 0.7 | 53,061 | 37.9 | 28.0 | 0.88 |
| Stanley Black & Decker, Inc. | 153.28 | 1.7 | 23,300 | 32.9 | 57.3 | 1.55 |
| Sysco Corp. | 80.82 | 1.9 | 41,236 | 24.5 | 47.2 | 0.51 |
| T. Rowe Price Group, Inc. | 122.26 | 2.4 | 28,569 | 15.3 | 37.3 | 1.22 |
| Target Corp. | 123.98 | 2.1 | 62,817 | 19.7 | 41.2 | 0.85 |
| United Technologies Corp. | 144.99 | 2.0 | 125,140 | 24.3 | 49.2 | 1.14 |
| VF Corp. | 87.99 | 2.2 | 35,140 | 27.1 | 60.3 | 1.15 |
| W.W. Grainger, Inc. | 315.03 | 1.8 | 16,969 | 18.3 | 32.5 | 1.06 |
| Walmart, Inc. | 119.28 | 1.8 | 339,265 | 23.7 | 41.9 | 0.60 |
| Walgreens Boots Alliance, Inc. | 59.27 | 3.0 | 52,900 | 13.7 | 41.2 | 1.04 |
| Name | Price | Dividend Yield | Market Cap ($M) | Forward P/E Ratio | Payout Ratio | Beta |
Not only is Johnson & Johnson a Dividend Aristocrat, it is a Dividend King as well. The Dividend Kings are an even more exclusive group of stocks, with 50+ years of consecutive dividend increases. There are just 27 companies that have achieved this accomplishment.
J&J has all of the qualities of a great dividend growth stock. It has a dividend yield above the S&P 500 average, backed by a strong brand and highly profitable business model, with potential for long-term growth.
This article will discuss the quintessential Dividend Aristocrat that is Johnson & Johnson.
Business Overview
J&J is a global healthcare giant. It has a market capitalization of $361 billion, and generates annual revenue of more than $81 billion.
Today, J&J operates in more than 60 countries and employs 134,000 people. It is a massive company, with more than 250 subsidiary companies.
In all, it manufactures and sells health care products through three main segments:
- Pharmaceuticals (51% of sales)
- Medical Devices (32% of sales)
- Consumer Health Products (17% of sales)
It has a diversified business model, with strong brands across its three core operating segments.

Source: Investor Presentation
J&J is one of the largest companies in the world, but it started from very humble beginnings. It was founded all the way back in 1886 by three brothers, Robert, James, and Edward Johnson. The company was incorporated the following year.
In 1888, the three brothers published a healthcare manuscript titled “Modern Methods of Antiseptic
Wound Treatment”, which would quickly become the leading standard for antiseptic surgery techniques. The same year, the three brothers began selling first aid kits, which also became the standard-bearer at the time.
Over the following decades, the company steadily brought new products to market. Soon, the company was the leading manufacturer across several healthcare categories, including baby powder, sanitary napkins, dental floss, and more.
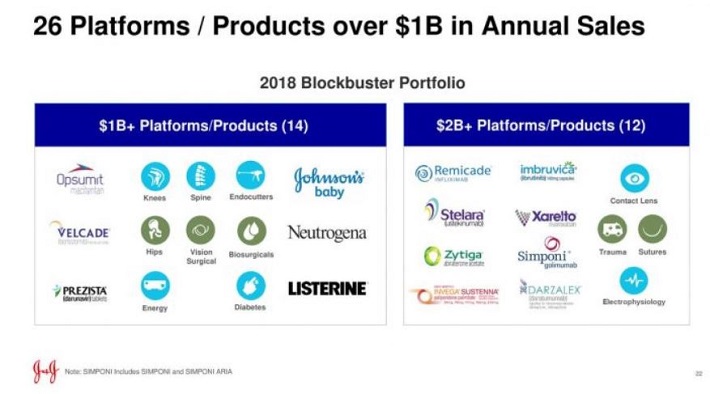
Today, Johnson & Johnson is still a leading manufacturer of consumer healthcare products. Its consumer franchise is broken up into six broad categories. Its most popular consumer brands include Band-Aid, Tylenol, Listerine, Johnson’s, and Neutrogena. Johnson’s, Neutrogena, and Listerine each generate more than $1 billion in annual sales. The consumer products business is highly profitable, and is a source of stability for J&J.
Not all the recent news related to J&J has been positive. On December 14th, 2018 Reuters released research stating that the company knew its baby powder could be contaminated with asbestos. After examining documents, the report stated that the company discussed ways to address the issue between 1971 and the early 2000s.
J&J has strongly denied this report, but the company has more than 12,000 product liability lawsuits related to its baby powder. The stock declined 10% the day of the Reuters report.
On December 19th, a Missouri circuit court judge dismissed a motion by the company to reverse its $4.7 billion jury award to plaintiffs claiming that its talc products caused their ovarian cancer. An appeal by J&J is underway.
There have been recent developments in some of the lawsuits against J&J. On October 15th, 2019, the Missouri appeals court overturned a $110 verdict in favor of Virginia woman who says she developed ovarian cancer after using the company’s baby powder products. The court overturned this verdict on the grounds that out-of-state plaintiffs are limited on their ability to sue within the state of Missouri.
Another issue impacting J&J and other pharmaceutical companies is the impact of opioids. Many U.S. states are looking into the role that pharmaceutical companies played in this widespread opioid epidemic. Lawsuits have already begun and judgments have been issued. For example, in August, a judge in Oklahoma found J&J liable for helping fuel the state’s opioid crisis. J&N has been ordered to pay $572 million, though this award was later reduced to $465 million.
Despite the various legal risks facing the company, we believe these are short-term challenges. In our view, Johnson & Johnson’s core business remains intact, and the company retains multiple catalysts for long-term growth.
Growth Prospects
Johnson & Johnson’s pharmaceutical segment is its strongest area of growth. This segment has recently generated much higher growth rates than medical devices or consumer products.
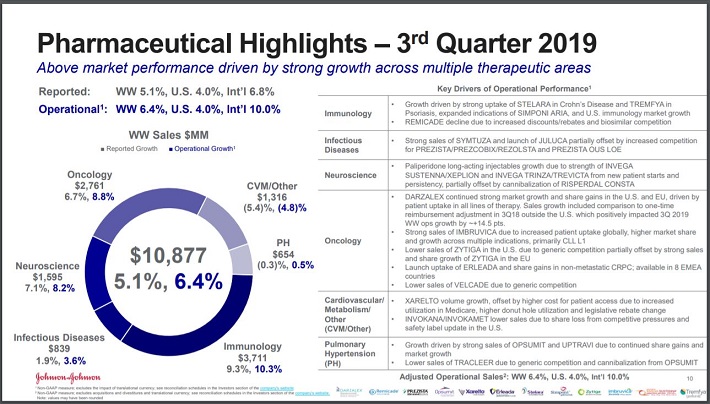
J&J had adjusted earnings-per-share of $2.12 in the third quarter of 2019, which represented 3.4% growth from the previous year. Revenue increased 1.9% to $20.7 billion. The pharmaceutical segment led the way, growing revenue 6.4% for the quarter. Consumer products grew by 3.3% while revenue for medical devices declined 2%.
International pharmaceutical sales, on an operational basis, increased 10% last quarter to lead the company.
Source: Investor Presentation
Within the pharmaceutical segment, two of the company’s best-performing areas continue to be oncology and immunology. Oncology sales rose by nearly 9% in constant currency, while the immunology segment grew by more than 10% in the third quarter.
In oncology, Darzalek, which treats multiple myeloma, had revenue growth of 54% on top of 63% growth in the third quarter of 2018. Imbruvica, which treats certain types of lymphoma, grew revenues by 31%% as the drug continues to see higher market share across multiple indications. J&J shares royalties with Imbruvica with fellow Dividend Aristocrat AbbVie (ABBV).
Stelara, which treats immune-mediated inflammatory diseases and is J&J’s top grossing product, had worldwide revenue growth of 30% during the quarter. Revenues for Simponia / Simpona Aria, which treats rheumatoid arthritis, increased 9.6%. J&J’s pharmaceutical pipeline is a positive growth catalyst for the long-term, as the company has a robust pipeline of new products.
Source: Investor Presentation
By 2021, J&J expects to file at least 10 new products, each with annual sales potential of $1 billion or more. It also sees the potential for 40 line extensions to existing products by then. Of these 40 extensions, 10 have potential for more than $500 million in annual revenue.
J&J is no stranger to acquisitions, big or small, to accelerate its growth. From 2016-2018, Johnson & Johnson spent over $40 billion on acquisitions, the largest of which was the $30 billion acquisition of Actelion, a stand-alone R&D company. Actelion’s R&D focuses on rare conditions with significant unmet need, such as pulmonary arterial hypertension.
Competitive Advantages & Recession Performance
Johnson & Johnson’s most important competitive advantage is innovation, which has fueled its amazing growth over the past 130 years. Its strong cash flow allows it to spend heavily on research and development. R&D is critical for a health care company, because it provides product innovation. R&D spending over the past few years is below:
- 2014 research-and-development expense of $8.5 billion
- 2015 research-and-development expense of $9.0 billion
- 2016 research-and-development expense of $9.1 billion
- 2017 research-and-development expense of $10.6 billion
- 2018 research-and-development expense of $11 billion
- 2019 research-and-development expense of $8.1 billion (through the third quarter)
R&D is also necessary to stay ahead of the dreaded “patent cliff”. Patent expirations can cause blockbuster drugs to deteriorate rapidly, once a flood of competition enters the market.
J&J’s aggressive R&D investments have resulted in product innovation and a robust pharmaceutical pipeline, which will help produce growth for years to come.
And, J&J’s excellent balance sheet provides a competitive advantage. It is one of only two U.S. companies with a ‘AAA’ credit rating from Standard & Poor’s, along with Microsoft (MSFT).
J&J’s brand leadership and consistent profitability allowed the company to navigate the Great Recession very well. Earnings-per-share during the Great Recession are below:
- 2007 earnings-per-share of $4.15
- 2008 earnings-per-share of $4.57 (10% increase)
- 2009 earnings-per-share of $4.63 (1% increase)
- 2010 earnings-per-share of $4.76 (3% increase)
As you can see, the company increased earnings in each year of the recession. This helped it continue raising its dividend each year, even though the U.S. was going through a steep economic downturn. Investors can be reasonably confident that the company will increase its dividend each year moving forward. The following video further illustrates J&J’s tremendous dividend safety:
Valuation & Expected Returns
Johnson & Johnson stock has struggled over the past year, presumably due to the various legal risks which have weighed on investor sentiment. In the past 1 year, the stock generated a negative total return of -3.1%, compared with a 17% total return for the S&P 500 ETF (SPY).
On the other hand, this has presented a more appealing valuation for investors considering buying the stock. J&J expects the midpoint of earnings-per-share for 2019 to be $8.58. Using the current share price of $137, the stock’s forward price-to-earnings ratio is 16. This is slightly above the average valuation of 15.8 over the last decade. If shares were to revert to their average price-to-earnings ratio by 2024, investors would see an annual returns reduced by just 0.3% over this time period.
Meanwhile, future returns will be fueled by earnings growth and dividends. J&J’s earnings increased by approximately 6% each year over the past 10 years. We expect the company to match this level of earnings growth over the next five years.
In addition, Johnson & Johnson has one of the longest dividend growth streaks in the market and continues to increase its dividend every year. Most recently, the company announced on April 25th that it was raising its dividend by 5.6%. Shares yield ~2.8% today.
The following is our forecast for expected total annual returns through 2024.
- 6% earnings-per-share growth
- 0.3% multiple reversion
- 2.8% dividend yield
We expect that J&J can offer investors a total annual return of 8.5% per year over the next five years, a satisfactory level of return for risk-averse income investors.
Final Thoughts
J&J has nearly six decades of consecutive dividend increases under its belt. There are very few certainties in the stock market, but one of them is that J&J will increase its dividend each year. The company has plenty of future growth, thanks to a strong pipeline and its recent acquisitions.
The issue facing the company J&J is the headline risk, regarding the possibility of asbestos in the company’s baby powder, and its role in the opioid epidemic. Litigation risk could continue to keep a lid on the valuation multiple of the stock. That said, the company remains a high-quality hold for an above-average yield and steady dividend growth.