


Updated on December 2nd, 2019 by Nate Parsh
Investors looking for high-quality dividend growth stocks should focus in part, on companies that maintain long histories of dividend increases. Steady dividend raises from year to year, regardless of the economic climate, is a sign of a company with durable competitive advantages and long-term growth potential.
With that in mind, every year we review each of the Dividend Aristocrats, a group of 57 companies in the S&P 500 Index, with 25+ consecutive years of dividend increases.
In addition to the downloadable spreadsheet, you can see a preview of the Dividend Aristocrats list in the table below:
| 3M Co. | 169.77 | 3.3 | 97,626 | 19.8 | 66.4 | 1.08 |
| A. O. Smith Corp. | 48.40 | 1.8 | 6,633 | 20.0 | 36.3 | 0.91 |
| Abbott Laboratories | 85.45 | 1.5 | 151,024 | 46.0 | 68.9 | 1.04 |
| AbbVie, Inc. | 87.73 | 4.9 | 129,736 | 40.2 | 196.3 | 0.88 |
| Aflac, Inc. | 54.84 | 2.0 | 40,253 | 13.5 | 26.3 | 0.72 |
| Air Products & Chemicals, Inc. | 236.33 | 1.9 | 52,076 | 29.6 | 57.4 | 0.81 |
| Archer-Daniels-Midland Co. | 42.93 | 3.2 | 23,898 | 20.3 | 65.5 | 0.83 |
| AT&T, Inc. | 37.38 | 5.5 | 273,060 | 16.7 | 91.0 | 0.60 |
| Automatic Data Processing, Inc. | 170.78 | 1.9 | 73,896 | 31.2 | 57.8 | 1.01 |
| Becton, Dickinson & Co. | 258.50 | 1.2 | 69,783 | 65.3 | 77.8 | 1.00 |
| Brown-Forman Corp. | 67.82 | 1.0 | 32,386 | 39.5 | 38.2 | 0.72 |
| Cardinal Health, Inc. | 55.03 | 3.5 | 16,095 | -3.9 | -13.6 | 0.94 |
| Caterpillar, Inc. | 144.73 | 2.5 | 79,986 | 13.6 | 34.0 | 1.36 |
| Chubb Ltd. | 151.48 | 2.0 | 68,651 | 19.0 | 37.2 | 0.62 |
| Chevron Corp. | 117.13 | 4.0 | 221,477 | 16.7 | 66.8 | 0.84 |
| Cincinnati Financial Corp. | 107.05 | 2.1 | 17,489 | 19.0 | 39.3 | 0.71 |
| Cintas Corp. | 257.06 | 1.0 | 26,605 | 29.5 | 29.3 | 1.01 |
| The Clorox Co. | 148.23 | 2.7 | 18,603 | 23.2 | 63.2 | 0.46 |
| The Coca-Cola Co. | 53.40 | 3.0 | 228,791 | 29.5 | 87.9 | 0.44 |
| Colgate-Palmolive Co. | 67.82 | 2.5 | 58,124 | 25.1 | 62.9 | 0.55 |
| Consolidated Edison, Inc. | 86.89 | 3.4 | 28,884 | 20.4 | 69.0 | 0.24 |
| Dover Corp. | 111.48 | 1.7 | 16,194 | 24.9 | 43.1 | 1.11 |
| Ecolab, Inc. | 186.67 | 1.0 | 53,806 | 35.3 | 34.8 | 0.80 |
| Emerson Electric Co. | 73.86 | 2.7 | 44,992 | 19.7 | 52.3 | 1.19 |
| Exxon Mobil Corp. | 68.13 | 5.0 | 288,265 | 19.9 | 98.5 | 0.92 |
| Federal Realty Investment Trust | 132.07 | 3.1 | 10,057 | 39.2 | 122.1 | 0.53 |
| Franklin Resources, Inc. | 27.49 | 3.8 | 13,691 | 11.7 | 44.1 | 1.13 |
| General Dynamics Corp. | 181.74 | 2.2 | 52,578 | 15.6 | 34.2 | 0.91 |
| Genuine Parts Co. | 104.37 | 2.9 | 15,164 | 19.1 | 55.0 | 0.77 |
| Hormel Foods Corp. | 44.53 | 1.9 | 23,777 | 24.3 | 45.9 | 0.51 |
| Illinois Tool Works, Inc. | 174.33 | 2.3 | 56,030 | 22.9 | 53.3 | 1.21 |
| Johnson & Johnson | 137.49 | 2.7 | 361,855 | 25.9 | 69.7 | 0.60 |
| Kimberly-Clark Corp. | 136.34 | 3.0 | 46,738 | 23.2 | 69.7 | 0.48 |
| Leggett & Platt, Inc. | 52.32 | 3.0 | 6,885 | 23.5 | 70.0 | 1.09 |
| Linde Plc | 206.21 | 1.7 | 110,771 | 21.1 | 35.3 | 0.78 |
| Lowe's Cos., Inc. | 117.31 | 1.8 | 90,094 | 31.0 | 54.4 | 1.04 |
| McCormick & Co., Inc. | 169.25 | 1.3 | 22,495 | 31.8 | 41.9 | 0.40 |
| McDonald's Corp. | 194.48 | 2.4 | 146,461 | 25.3 | 60.3 | 0.42 |
| Medtronic Plc | 111.39 | 1.9 | 149,304 | 32.0 | 59.7 | 0.67 |
| Nucor Corp. | 56.36 | 2.8 | 17,089 | 9.6 | 27.3 | 1.17 |
| People's United Financial, Inc. | 16.50 | 4.3 | 7,328 | 12.5 | 53.6 | 0.95 |
| Pentair Plc | 44.35 | 1.6 | 7,454 | 21.5 | 34.7 | 1.21 |
| PepsiCo, Inc. | 135.83 | 2.8 | 189,405 | 15.4 | 42.7 | 0.52 |
| PPG Industries, Inc. | 128.84 | 1.5 | 30,465 | 25.3 | 38.3 | 0.92 |
| Procter & Gamble Co. | 122.06 | 2.4 | 304,394 | 75.8 | 181.8 | 0.54 |
| Roper Technologies, Inc. | 360.37 | 0.5 | 37,499 | 32.4 | 16.6 | 1.04 |
| S&P Global, Inc. | 264.65 | 0.8 | 64,680 | 31.2 | 26.0 | 0.98 |
| The Sherwin-Williams Co. | 583.13 | 0.7 | 53,828 | 38.5 | 28.0 | 0.88 |
| Stanley Black & Decker, Inc. | 157.74 | 1.7 | 23,978 | 33.9 | 57.3 | 1.55 |
| Sysco Corp. | 80.55 | 1.9 | 41,098 | 24.4 | 47.2 | 0.51 |
| T. Rowe Price Group, Inc. | 123.56 | 2.4 | 28,873 | 15.5 | 37.3 | 1.22 |
| Target Corp. | 125.01 | 2.1 | 63,339 | 19.8 | 41.2 | 0.85 |
| United Technologies Corp. | 148.34 | 2.0 | 128,031 | 24.8 | 49.2 | 1.13 |
| VF Corp. | 88.54 | 2.2 | 35,360 | 27.2 | 60.3 | 1.15 |
| W.W. Grainger, Inc. | 316.95 | 1.8 | 17,072 | 18.4 | 32.5 | 1.06 |
| Walmart, Inc. | 119.09 | 1.8 | 338,725 | 23.7 | 41.9 | 0.61 |
| Walgreens Boots Alliance, Inc. | 59.60 | 3.0 | 53,195 | 13.8 | 41.2 | 1.04 |
| Name | Price | Dividend Yield | Market Cap ($M) | Forward P/E Ratio | Payout Ratio | Beta |
The next Dividend Aristocrat in the series, is healthcare giant Medtronic (MDT).
Medtronic has an impressive history of dividend growth. The company has increased its dividend for 42 years in a row. At 1.9%, Medtronic is not exactly a high-yield stock. In fact, the stock’s yield is just slightly higher than the average yield of the S&P 500.
But Medtronic typically raises its dividend at a high rate each year, thanks to its strong earnings growth and leadership position within the medical devices industry. These qualities make Medtronic an attractive dividend growth stock for long-term investors.
Business Overview
Medtronic was founded in 1949 as a medical equipment repair shop by Earl Bakken and his brother-in-law, Palmer Hermundslie. Today, Medtronic is one of the largest healthcare companies in the world. It has a market capitalization of $149 billion.
Medtronic PLC is the largest manufacturer of biomedical devices and implantable technologies in the world. The company serves physicians, hospitals and patients in more than 150 countries and has over 86,000 employees.

Source: Investor Presentation
Medtronic currently has four operating segments: Cardiac and Vascular Group, Minimally Invasive Therapies Group (MITG), Diabetes Group, and Restorative Therapies Group. The company generates over $30 billion in annual revenue.
The company’s largest segment is Cardiac & Vascular, which generated annual sales above $11 billion last year. Approximately 47% of Medtronic’s fiscal 2019 revenue was derived from outside the United States.
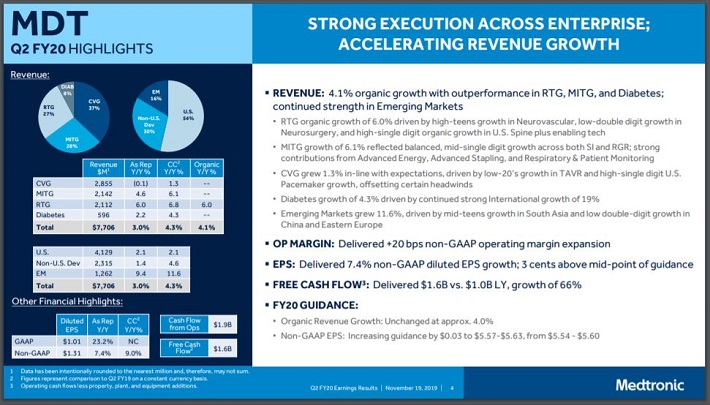
On November 20th, Medtronic reported financial results for the fiscal 2020 second quarter.
Source: Investor Presentation
The top line came in at $7.71 billion for the quarter, a 3% increase from the previous year. Currency exchange reduces results by 1.3%. Adjusted earnings-per-share grew 7.4% to $1.31. Both top and bottom-line results were above consensus estimates.
The MITG segment increased sales by 4.6% to $2.14 billion, Restorative Therapies grew sales 6% to $2.1 billion and the Diabetes Group increased sales 2.2% to $596 million. The Cardiac and Vascular Group was the lone segment to decline, dropping 0.1% to $2.9 billion. In constant currency, this segment grew 1.3%.
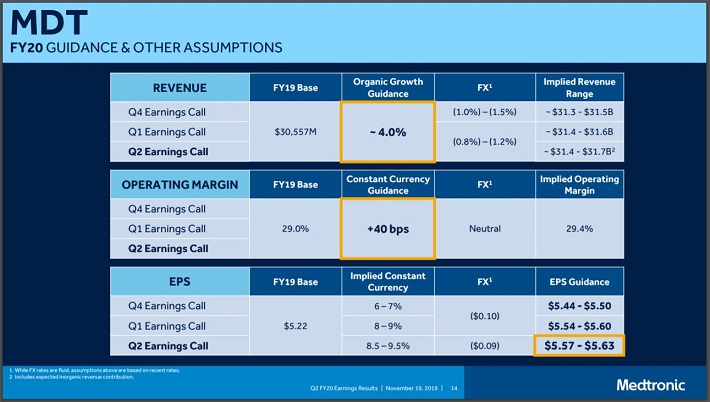
Along with providing last quarter’s financial results, Medtronic also updated its fiscal year 2020 guidance.
Source: Investor Presentation
The company reaffirmed revenue guidance and expects organic growth of 4%, with growth seen as accelerating in the second half compared to the first half. Revenue is expected in a range of $31.4 to $31.7 billion for fiscal 2020. Currency exchange is expected to reduce results by 0.8% to 1.2% for the year.
Medtronic expects adjusted earnings-per-share in a range of $5.57 to $5.63, up from previous guidance of $5.54 to $5.60. The current fiscal year is likely to be another year of steady growth for Medtronic.
And, thanks to the favorable economics of the U.S. healthcare industry, Medtronic should enjoy many years of growth up ahead.
Growth Prospects
Medtronic is investing in growth, both organically and through acquisitions. The first catalyst for Medtronic is the aging population. There are over 70 million Baby Boomers in the U.S., those aged 51-69 years. Thousands of people are entering retirement every day. Combined with longer life expectancy and rising healthcare spending, the operating environment is very attractive for Medtronic.
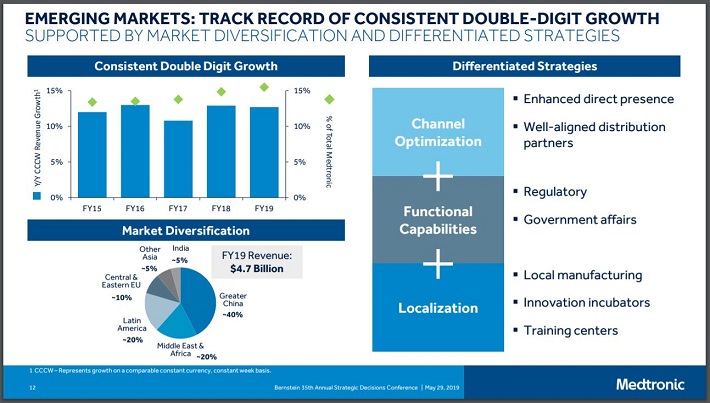
Medtronic also has a major growth opportunity in new geographic markets. Specifically, Medtronic has a presence in several emerging markets, such as China, India, Africa, and more. These countries have large populations and high economic growth rates.
Source: Investor Presentation
Medtronic’s emerging market revenue has consistently grown at a double-digit rate over the past seven years. On a reported basis, revenue from the emerging markets increased 9.4% last quarter, more than seven percentage points higher than Medtronic’s growth rate in the United States. In constant currency, Emerging Markets grew 11.6%.
While the U.S. currently accounts for over half of Medtronic’s revenue, the emerging markets represent just 16% of total company sales. This leaves plenty of growth potential left for Medtronic in the developing world.
Another growth catalyst for Medtronic is acquisitions. The largest single acquisition for Medtronic was its $50 billion acquisition of Covidien in 2015. The acquisition presented significant growth potential for Medtronic.
Covidien is also a medical device maker, with a focus on hospital supplies. The deal lets Medtronic broaden and diversify its product portfolio.
Medtronic has a long history of successful acquisitions. In fiscal 2017, Medtronic completed 5 bolt-on acquisitions, for a total of $1.5 billion. More recently, Medtronic acquired Titan Spine, which added $16 million to third quarter revenues. Acquisitions are an important part of Medtronic’s growth strategy.
Competitive Advantages & Recession Performance
The main competitive advantage for Medtronic is its research and development capabilities. The company spends heavily on R&D each year, which provides it with product innovation.
Medtronic’s R&D investments over the past few years are as follows:
- FY 2016 R&D expense of $2.2 billion
- FY 2017 R&D expense of $2.2 billion
- FY 2018 R&D expense of $2.3 billion
- FY 2019 R&D expense of $2.3 billion
- FY 2020 R&D expense of $1.2 billion (through the first half of the fiscal year)
The result of all this spending is that the company has a huge intellectual property portfolio with over 45,000 awarded patents. This has allowed Medtronic to build a strong product pipeline across each of its business segments.
In addition, Medtronic benefits tremendously from global scale. The company operates in over 150 countries around the world. It has the operational flexibility to generate industry-leading profit margins, which helps fuel its growth.
Another competitive advantage for Medtronic is that it operates in a defensive industry. Consumers often cannot choose to forego medical treatments, even when the economy goes into recession.
Medtronic’s earnings-per-share during the Great Recession are as follows:
- 2007 earnings-per-share of $2.61
- 2008 earnings-per-share of $2.92 (12% increase)
- 2009 earnings-per-share of $3.22 (10% increase)
- 2010 earnings-per-share of $3.37 (5% increase)
Medtronic had the rare achievement of earnings growth each year during the recession. This demonstrates its recession-resistant business model. Medtronic should be able to continue growing its dividend each year, in both economic recessions and expansions.
Valuation & Expected Returns
Based on the recent closing price of $111 and the midpoint for expected earnings-per-share of $5.60 in fiscal 2020, Medtronic stock trades for a price-to-earnings ratio of 19.8. The current valuation of the stock is significantly below that of the broader S&P 500 Index, but Medtronic’s valuation is above its own long-term average.
In the past 10 years, Medtronic stock held an average price-to-earnings ratio of 14.6. However, we feel Medtronic deserves a slightly higher valuation than the 10-year average. Our fair value estimate is a price-to-earnings ratio of 15, which represents a reasonable valuation for a blue-chip industry leader.
Still, Medtronic shares appear to be overvalued today. If the stock valuation retraces to our fair value estimate by 2024, the corresponding multiple contraction would reduce annual shareholder returns by approximately 5.4% per year over this period of time.
Fortunately, Medtronic stock will offset its overvaluation with earnings growth and dividends. Medtronic grew its earnings-per-share by 5.3% annually in the past 10 years. We expect 6% annual earnings growth for Medtronic through 2024.
Medtronic’s cash returns will also contribute to future returns. Medtronic routinely buys back its own stock, and it has increased its dividend for 42 consecutive years. With a dividend payout ratio near 39%, and a positive earnings growth outlook, there is plenty of room for Medtronic to continue increasing its dividend each year.
Total returns would consist of the following:
- 6.0% earnings growth rate
- 5.4% multiple reversion
- 1.9% dividend yield
Medtronic is expected to return just 2.5% annually over the next five years. Medtronic is yet another example of a high-quality business trading at an unappealing valuation. With the stock market near a record high, it is difficult for investors to find strong dividend growth stocks trading at compelling discounts.
Final Thoughts
Medtronic has virtually all of the qualities dividend growth investors should look for. It possesses a highly profitable business, a leadership position in its core markets, and long-term growth potential. It also has multiple catalysts for future growth, and the ability to keep growing its dividend even during recessions.
Medtronic has increased its dividend for more than four decades, including a strong 8% increase in 2019.
The only negative aspect of investing in Medtronic stock today is the valuation. We believe Medtronic is overvalued right now. As a result, value investors should wait for a pullback before buying the stock. That said, Medtronic remains a high-quality holding for long-term dividend growth investors.