


Updated on November 26th, 2019 by Eli Inkrot
Every year, we review all of the Dividend Aristocrats, a group of 57 companies in the S&P 500 Index with 25+ consecutive years of dividend increases.
In addition to the full downloadable spreadsheet, you can see a preview of the Dividend Aristocrats list in the table below:
| 3M Co. | 170.24 | 3.3 | 97,896 | 19.9 | 66.4 | 1.08 |
| A. O. Smith Corp. | 48.76 | 1.8 | 6,682 | 20.1 | 36.3 | 0.91 |
| Abbott Laboratories | 84.49 | 1.5 | 149,327 | 45.5 | 68.9 | 1.06 |
| AbbVie, Inc. | 87.76 | 4.9 | 129,781 | 40.3 | 196.3 | 0.88 |
| Aflac, Inc. | 54.30 | 2.0 | 39,857 | 13.3 | 26.3 | 0.71 |
| Air Products & Chemicals, Inc. | 234.74 | 2.0 | 51,726 | 29.4 | 57.4 | 0.80 |
| Archer-Daniels-Midland Co. | 43.08 | 3.2 | 23,982 | 20.4 | 65.5 | 0.81 |
| AT&T, Inc. | 37.26 | 5.5 | 272,184 | 16.6 | 91.0 | 0.61 |
| Automatic Data Processing, Inc. | 170.20 | 1.9 | 73,645 | 31.1 | 57.8 | 1.02 |
| Becton, Dickinson & Co. | 253.86 | 1.2 | 68,530 | 64.0 | 77.7 | 0.99 |
| Brown-Forman Corp. | 67.77 | 1.0 | 32,362 | 39.5 | 38.2 | 0.71 |
| Cardinal Health, Inc. | 56.35 | 3.4 | 16,481 | -4.0 | -13.6 | 0.92 |
| Caterpillar, Inc. | 146.42 | 2.5 | 80,920 | 13.8 | 34.0 | 1.38 |
| Chubb Ltd. | 149.97 | 2.0 | 67,966 | 18.9 | 37.2 | 0.62 |
| Chevron Corp. | 118.38 | 4.0 | 223,841 | 16.9 | 66.8 | 0.85 |
| Cincinnati Financial Corp. | 105.94 | 2.1 | 17,307 | 18.8 | 39.3 | 0.72 |
| Cintas Corp. | 250.87 | 1.0 | 25,965 | 28.8 | 29.3 | 1.01 |
| The Clorox Co. | 145.25 | 2.8 | 18,229 | 22.7 | 63.2 | 0.44 |
| The Coca-Cola Co. | 53.22 | 3.0 | 228,020 | 29.4 | 87.9 | 0.43 |
| Colgate-Palmolive Co. | 66.98 | 2.5 | 57,404 | 24.8 | 62.9 | 0.54 |
| Consolidated Edison, Inc. | 86.04 | 3.4 | 28,602 | 20.2 | 69.0 | 0.24 |
| Dover Corp. | 111.95 | 1.7 | 16,262 | 25.0 | 43.1 | 1.08 |
| Ecolab, Inc. | 182.06 | 1.0 | 52,477 | 34.4 | 34.8 | 0.80 |
| Emerson Electric Co. | 74.35 | 2.6 | 45,290 | 19.9 | 52.3 | 1.17 |
| Exxon Mobil Corp. | 68.91 | 4.9 | 291,565 | 20.1 | 98.5 | 0.92 |
| Federal Realty Investment Trust | 130.37 | 3.2 | 9,927 | 38.7 | 122.1 | 0.52 |
| Franklin Resources, Inc. | 27.98 | 3.7 | 13,935 | 11.9 | 44.1 | 1.11 |
| General Dynamics Corp. | 182.66 | 2.2 | 52,844 | 15.7 | 34.2 | 0.90 |
| Genuine Parts Co. | 103.98 | 2.9 | 15,107 | 19.0 | 55.0 | 0.78 |
| Hormel Foods Corp. | 42.76 | 1.9 | 22,832 | 23.2 | 44.3 | 0.48 |
| Illinois Tool Works, Inc. | 175.18 | 2.3 | 56,303 | 23.0 | 53.3 | 1.20 |
| Johnson & Johnson | 137.18 | 2.7 | 361,039 | 25.8 | 69.7 | 0.60 |
| Kimberly-Clark Corp. | 133.35 | 3.1 | 45,713 | 22.7 | 69.7 | 0.46 |
| Leggett & Platt, Inc. | 52.83 | 3.0 | 6,952 | 23.7 | 70.0 | 1.08 |
| Linde Plc | 205.94 | 1.7 | 110,626 | 21.1 | 35.3 | 0.78 |
| Lowe's Cos., Inc. | 117.00 | 1.8 | 89,856 | 30.9 | 54.4 | 1.04 |
| McCormick & Co., Inc. | 166.62 | 1.3 | 22,145 | 31.3 | 41.9 | 0.39 |
| McDonald's Corp. | 191.89 | 2.4 | 144,511 | 24.9 | 60.3 | 0.42 |
| Medtronic Plc | 111.78 | 1.9 | 149,827 | 32.1 | 59.7 | 0.67 |
| Nucor Corp. | 55.92 | 2.9 | 16,955 | 9.5 | 27.3 | 1.15 |
| People's United Financial, Inc. | 16.48 | 4.3 | 7,319 | 12.5 | 53.6 | 0.96 |
| Pentair Plc | 44.02 | 1.6 | 7,399 | 21.4 | 34.7 | 1.20 |
| PepsiCo, Inc. | 133.83 | 2.8 | 186,616 | 15.2 | 42.7 | 0.53 |
| PPG Industries, Inc. | 127.79 | 1.5 | 30,217 | 25.1 | 38.3 | 0.91 |
| Procter & Gamble Co. | 120.51 | 2.4 | 300,529 | 74.9 | 181.8 | 0.53 |
| Roper Technologies, Inc. | 359.69 | 0.5 | 37,428 | 32.3 | 16.6 | 1.04 |
| S&P Global, Inc. | 265.85 | 0.8 | 64,973 | 31.3 | 26.0 | 0.99 |
| The Sherwin-Williams Co. | 580.01 | 0.7 | 53,540 | 38.2 | 28.0 | 0.87 |
| Stanley Black & Decker, Inc. | 159.29 | 1.7 | 24,213 | 34.2 | 57.3 | 1.53 |
| Sysco Corp. | 79.82 | 2.0 | 40,726 | 24.2 | 47.2 | 0.51 |
| T. Rowe Price Group, Inc. | 122.58 | 2.4 | 28,644 | 15.4 | 37.3 | 1.23 |
| Target Corp. | 125.19 | 2.1 | 63,431 | 19.8 | 41.2 | 0.84 |
| United Technologies Corp. | 147.52 | 2.0 | 127,324 | 24.7 | 49.2 | 1.09 |
| VF Corp. | 86.55 | 2.3 | 34,565 | 26.6 | 60.3 | 1.14 |
| W.W. Grainger, Inc. | 320.49 | 1.7 | 17,263 | 18.6 | 32.5 | 1.07 |
| Walmart, Inc. | 118.92 | 1.8 | 338,241 | 23.6 | 41.9 | 0.61 |
| Walgreens Boots Alliance, Inc. | 60.67 | 2.9 | 54,150 | 14.1 | 41.2 | 1.03 |
| Name | Price | Dividend Yield | Market Cap ($M) | Forward P/E Ratio | Payout Ratio | Beta |
Leggett & Platt (LEG) might not be a household name, but it is likely that millions of consumers come in contact with one (or more) of the company’s products every day.
Leggett & Platt has also increased its dividend – which currently yields 3.0% – for 48 years in a row. Leggett & Platt has a strong business model with durable competitive advantages, making it an attractive dividend growth stock. However, the high stock valuation meaningfully reduces our expected rate of return for this Dividend Aristocrat.
Business Overview
Leggett & Platt is a diversified manufacturing company. It was founded all the way back in 1883 when an inventor named J.P. Leggett created a bedspring that was superior to the existing products at that time.
Today, Leggett & Platt designs and manufactures a wide range of products, including bedding components, bedding industry machinery, steel wire, adjustable beds, carpet cushioning, and vehicle seat support systems. It designs and manufactures products found in many homes and automobiles. The company has a diversified business, both in terms of product mix and geographic split.
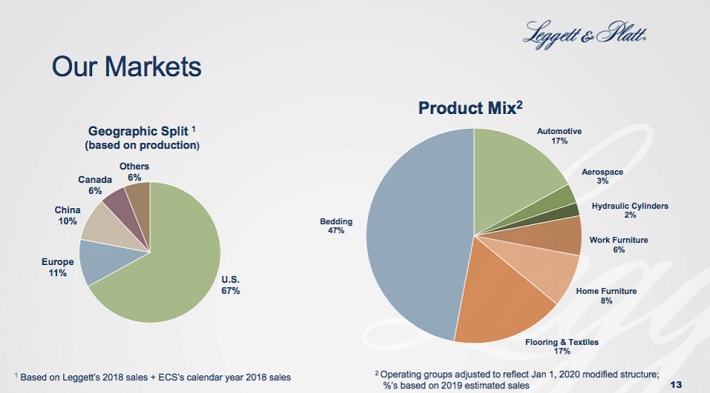
Source: 2019 Investor Day Presentation
Leggett & Platt reported its third quarter earnings results on October 29th, 2019. The company reported revenue of $1.24 billion for the quarter, which represents a 13.6% growth rate compared to the prior year’s quarter. Revenue beat the consensus analyst estimate slightly. The company’s revenue growth was based on a 16% sales gain thanks to the impact of acquisitions, while the decision to exit some businesses resulted in a small headwind to revenue.
Leggett & Platt generated earnings-per-share of $0.76 during the third quarter, which represents an attractive gain of 15% versus earnings-per-share of $0.66 during the previous year’s quarter. Leggett & Platt’s earnings-per-share for the third quarter also beat the analyst consensus estimate by a sizeable amount of $0.09.
Leggett & Platt’s guidance ranges for sales and earnings-per-share were raised compared to the previous level. The company now forecasts revenue of $4.7 billion to $4.8 billion for fiscal 2019, which represents a growth rate of 10% to 12% compared to what the company generated during fiscal 2018. Revenue growth will be positively impacted by the acquisition of Elite Comfort Solutions that closed earlier this year. Leggett & Platt also guided for earnings-per-share in a range of $2.48 to $2.63 for fiscal 2019.
Growth Prospects
Growth at Leggett & Platt will rely on a multi-faceted approach, including acquisitions, share repurchases and efficiencies achieved through cost controls.
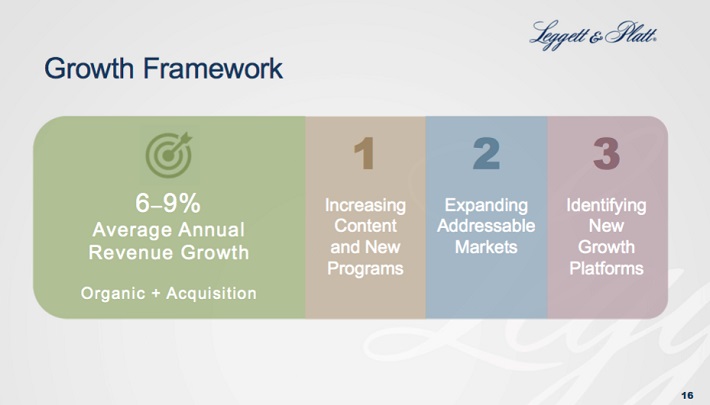
Source: 2019 Investor Day Presentation
Leggett & Platt has a long-held policy of acquiring smaller companies to expand its market dominance in existing categories, or to branch out into new areas. An example of this bolt-on strategy was the recent $1.25 billion purchase of Elite Comfort Solutions.
Share repurchases will also help maintain earnings growth. Since 2007 Leggett & Platt has retired over 20% of its shares, representing a -2.2% annualized reduction rate. While this may not seem like a large difference from quarter-to-quarter, over time this type of activity provides an ongoing boost to per share results.
Another key component of Leggett & Platt’s earnings growth strategy is cost controls. The company continuously evaluates its portfolio to ensure it is investing in the highest-growth opportunities, and it is not afraid to divest low-margin businesses with poor expected growth. For low-growth or low-margin businesses, it either improves performance, or exits the category. The company also drives cost reductions across the business, including in selling, general, and administrative expenses, and distribution costs.
Leggett & Platt has been able to reach its long-term growth targets thanks in large part to its significant competitive advantages in the core industries in which it operates.
Still, growth has moved in fits and starts at times. From 2006 through 2013, effectively no growth in earnings-per-share formulated. Then from 2013 to 2016, earnings-per-share jumped 70%. More recently, earnings-per-share have stalled in the $2.50 to $2.60 range, with the expectation for this year being no exception.
Overall we are forecasting 6% annual growth over the intermediate-term.
Competitive Advantages & Recession Performance
Leggett & Platt has established a wide economic “moat,” meaning it has several operational advantages, which keep competitors at bay. First, the company enjoys a leadership position in the industry, which allows for scale.
Leggett & Platt also benefits from operating in a fragmented industry, which makes it easier to establish a dominant position. In most of its product markets, there are few, or no, large competitors. And when a smaller competitor does achieve significant market share, Leggett & Platt can simply acquire them, as it did with Elite Comfort Solutions.
Leggett & Platt also has an extensive patent portfolio, which is critical in keeping competition at bay. Leggett & Platt has impressive intellectual property, consisting of approximately 1,500 patents issued and nearly 1,000 registered trademarks.
Together, these competitive advantages help Leggett & Platt maintain healthy margins and consistent profitability. That said, the company did not perform well during the Great Recession.
Earnings-per-share during the Great Recession are shown below:
- 2006 earnings-per-share of $1.57
- 2007 earnings-per-share of $0.28 (-82% decline)
- 2008 earnings-per-share of $0.73 (161% increase)
- 2009 earnings-per-share of $0.74 (1% increase)
- 2010 earnings-per-share of $1.15 (55% increase)
This earnings volatility should not come as a surprise. As primarily a mattress and furniture products manufacturer, it is reliant on a healthy housing market for growth. The housing market collapsed during the Great Recession, which caused a significant decline in earnings-per-share in 2007.
Leggett & Platt is also reliant on consumer confidence, as roughly two-thirds of furniture purchases in the United States are replacements of existing products. When the economy enters a downturn, consumer confidence typically declines.
It also took several years for Leggett & Platt to recover from the effects of the Great Recession. Earnings continued to rise after 2007, but earnings-per-share did not exceed 2006 levels until 2012. This demonstrates that Leggett & Platt is not a recession-resistant business.
Fortunately, the company maintains a strong financial position, which allows it to remain profitable and continue increasing dividends each year, even during recessions.
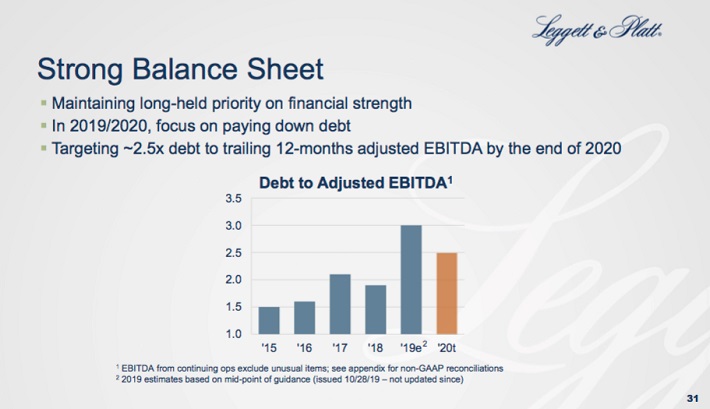
Source: 2019 Investor Day Presentation
Leggett & Platt has a healthy balance sheet, with a manageable level of debt that does not burden the company with overly high interest payments.
Valuation & Expected Returns
As previously mentioned, Leggett & Platt has an impressive dividend history.
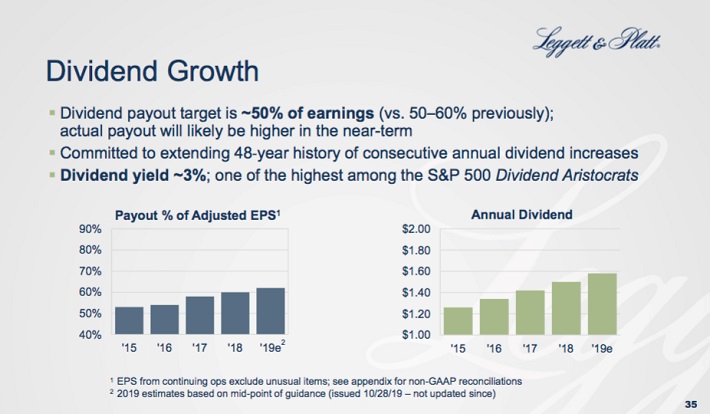
Source: 2019 Investor Day Presentation
It also has a current dividend yield of 3%. However, investors should assess the valuation of the stock in addition to its dividend yield.
Using the midpoint of management guidance, Leggett & Platt is expected to generate earnings-per-share of $2.56 for 2019. Based on a current stock price of $53, which has increased over 30% in the last 10 months, the security is presently trading at a price-to-earnings ratio of 20.7.
While the company has been a steady grower over many years, with a long dividend history, we believe something closer to 16 times earnings is a fair starting place. As such, this could indicate the potential for a meaningful valuation headwind over the intermediate-term, to the tune of -5% per annum.
If you combine the 6% expected growth rate, 3% starting dividend yield and -5% potential valuation headwind, you come to an expected annualized total return assumption of low to mid-single-digits for the security.
Final Thoughts
Leggett & Platt has utilized a proven growth strategy, that has been successful for over 130 years. The company is highly profitable, and has a solid 3% dividend yield, which has grown for 48 years in a row. Further, Leggett & Platt has also earned a place on our list of “blue-chip” stocks. You can see the full list of blue-chip stocks here.
With that being said, Leggett & Platt’s significant share price run in 2019, along with only marginal earnings improvement, has lifted shares to a historically high valuation. It is possible that shares could remain at this level. However, if the valuation were to revert to a more typical valuation, this could considerably reduce an investor’s total return expectation.
Leggett & Platt is an attractive stock for investors interested in stable dividend growth stocks; however, we believe that the current valuation is too high to buy the stock right now.