


Updated on November 26th, 2019 by Eli Inkrot
Air Products & Chemicals (APD) may not be the most well-known Dividend Aristocrat. The company is primarily a business-to-business manufacturer and distributor of industrial gases.
However, Air Products & Chemicals is an elite dividend stock as a member of the Dividend Aristocrats, a group of reliable dividend stocks with 25+ years of consecutive dividend increases.
In addition to the full downloadable spreadsheet, you can see a preview of the Dividend Aristocrats list in the table below:
| 3M Co. | 170.24 | 3.3 | 97,896 | 19.9 | 66.4 | 1.08 |
| A. O. Smith Corp. | 48.76 | 1.8 | 6,682 | 20.1 | 36.3 | 0.91 |
| Abbott Laboratories | 84.49 | 1.5 | 149,327 | 45.5 | 68.9 | 1.06 |
| AbbVie, Inc. | 87.76 | 4.9 | 129,781 | 40.3 | 196.3 | 0.88 |
| Aflac, Inc. | 54.30 | 2.0 | 39,857 | 13.3 | 26.3 | 0.71 |
| Air Products & Chemicals, Inc. | 234.74 | 2.0 | 51,726 | 29.4 | 57.4 | 0.80 |
| Archer-Daniels-Midland Co. | 43.08 | 3.2 | 23,982 | 20.4 | 65.5 | 0.81 |
| AT&T, Inc. | 37.26 | 5.5 | 272,184 | 16.6 | 91.0 | 0.61 |
| Automatic Data Processing, Inc. | 170.20 | 1.9 | 73,645 | 31.1 | 57.8 | 1.02 |
| Becton, Dickinson & Co. | 253.86 | 1.2 | 68,530 | 64.0 | 77.7 | 0.99 |
| Brown-Forman Corp. | 67.77 | 1.0 | 32,362 | 39.5 | 38.2 | 0.71 |
| Cardinal Health, Inc. | 56.35 | 3.4 | 16,481 | -4.0 | -13.6 | 0.92 |
| Caterpillar, Inc. | 146.42 | 2.5 | 80,920 | 13.8 | 34.0 | 1.38 |
| Chubb Ltd. | 149.97 | 2.0 | 67,966 | 18.9 | 37.2 | 0.62 |
| Chevron Corp. | 118.38 | 4.0 | 223,841 | 16.9 | 66.8 | 0.85 |
| Cincinnati Financial Corp. | 105.94 | 2.1 | 17,307 | 18.8 | 39.3 | 0.72 |
| Cintas Corp. | 250.87 | 1.0 | 25,965 | 28.8 | 29.3 | 1.01 |
| The Clorox Co. | 145.25 | 2.8 | 18,229 | 22.7 | 63.2 | 0.44 |
| The Coca-Cola Co. | 53.22 | 3.0 | 228,020 | 29.4 | 87.9 | 0.43 |
| Colgate-Palmolive Co. | 66.98 | 2.5 | 57,404 | 24.8 | 62.9 | 0.54 |
| Consolidated Edison, Inc. | 86.04 | 3.4 | 28,602 | 20.2 | 69.0 | 0.24 |
| Dover Corp. | 111.95 | 1.7 | 16,262 | 25.0 | 43.1 | 1.08 |
| Ecolab, Inc. | 182.06 | 1.0 | 52,477 | 34.4 | 34.8 | 0.80 |
| Emerson Electric Co. | 74.35 | 2.6 | 45,290 | 19.9 | 52.3 | 1.17 |
| Exxon Mobil Corp. | 68.91 | 4.9 | 291,565 | 20.1 | 98.5 | 0.92 |
| Federal Realty Investment Trust | 130.37 | 3.2 | 9,927 | 38.7 | 122.1 | 0.52 |
| Franklin Resources, Inc. | 27.98 | 3.7 | 13,935 | 11.9 | 44.1 | 1.11 |
| General Dynamics Corp. | 182.66 | 2.2 | 52,844 | 15.7 | 34.2 | 0.90 |
| Genuine Parts Co. | 103.98 | 2.9 | 15,107 | 19.0 | 55.0 | 0.78 |
| Hormel Foods Corp. | 42.76 | 1.9 | 22,832 | 23.2 | 44.3 | 0.48 |
| Illinois Tool Works, Inc. | 175.18 | 2.3 | 56,303 | 23.0 | 53.3 | 1.20 |
| Johnson & Johnson | 137.18 | 2.7 | 361,039 | 25.8 | 69.7 | 0.60 |
| Kimberly-Clark Corp. | 133.35 | 3.1 | 45,713 | 22.7 | 69.7 | 0.46 |
| Leggett & Platt, Inc. | 52.83 | 3.0 | 6,952 | 23.7 | 70.0 | 1.08 |
| Linde Plc | 205.94 | 1.7 | 110,626 | 21.1 | 35.3 | 0.78 |
| Lowe's Cos., Inc. | 117.00 | 1.8 | 89,856 | 30.9 | 54.4 | 1.04 |
| McCormick & Co., Inc. | 166.62 | 1.3 | 22,145 | 31.3 | 41.9 | 0.39 |
| McDonald's Corp. | 191.89 | 2.4 | 144,511 | 24.9 | 60.3 | 0.42 |
| Medtronic Plc | 111.78 | 1.9 | 149,827 | 32.1 | 59.7 | 0.67 |
| Nucor Corp. | 55.92 | 2.9 | 16,955 | 9.5 | 27.3 | 1.15 |
| People's United Financial, Inc. | 16.48 | 4.3 | 7,319 | 12.5 | 53.6 | 0.96 |
| Pentair Plc | 44.02 | 1.6 | 7,399 | 21.4 | 34.7 | 1.20 |
| PepsiCo, Inc. | 133.83 | 2.8 | 186,616 | 15.2 | 42.7 | 0.53 |
| PPG Industries, Inc. | 127.79 | 1.5 | 30,217 | 25.1 | 38.3 | 0.91 |
| Procter & Gamble Co. | 120.51 | 2.4 | 300,529 | 74.9 | 181.8 | 0.53 |
| Roper Technologies, Inc. | 359.69 | 0.5 | 37,428 | 32.3 | 16.6 | 1.04 |
| S&P Global, Inc. | 265.85 | 0.8 | 64,973 | 31.3 | 26.0 | 0.99 |
| The Sherwin-Williams Co. | 580.01 | 0.7 | 53,540 | 38.2 | 28.0 | 0.87 |
| Stanley Black & Decker, Inc. | 159.29 | 1.7 | 24,213 | 34.2 | 57.3 | 1.53 |
| Sysco Corp. | 79.82 | 2.0 | 40,726 | 24.2 | 47.2 | 0.51 |
| T. Rowe Price Group, Inc. | 122.58 | 2.4 | 28,644 | 15.4 | 37.3 | 1.23 |
| Target Corp. | 125.19 | 2.1 | 63,431 | 19.8 | 41.2 | 0.84 |
| United Technologies Corp. | 147.52 | 2.0 | 127,324 | 24.7 | 49.2 | 1.09 |
| VF Corp. | 86.55 | 2.3 | 34,565 | 26.6 | 60.3 | 1.14 |
| W.W. Grainger, Inc. | 320.49 | 1.7 | 17,263 | 18.6 | 32.5 | 1.07 |
| Walmart, Inc. | 118.92 | 1.8 | 338,241 | 23.6 | 41.9 | 0.61 |
| Walgreens Boots Alliance, Inc. | 60.67 | 2.9 | 54,150 | 14.1 | 41.2 | 1.03 |
| Name | Price | Dividend Yield | Market Cap ($M) | Forward P/E Ratio | Payout Ratio | Beta |
Air Products & Chemicals’ dividend history – 37 years of consecutive dividend increases – indicates that the company is a model of consistency.
The company has reinvented itself in recent years. A spinoff and a separate significant divestiture were implemented with the goal of streamlining the company’s business model and focusing on its core industrial gas operations. Still, the company appears poised to continue raising its dividend for many years to come.
Business Overview
Air Products & Chemicals is one of the largest producers and distributors of atmospheric and process gasses in the world. Its customers include other businesses in the industrial, technology, energy, and materials sectors. Air Products & Chemicals was founded in 1940 and has a current market capitalization of $52 billion.
It also has a significant international presence. Roughly 40% of the company’s annual sales are generated in the U.S. and Canada, with the remainder spread across Latin America, Europe, and Asia.
Air Products & Chemicals released financial results for Q4 fiscal year 2019 on November 7th, 2019. The company generated revenue of $2.28 billion during the quarter, which was down -0.9% year-over-year, and missed the analyst consensus by $90 million.
Currency rate movements had a major negative impact on Air Products & Chemicals’ revenue, as currency adjusted revenue would have been up by 1% year-over-year, mainly thanks to strong pricing and volume gains of ~3%. A contract modification for its business in India was another headwind for revenue, as was energy cost pass-through, although that was neutral to the company’s earnings.
Air Products & Chemicals expanded its EBITDA margin to a new record level of 41.9% during the fourth quarter, which helped the company to generate earnings-per-share of $2.27. Earnings-per-share grew at a highly attractive rate of 14% compared to the previous year’s fourth quarter.
Here’s a look at the company’s full year results:
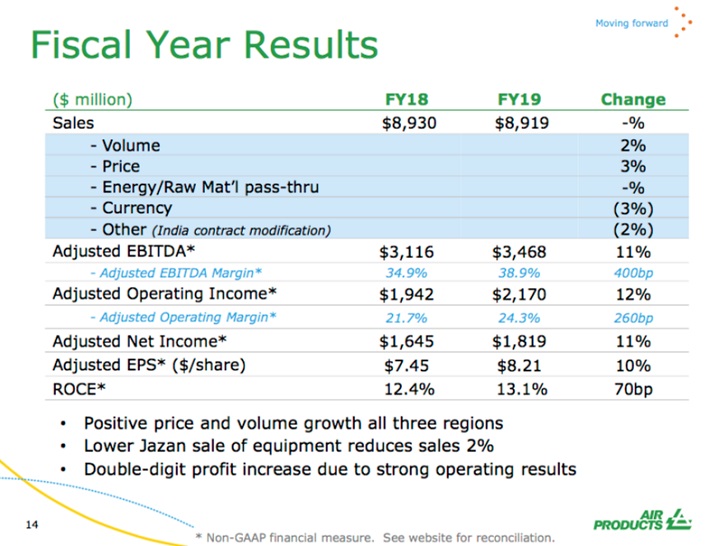
Source: Earnings Release
For the year, sales were down slightly, again related to adverse currency fluctuations and the India contract modification. However, adjusted net income and earnings-per-share were up double-digits, continuing an impressive streak over the past several years.
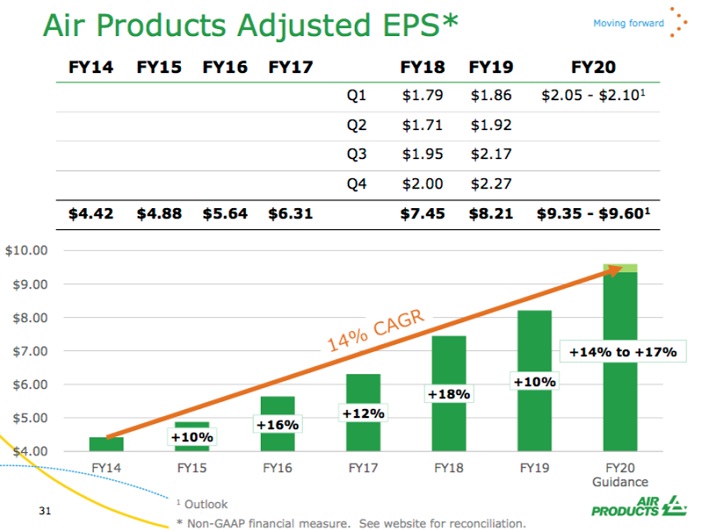
Source: Earnings Release
Since fiscal year 2014, Air Products & Chemicals has grown its adjusted earnings-per-share by a 14% average compound annual growth rate. Moreover, the company anticipates $9.35 to $9.60 in adjusted earnings this year, further enhancing the growth outlook.
Growth Prospects
The streamlining initiatives undertaken by Air Products & Chemicals in the past several years have led to significant profitability improvements for the industrial gas giant. The company’s EBITDA margin trend over the last several years can be seen below:
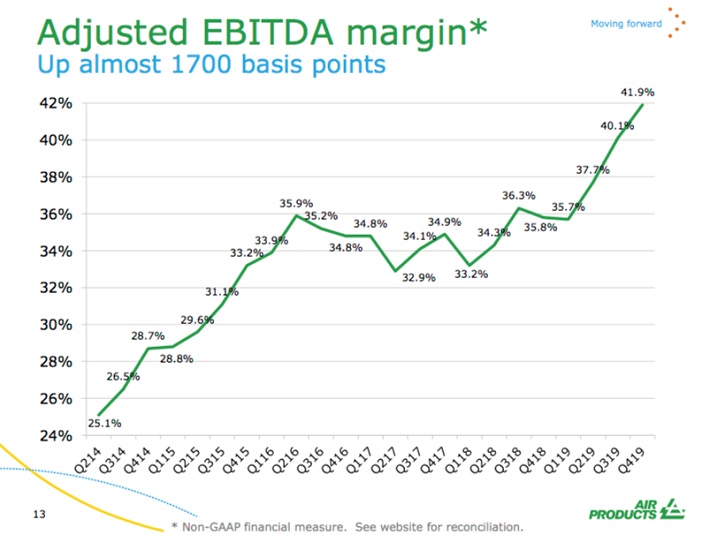
Source: Earnings Release
Air Products & Chemicals has expanded its EBITDA margin by over 1,600 basis points since the second quarter of 2014 – a significant improvement, with exceptional growth coming in the last year. Despite tremendous growth lately, over the longer-term Air Products & Chemicals has grown at a reasonable, but not spectacular pace in the mid-single-digits.
Air Products & Chemicals’ growth over the coming years will be driven by international expansion, as the company’s Gases Asia business has delivered the highest growth rate in the recent past, although its American business remains the largest segment.
Air Products & Chemicals has a number of growth projects either recently completed or scheduled to be completed in the coming months. Some of these investments around the world include building a second liquid hydrogen plant in California, a new air separation unit (ASU) in Minnesota, an ASU plant in India, and helium investments in Algeria. The company was also recently awarded a sixth on-site nitrogen facility in Tianjin, China, to supply a major electronic components manufacturer’s new production line.
In 2019, Air Products & Chemicals announced it will build the first hydrogen fuel cell vehicle fueling station in Saudi Arabia, along with oil giant Saudi Aramco. Air Products & Chemicals has announced several more projects that will come on line through 2022, including a major $3.5 billion joint venture with Yankuang in China, along with numerous other ventures:
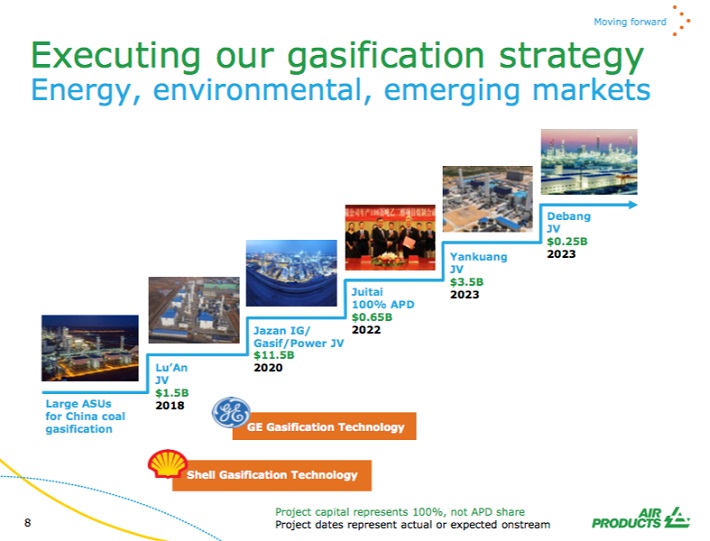
Source: Earnings Release
Overall, we expect 6% annual growth from the firm over the intermediate-term, as a number of promising ventures and a very strong recent history are weighed against the idea of a very large business and the company’s long-term historical average rate of growth.
Competitive Advantages & Recession Performance
Air Products & Chemicals has a number of competitive advantages, the first of which is industry expertise. The company employs a number of chemists and engineers with the technical know-how to successfully deliver projects on time and within budget. It would be difficult for a start-up company to compete with Air Products in the industrial gas distribution sector because of this.
Moreover, the industrial gas distribution business benefits from high switching costs. These costs may not necessarily be financial – instead, customers are unlikely to switch once their gas needs are being met by a particular supplier because it would be difficult to find a competitor that offers identical services in a particular geographic region. To that end, Air Products & Chemicals’ size also benefits the company.
The company’s recent divestitures and asset sales have given it an infusion of cash, bolstering its corporate finances in a way that should help it endure any upcoming economic downturns. Moreover, Air Products & Chemicals has a track record of performing reasonably well during past recessions. Consider the company’s performance during the 2007-2009 financial crisis for evidence of this:
- 2007 adjusted earnings-per-share: $4.40
- 2008 adjusted earnings-per-share: $4.97 (13% increase)
- 2009 adjusted earnings-per-share: $4.06 (18.3% decline)
- 2010 adjusted earnings-per-share: $5.02 (23.6% increase)
Air Products & Chemicals experienced an 18.3% decline in adjusted earnings-per-share in 2009 during the financial crisis, but the company’s bottom line surged to a new high by 2010. We expect a similar level of recession resiliency to be demonstrated during future periods of market turmoil.
Valuation & Expected Total Returns
With a 6% expected growth rate, in addition to a 2.0% (and growing) dividend yield, one might anticipate high single-digit annual returns from the security. However, it is imperative to consider how valuation can impact future returns.
Using $9.48 as the mid-point of Air Products & Chemicals’ fiscal 2020 adjusted earnings-per-share guidance, and a share price of $234, the security is currently trading hands at 24.7 times expected earnings. For context, the stock has traded at an average earnings multiple closer to 18 over the last 10 years.
We believe that 18 times earnings is a fair valuation estimate for Air Products & Chemicals. Mean reversion to a price-to-earnings ratio of 18 could introduce a significant valuation headwind over a 5-year time horizon, so much so that the company’s 6% expected growth rate could be completely offset, and more. As such, today’s investor may stand to only collect the dividend as a form of return, with the expectation of low single-digit total returns.
Granted this could be too conservative if shares were to continue trading with a P/E ratio in the mid-20’s, or if growth formulates faster than anticipated. However, neither of those are items are congruent with a conservative view of the business and the security.
Final Thoughts
Air Products & Chemicals is a strong dividend growth stock, having raised its dividend each year for the past 37 years, including a recent 5.5% increase on January 25th, 2019.
The company has de-risked its business model and that business transformation allows it to focus on its core business of industrial gases. Moreover, it has a large slate of new projects to help stay on track for growth in the coming years. This should benefit shareholders in the form of continued dividend increases on an annual basis.
That said, these positive factors cannot outweigh the significant premium that the market is placing on these shares at the present time. Valuation contraction could reduce Air Products & Chemicals’ expected returns over the next five years significantly. As a result, we recommend investors avoid the stock until a significant decline in the share price brings its valuation back to fair value.