


Updated on November 25th, 2019 by Nate Parsh
Investors looking for high-quality dividend growth stocks would be wise to examine the list of Dividend Aristocrats. These are companies in the S&P 500 Index, with 25+ consecutive years of dividend increases. There are just 57 such companies on this list.
In addition to the full downloadable spreadsheet, you can see a preview of the Dividend Aristocrats list in the table below:
| 3M Co. | 167.60 | 3.4 | 96,378 | 19.6 | 66.4 | 1.08 |
| A. O. Smith Corp. | 48.20 | 1.8 | 6,606 | 19.9 | 36.3 | 0.91 |
| Abbott Laboratories | 83.74 | 1.5 | 148,002 | 45.1 | 68.9 | 1.06 |
| AbbVie, Inc. | 86.05 | 5.0 | 127,252 | 39.5 | 196.3 | 0.88 |
| Aflac, Inc. | 53.99 | 2.0 | 39,629 | 13.3 | 26.3 | 0.71 |
| Air Products & Chemicals, Inc. | 237.60 | 1.9 | 52,356 | 29.8 | 57.4 | 0.81 |
| Archer-Daniels-Midland Co. | 42.72 | 3.2 | 23,781 | 20.2 | 65.5 | 0.81 |
| AT&T, Inc. | 37.75 | 5.4 | 275,763 | 16.9 | 91.0 | 0.61 |
| Automatic Data Processing, Inc. | 169.65 | 1.9 | 73,407 | 31.0 | 57.8 | 1.02 |
| Becton, Dickinson & Co. | 249.89 | 1.2 | 67,458 | 63.0 | 77.7 | 0.99 |
| Brown-Forman Corp. | 67.04 | 1.0 | 32,014 | 39.1 | 38.2 | 0.71 |
| Cardinal Health, Inc. | 55.69 | 3.4 | 16,288 | -4.0 | -13.6 | 0.92 |
| Caterpillar, Inc. | 143.88 | 2.5 | 79,516 | 13.5 | 34.0 | 1.38 |
| Chubb Ltd. | 151.13 | 2.0 | 68,492 | 19.0 | 37.2 | 0.63 |
| Chevron Corp. | 118.63 | 4.0 | 224,313 | 16.9 | 66.8 | 0.85 |
| Cincinnati Financial Corp. | 105.75 | 2.1 | 17,276 | 18.8 | 39.3 | 0.72 |
| Cintas Corp. | 254.09 | 1.0 | 26,298 | 29.2 | 29.3 | 1.01 |
| The Clorox Co. | 146.26 | 2.8 | 18,356 | 22.9 | 63.2 | 0.45 |
| The Coca-Cola Co. | 53.03 | 3.0 | 227,206 | 29.3 | 87.9 | 0.43 |
| Colgate-Palmolive Co. | 66.71 | 2.5 | 57,173 | 24.7 | 62.9 | 0.54 |
| Consolidated Edison, Inc. | 86.19 | 3.4 | 28,652 | 20.3 | 69.0 | 0.24 |
| Dover Corp. | 109.48 | 1.8 | 15,903 | 24.5 | 43.1 | 1.07 |
| Ecolab, Inc. | 182.51 | 1.0 | 52,607 | 34.5 | 34.8 | 0.80 |
| Emerson Electric Co. | 73.66 | 2.7 | 44,870 | 19.7 | 52.3 | 1.17 |
| Exxon Mobil Corp. | 69.37 | 4.9 | 293,512 | 20.2 | 98.5 | 0.92 |
| Federal Realty Investment Trust | 130.34 | 3.2 | 9,925 | 38.7 | 122.1 | 0.52 |
| Franklin Resources, Inc. | 27.32 | 3.8 | 13,607 | 11.6 | 44.1 | 1.11 |
| General Dynamics Corp. | 182.88 | 2.2 | 52,908 | 15.7 | 34.2 | 0.91 |
| Genuine Parts Co. | 103.71 | 2.9 | 15,068 | 19.0 | 55.0 | 0.78 |
| Hormel Foods Corp. | 42.31 | 1.9 | 22,592 | 23.0 | 44.3 | 0.48 |
| Illinois Tool Works, Inc. | 173.56 | 2.3 | 55,783 | 22.8 | 53.3 | 1.20 |
| Johnson & Johnson | 138.07 | 2.7 | 363,382 | 26.0 | 69.7 | 0.61 |
| Kimberly-Clark Corp. | 133.53 | 3.1 | 45,774 | 22.7 | 69.7 | 0.46 |
| Leggett & Platt, Inc. | 52.33 | 3.0 | 6,886 | 23.5 | 70.0 | 1.08 |
| Linde Plc | 204.91 | 1.7 | 110,072 | 21.0 | 35.3 | 0.78 |
| Lowe's Cos., Inc. | 118.20 | 1.7 | 90,777 | 31.2 | 54.4 | 1.04 |
| McCormick & Co., Inc. | 166.91 | 1.3 | 22,184 | 31.4 | 41.9 | 0.40 |
| McDonald's Corp. | 193.14 | 2.4 | 145,452 | 25.1 | 60.3 | 0.43 |
| Medtronic Plc | 110.82 | 1.9 | 148,540 | 31.8 | 59.7 | 0.67 |
| Nucor Corp. | 55.24 | 2.9 | 16,749 | 9.4 | 27.3 | 1.15 |
| People's United Financial, Inc. | 16.30 | 4.3 | 7,239 | 12.4 | 53.6 | 0.96 |
| Pentair Plc | 43.73 | 1.6 | 7,350 | 21.2 | 34.7 | 1.20 |
| PepsiCo, Inc. | 134.07 | 2.8 | 186,951 | 15.2 | 42.7 | 0.53 |
| PPG Industries, Inc. | 125.41 | 1.6 | 29,654 | 24.6 | 38.3 | 0.90 |
| Procter & Gamble Co. | 120.29 | 2.4 | 299,980 | 74.7 | 181.8 | 0.53 |
| Roper Technologies, Inc. | 355.75 | 0.5 | 37,018 | 32.0 | 16.6 | 1.04 |
| S&P Global, Inc. | 265.21 | 0.8 | 64,817 | 31.3 | 26.0 | 0.99 |
| The Sherwin-Williams Co. | 574.83 | 0.7 | 53,061 | 37.9 | 28.0 | 0.87 |
| Stanley Black & Decker, Inc. | 157.28 | 1.7 | 23,908 | 33.8 | 57.3 | 1.53 |
| Sysco Corp. | 79.06 | 2.0 | 40,338 | 23.9 | 47.2 | 0.51 |
| T. Rowe Price Group, Inc. | 121.02 | 2.5 | 28,279 | 15.2 | 37.3 | 1.22 |
| Target Corp. | 127.02 | 2.0 | 64,358 | 20.1 | 41.2 | 0.85 |
| United Technologies Corp. | 147.70 | 2.0 | 127,479 | 24.7 | 49.2 | 1.09 |
| VF Corp. | 86.51 | 2.3 | 34,549 | 26.6 | 60.3 | 1.14 |
| W.W. Grainger, Inc. | 319.00 | 1.8 | 17,183 | 18.5 | 32.5 | 1.07 |
| Walmart, Inc. | 119.36 | 1.8 | 339,493 | 23.7 | 41.9 | 0.61 |
| Walgreens Boots Alliance, Inc. | 60.60 | 2.9 | 54,087 | 14.1 | 41.2 | 1.03 |
| Name | Price | Dividend Yield | Market Cap ($M) | Forward P/E Ratio | Payout Ratio | Beta |
V.F. Corp (VFC) is on the list of Dividend Aristocrats, and has increased its dividend for 47 years in a row.
Not only has V.F. Corp increased its dividend for more than four decades, but it typically raises its dividend at high rates. Adjusting for the spinoff of the company’s jeans businesses, this year’s increase was 11.6%. This follows increases of 10.9% and 9.5% for the previous two years.
While we like the company’s business model and dividend growth track record, we feel that the 18% gain in V.F. Corp shares since our last update has caused the stock to become expensive on a valuation basis. That said, we continue to believe that investors should be encouraged by recent results and be ready to add shares at a lower price.
Business Overview
V.F. Corp is a giant in the apparel industry. The company’s annual sales reach nearly $14 billion, but the company has humble beginnings. It started all the way back in 1899, and has seen many twists and turns in the nearly 120 years since.
The company was first started by John Barbey and a group of investors. Together, they created the Reading Glove and Mitten Manufacturing Company. During the 1960’s, the company adopted its current name, V.F. Corp. It has a highly diverse product portfolio, with many category-leading brands.
The current environment is challenging for V.F. Corp, due to a difficult retail climate. Mall traffic is declining, which has hurt brick-and-mortar retailers, many of which carry V.F. Corp’s products.
Despite the company’s early struggles in this environment, V.F. Corp has seen earnings and revenue growth over the last year. The company reported second quarter fiscal 2020 financial results.
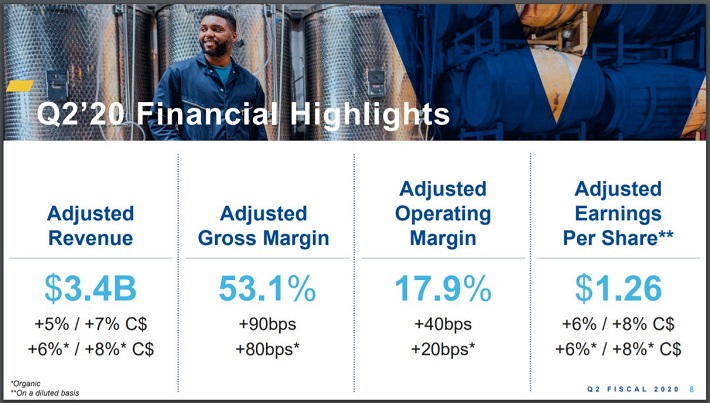
Source: Investor Presentation, slide 8.
Revenue improved 5.4% to $3.4 billion, though this was slightly below what analysts had expected. Adjusted earnings-per-share grew 6% to $1.26. This was $0.04 below estimates. Looking at just continuing operations, revenue was higher by 6% while earnings-per-share grew 12.6% to $1.61.
While the company struggled with earnings-per-share and revenue growth in both 2016 and 2017, V.F. Corp seems to have turned the corner over the two years. The company has topped estimates for both earnings-per-share and revenue growth for the previous six quarters.
V.F. Corp’s top brands were somewhat mixed during the second quarter.
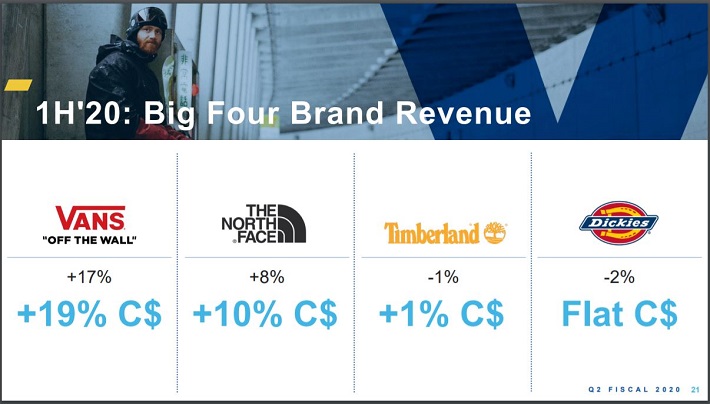
Source: Investor Presentation, slide 21.
Revenues for Vans improved 14% with double-digit growth in footwear, and apparel and accessories. Direct-to-consumer sales were up 17%. All regions saw growth, led by a 15% increase in the U.S. and 28% growth in Asia.
The North Face brand had 8% sales growth, led by strength in all regions. Mountain Lifestyle and Urban Exploration products grew double-digits. Timberland decreased 1% as gains in direct-to-consumer and growth in the U.S. and Asia were more than offset by wholesale declines and lower sales in the Europe/Middle East/Africa regions.
Dickies was down 4%, but without the impact of timing of shipments to the U.S., revenues would have been higher by 6%. Wholesale was lower by 6% during the quarter and only partially offset by a 12% improvement in in direct-to-consumer.
As a group, these four brands were up 7% year-over-year.
Growth Prospects
V.F. Corp has four avenues for future growth, which include acquisitions, divestitures, a renewed focus on core brands, and growth through e-commerce. First, the company completed its $820 million purchase of Williamson-Dickie Manufacturing Co on October 2nd, 2017.
Though V.F Corp’s work segment, which includes Dickies, was lower by 4% during the most recent quarter, we feel that this acquisition should continue to boost growth for the next several years. Sales for this group would have been positive if not for the timing of product shipments.
Second, V.F. Corporation completed its announced spinoff of its Wrangler, Lee and outlet businesses into a separate company called Kontoor Brands, Inc. (KTB) on May 23rd, 2019. Jeans has been a very tough business for V.F. Corp. Removing these under-performing brands will allow V.F. Corp to focus on its core brands.
V.F. Corp expects continued growth across all channels in the first half of the upcoming fiscal year.
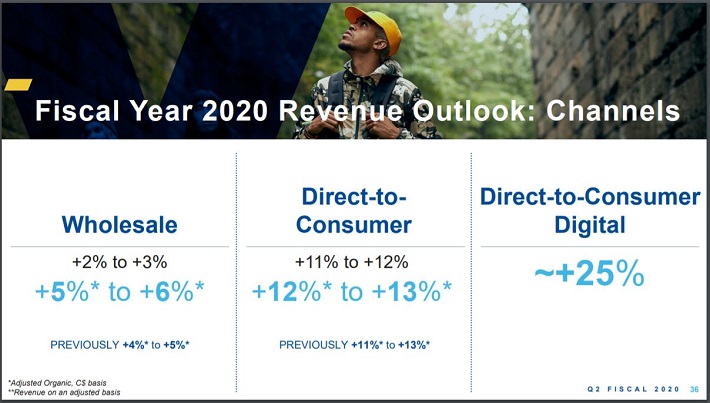
Source: Investor Presentation, slide 36.
The company expects this growth to continue through the end of the fiscal year. In addition to its core brands performing well as a group, V.F. Corp is also posting compelling growth rates for direct-to-consumer (up 11%) and digital sales (up 15%).
These growth rates are very similar to what the company has seen in recent quarters. It took the company some time to adjust to changing behaviors in consumer spending, but V.F. Corp appears to have figured out how to reach customers in an era of online shopping.
V.F. Corp is also showing solid growth rates in region that it operates. Each region had positive growth during the second quarter, led by growth of 14% in Asia and 8% in the U.S.
Competitive Advantages & Recession Performance
There are a few key competitive advantages that have fueled V.F. Corp’s impressive growth for so many years. First, are its strong brands–the company has several billion-dollar brands that lead their respective categories. This gives the company pricing power.
In addition, V.F. Corp benefits from operating in a steady industry. Many of the products V.F. Corp sells—such as workwear–have not changed much (if at all) in the past 100 years.
These qualities help V.F. Corp remain profitable, even during recessions. For example, V.F. Corp kept on raising its dividend through the Great Recession, thanks to its consistent profitability.
The company’s earnings during the Great Recession are below:
- 2007 earnings-per-share of $1.35
- 2008 earnings-per-share of $1.39 (3% increase)
- 2009 earnings-per-share of $1.29 (7% decline)
- 2010 earnings-per-share of $1.61 (25% increase)
V.F. Corp experienced a mild earnings decline in 2009, but returned to strong growth in 2010 and beyond. The company has increased earnings-per-share at a rate of 8.3% over the past ten years. Given its divestitures of weaker businesses, core brands performance and growth across channels, we feel that V.F. Corp should be able to maintain this growth rate going forward.
Valuation & Expected Returns
After second quarter results, V.F. Corp reaffirmed its guidance for the fiscal year. The company expects to earn between $3.32 to $3.37 per share in fiscal 2020. In terms of continuing operations, this would represent growth of 16% to 18%.
Trading near a price of $87, the midpoint of this guidance gives the stock a price-to-earnings ratio of 26. We have a 2024 target valuation of 18x earnings. If shares were to revert to our target average, then annual returns would be reduced by 7.1% over this period of time.
Shares of V.F. Corp have a current dividend yield of 2.3%. Given the new annualized dividend of $1.92 and the company’s earnings-per-share guidance, the payout ratio is 57.3%. The company’s current payout ratio is elevated against its historical average, but still in a very safe range.
- 8.3% earnings-per-share growth
- 7.1% valuation reversion
- 2.3% dividend yield
We expect a total annual return of 3.5% through 2024. This projection is a low rate of return, primarily because of the high valuation of the stock. From a growth and dividend perspective, V.F. Corp. is a great stock. It is simply overvalued at the present time.
Final Thoughts
V.F. Corp has overcome some of the short-term challenges that it faced due to the decline of shopping malls. The company has acquired assets that fit in well with its future plans, and divested those that do not.
The company has also seen impressive growth rates in its core brands, like Vans and The North Face, as well as in the areas of e-commerce. This has V.F. Corp in a strong position for the future.
That being said, our projected total annual return of 3.5% is not attractive enough for us to recommend buying shares of V.F. Corp at the moment. If shares were to pullback, we would strongly recommend that investors consider adding the apparel maker to their portfolio.