


Updated on November 25th, 2019 by Josh Arnold
Each year, we individually review each of the Dividend Aristocrats, a group of 57 companies in the S&P 500 Index with at least 25 consecutive years of dividend increases.
In addition to the full downloadable spreadsheet, you can see a preview of the Dividend Aristocrats list in the table below:
| 3M Co. | 167.60 | 3.4 | 96,378 | 19.6 | 66.4 | 1.08 |
| A. O. Smith Corp. | 48.20 | 1.8 | 6,606 | 19.9 | 36.3 | 0.91 |
| Abbott Laboratories | 83.74 | 1.5 | 148,002 | 45.1 | 68.9 | 1.06 |
| AbbVie, Inc. | 86.05 | 5.0 | 127,252 | 39.5 | 196.3 | 0.88 |
| Aflac, Inc. | 53.99 | 2.0 | 39,629 | 13.3 | 26.3 | 0.71 |
| Air Products & Chemicals, Inc. | 237.60 | 1.9 | 52,356 | 29.8 | 57.4 | 0.81 |
| Archer-Daniels-Midland Co. | 42.72 | 3.2 | 23,781 | 20.2 | 65.5 | 0.81 |
| AT&T, Inc. | 37.75 | 5.4 | 275,763 | 16.9 | 91.0 | 0.61 |
| Automatic Data Processing, Inc. | 169.65 | 1.9 | 73,407 | 31.0 | 57.8 | 1.02 |
| Becton, Dickinson & Co. | 249.89 | 1.2 | 67,458 | 63.0 | 77.7 | 0.99 |
| Brown-Forman Corp. | 67.04 | 1.0 | 32,014 | 39.1 | 38.2 | 0.71 |
| Cardinal Health, Inc. | 55.69 | 3.4 | 16,288 | -4.0 | -13.6 | 0.92 |
| Caterpillar, Inc. | 143.88 | 2.5 | 79,516 | 13.5 | 34.0 | 1.38 |
| Chubb Ltd. | 151.13 | 2.0 | 68,492 | 19.0 | 37.2 | 0.63 |
| Chevron Corp. | 118.63 | 4.0 | 224,313 | 16.9 | 66.8 | 0.85 |
| Cincinnati Financial Corp. | 105.75 | 2.1 | 17,276 | 18.8 | 39.3 | 0.72 |
| Cintas Corp. | 254.09 | 1.0 | 26,298 | 29.2 | 29.3 | 1.01 |
| The Clorox Co. | 146.26 | 2.8 | 18,356 | 22.9 | 63.2 | 0.45 |
| The Coca-Cola Co. | 53.03 | 3.0 | 227,206 | 29.3 | 87.9 | 0.43 |
| Colgate-Palmolive Co. | 66.71 | 2.5 | 57,173 | 24.7 | 62.9 | 0.54 |
| Consolidated Edison, Inc. | 86.19 | 3.4 | 28,652 | 20.3 | 69.0 | 0.24 |
| Dover Corp. | 109.48 | 1.8 | 15,903 | 24.5 | 43.1 | 1.07 |
| Ecolab, Inc. | 182.51 | 1.0 | 52,607 | 34.5 | 34.8 | 0.80 |
| Emerson Electric Co. | 73.66 | 2.7 | 44,870 | 19.7 | 52.3 | 1.17 |
| Exxon Mobil Corp. | 69.37 | 4.9 | 293,512 | 20.2 | 98.5 | 0.92 |
| Federal Realty Investment Trust | 130.34 | 3.2 | 9,925 | 38.7 | 122.1 | 0.52 |
| Franklin Resources, Inc. | 27.32 | 3.8 | 13,607 | 11.6 | 44.1 | 1.11 |
| General Dynamics Corp. | 182.88 | 2.2 | 52,908 | 15.7 | 34.2 | 0.91 |
| Genuine Parts Co. | 103.71 | 2.9 | 15,068 | 19.0 | 55.0 | 0.78 |
| Hormel Foods Corp. | 42.31 | 1.9 | 22,592 | 23.0 | 44.3 | 0.48 |
| Illinois Tool Works, Inc. | 173.56 | 2.3 | 55,783 | 22.8 | 53.3 | 1.20 |
| Johnson & Johnson | 138.07 | 2.7 | 363,382 | 26.0 | 69.7 | 0.61 |
| Kimberly-Clark Corp. | 133.53 | 3.1 | 45,774 | 22.7 | 69.7 | 0.46 |
| Leggett & Platt, Inc. | 52.33 | 3.0 | 6,886 | 23.5 | 70.0 | 1.08 |
| Linde Plc | 204.91 | 1.7 | 110,072 | 21.0 | 35.3 | 0.78 |
| Lowe's Cos., Inc. | 118.20 | 1.7 | 90,777 | 31.2 | 54.4 | 1.04 |
| McCormick & Co., Inc. | 166.91 | 1.3 | 22,184 | 31.4 | 41.9 | 0.40 |
| McDonald's Corp. | 193.14 | 2.4 | 145,452 | 25.1 | 60.3 | 0.43 |
| Medtronic Plc | 110.82 | 1.9 | 148,540 | 31.8 | 59.7 | 0.67 |
| Nucor Corp. | 55.24 | 2.9 | 16,749 | 9.4 | 27.3 | 1.15 |
| People's United Financial, Inc. | 16.30 | 4.3 | 7,239 | 12.4 | 53.6 | 0.96 |
| Pentair Plc | 43.73 | 1.6 | 7,350 | 21.2 | 34.7 | 1.20 |
| PepsiCo, Inc. | 134.07 | 2.8 | 186,951 | 15.2 | 42.7 | 0.53 |
| PPG Industries, Inc. | 125.41 | 1.6 | 29,654 | 24.6 | 38.3 | 0.90 |
| Procter & Gamble Co. | 120.29 | 2.4 | 299,980 | 74.7 | 181.8 | 0.53 |
| Roper Technologies, Inc. | 355.75 | 0.5 | 37,018 | 32.0 | 16.6 | 1.04 |
| S&P Global, Inc. | 265.21 | 0.8 | 64,817 | 31.3 | 26.0 | 0.99 |
| The Sherwin-Williams Co. | 574.83 | 0.7 | 53,061 | 37.9 | 28.0 | 0.87 |
| Stanley Black & Decker, Inc. | 157.28 | 1.7 | 23,908 | 33.8 | 57.3 | 1.53 |
| Sysco Corp. | 79.06 | 2.0 | 40,338 | 23.9 | 47.2 | 0.51 |
| T. Rowe Price Group, Inc. | 121.02 | 2.5 | 28,279 | 15.2 | 37.3 | 1.22 |
| Target Corp. | 127.02 | 2.0 | 64,358 | 20.1 | 41.2 | 0.85 |
| United Technologies Corp. | 147.70 | 2.0 | 127,479 | 24.7 | 49.2 | 1.09 |
| VF Corp. | 86.51 | 2.3 | 34,549 | 26.6 | 60.3 | 1.14 |
| W.W. Grainger, Inc. | 319.00 | 1.8 | 17,183 | 18.5 | 32.5 | 1.07 |
| Walmart, Inc. | 119.36 | 1.8 | 339,493 | 23.7 | 41.9 | 0.61 |
| Walgreens Boots Alliance, Inc. | 60.60 | 2.9 | 54,087 | 14.1 | 41.2 | 1.03 |
| Name | Price | Dividend Yield | Market Cap ($M) | Forward P/E Ratio | Payout Ratio | Beta |
Next in the series is People’s United Financial (PBCT). People’s most recent dividend increase was its 27th consecutive annual increase, making it one of the newer Dividend Aristocrats. However, for a bank, that is a very strong accomplishment.
People’s has a strong history of dividend growth, particularly for the highly cyclical financial sector, which saw many of even its largest constituents cut their dividends during the financial crisis. That wasn’t the case for People’s. In fact, the company continued to increase its dividend each year during the Great Recession.
People’s not only has an impressive streak of dividends, but a very high current yield as well. At a time when both the S&P 500 and the financial sector both have yields just under 2%, People’s is sporting a 4.4% yield, making it very attractive to those seeking current income.
Business Overview
People’s was founded in 1842 in Bridgeport, Connecticut. The bank began operations with just $97 in total deposits and had no paid employees for its first 10 years of operations. In the 177 years since that humble beginning, People’s has grown into a regional bank with more than 5,000 employees and almost 400 retail locations in the Northeast United States.
Today, People’s produces $1.85 billion in annual revenue from its $52 billion in total assets, and the stock has a market capitalization of $7.1 billion.
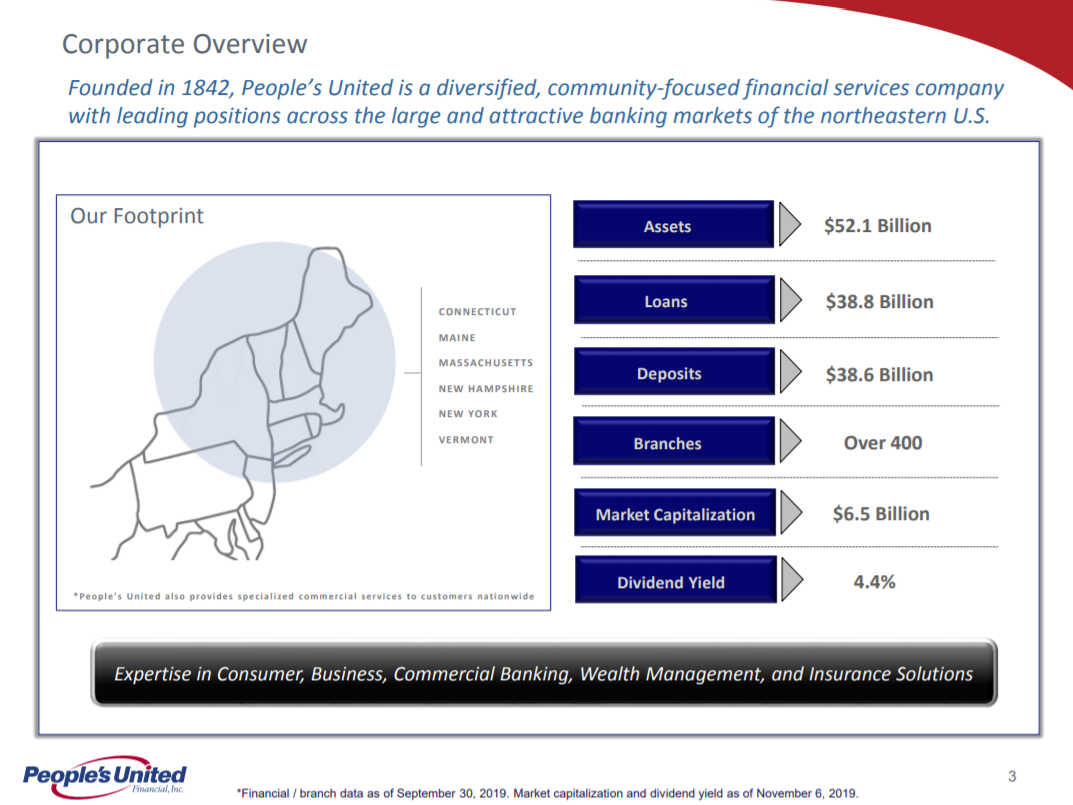
Source: Investor presentation, page 3
The bank has boosted its total assets to $52 billion, of which $38.8 billion is comprised of loans. People’s has acquired its way to a footprint that covers six states in the Northeast US over time.
People’s reported third quarter earnings on October 17th and results were somewhat mixed. Net income came to $0.33 per share as net interest income was essentially flat against this year’s Q2. Net interest margin was unchanged at 3.12%, as small moves in loan yields and deposit costs offset. Noninterest income was flat against Q2 as well, while noninterest expense rose about 1% due to higher compensation expense.
People’s loan balance at the end of Q3 was $38.8 billion against deposits of $38.5 billion. In other words, People’s has lent out more than it has collected in deposits, for a loan-to-deposit ratio of just over 100%. Essentially, the loan-to deposit ratio is a measure of leverage, and People’s is very high. It crimps future growth potential simply because there isn’t much more the bank can do to boost it from very high levels, so this is not a lever the bank can pull to boost revenue growth going forward. It also increases potential risk, as high levels of leverage naturally results in higher loan risks.
Asset quality, however, is outstanding and affords People’s the ability to have all of its deposits lent out.
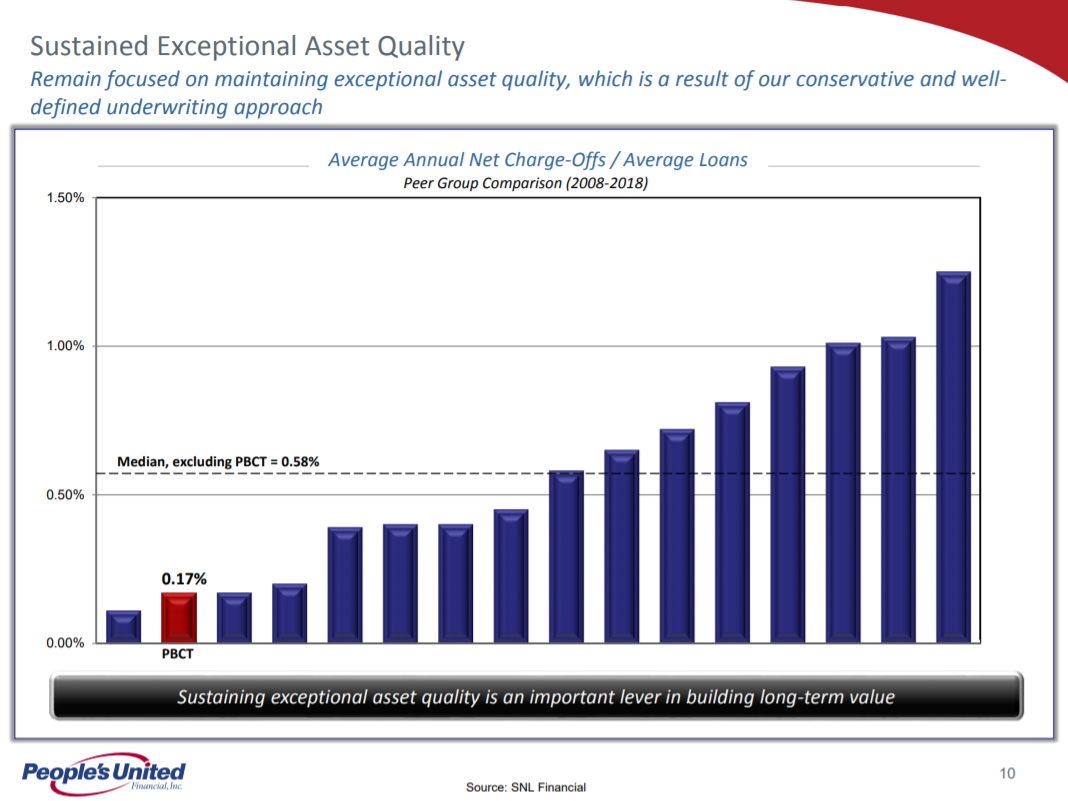
Source: Investor presentation, page 10
People’s has enjoyed class-leading asset quality over the years, and that continues today. Annualized net charge-offs in the past decade have been just 0.17%, which is well below most of its peers and the class average. This outstanding asset quality means that it has the ability to lend out all of its deposits without fear of high levels of losses.
This year’s earnings-per-share should be roughly in line with 2018 levels, at $1.33. Last year saw a sizable benefit from tax reform. This year, People’s is seeing higher integration costs from its near-constant stream of acquisitions that will temporarily raise costs. However, the bank has delivered consistent growth over the long-term and we believe it will continue to do so in the coming years.
Growth Prospects
While People’s produces a small amount of organic growth – as just about any other bank would – its strategy instead focuses on acquiring its growth. It has a diversified portfolio of financial services it can offer to customers, but its bread and butter is still core deposit-taking and lending activities.
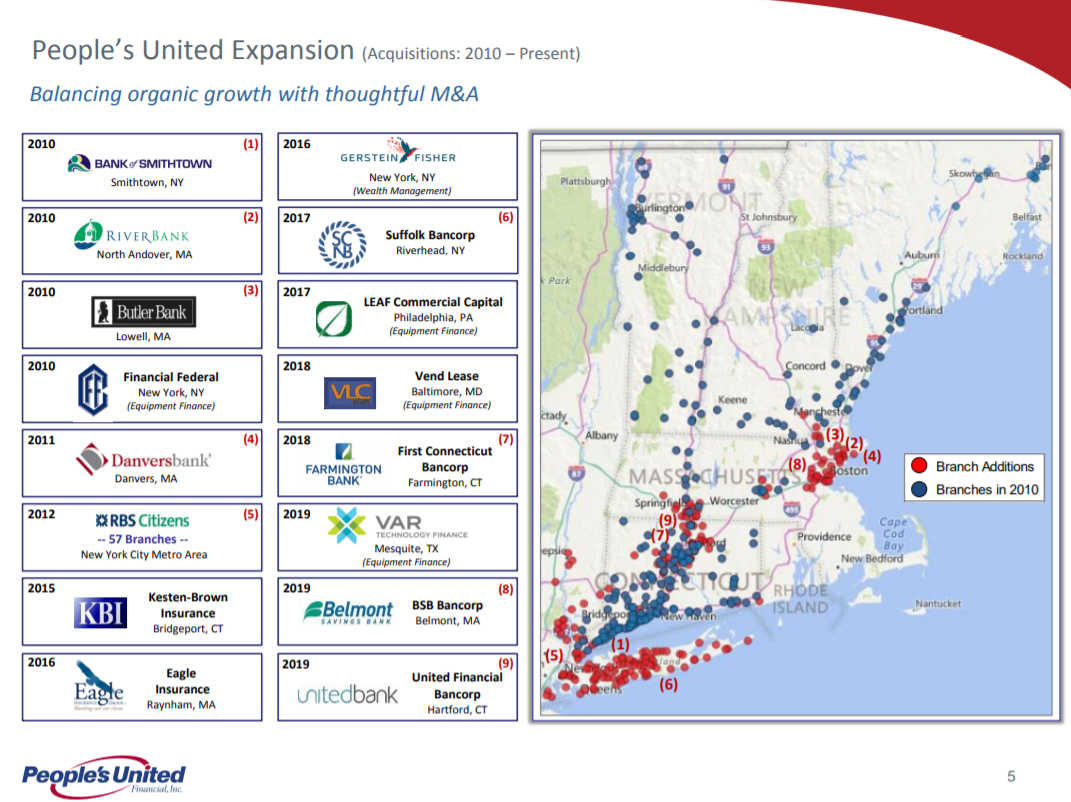
Source: Investor presentation, page 5
Above we can see the myriad acquisitions the bank has made in the past decade, totaling 16 different acquisitions of varying size in that time frame. This has helped People’s bolster its organic branch growth, and as mentioned, earnings have grown steadily over time.
We see People’s producing 5% earnings-per-share growth annually over full economic cycles given that its growth-by-acquisition strategy is lumpy and unpredictable, but also because People’s is subject to the same risks as other banks.
In other words, with the yield curve flattening out significantly in recent quarters, organic growth of earnings is tough to come by for all banks, People’s included. In addition, since it issues stock for acquisitions, its share count rose over time, introducing a significant headwind for earnings-per-share even if earnings grow. This was the case in Q3 again, as earnings grew slightly but were basically offset by a similar rise in the share count.
Still, we see the bank as a strong operator and one that focuses heavily on cost savings, so we think it has some meaningful growth in front of it, particularly once its 2019 slate of acquisitions is fully integrated.
Competitive Advantages & Recession Performance
Competitive advantages are difficult to come by for banks given that they largely offer the same products and services as their competitors. However, one way to offer an advantage is to grow scale in key markets, and that is exactly what People’s is doing with Boston as an example.
Growing scale and name recognition in key markets like that can help drive efficiency and scale, which is part of the reason why People’s has been able to boost margins in recent quarters, despite the flattening yield curve. This key strategic pillar is a differentiator and we think it will serve People’s well in the coming years.
However, that certainly does not insulate People’s from economic downturns. Its performance during the Great Recession was not spectacular, but it did fare much better than many of its larger competitors in the banking industry. People’s earnings-per-share during the Great Recession are below:
- 2007 earnings-per-share of $0.52
- 2008 earnings-per-share of $0.42 (19% decline)
- 2009 earnings-per-share of $0.30 (29% decline)
- 2010 earnings-per-share of $0.24 (20% decline)
While People’s remained profitable throughout, the damage was significant. Indeed, it was 2011 before People’s earnings-per-share crested its pre-recession high, hitting $0.57 in that year to top 2007’s level of $0.52. Growth has been robust since that time, however, and the company is expected to generate earnings-per-share of $1.33 this year.
Valuation & Expected Returns
People’s has a current price-to-earnings ratio of 12.2 based on our estimate of $1.33 of earnings-per-share for this year. This is slightly lower than our fair value estimate of 13 times earnings, so we see People’s as somewhat undervalued after recent weakness in the stock.
Thus, People’s offers decent value at current prices. Should the stock revert to our estimate of fair value, it would provide a ~1% annual tailwind to total returns for shareholders.
In addition, we see earnings-per-share growth at 5% annually. Combined with valuation changes and the current 4.4% yield, total annual returns are expected to reach approximately 10%. This is a high expected rate of return, which earns a buy recommendation, particularly for income investors interested in the high current yield.
The payout ratio is also just over half of earnings after years of slow payout growth. This was necessary as People’s payout ratio had previously exceeded earnings, but it is in a much better spot now. Keep in mind that all-stock acquisitions make the dividend costlier even if it isn’t raised on a per-share basis, meaning growth will likely be muted. We are forecasting low-single-digit growth in the payout in the coming years for this reason.
Final Thoughts
People’s has an attractive dividend yield above 4%, and growth potential for the years ahead. The bank is not immune from economic downturns, and a flat yield curve is a risk. However, People’s has proven to be adept at finding and acquiring growth in its key markets, and we have no reason to believe that won’t continue.
People’s is an appealing stock for its decent valuation, strong competitive position in key markets in the Northeast, and its 4%+ yield. For these reasons, we continue to rate People’s a buy.