


Updated on November 22nd, 2019 by Nate Parsh
Each year, we publish an in-depth look at each of the 57 Dividend Aristocrats , an exclusive list of stocks in the S&P 500 Index, with 25+ years of consecutive dividend increases.
In addition to the full downloadable spreadsheet, you can see a preview of the Dividend Aristocrats list in the table below:
| 3M Co. | 165.49 | 3.4 | 94,963 | 19.3 | 66.4 | 1.07 |
| A. O. Smith Corp. | 48.21 | 1.8 | 6,640 | 19.9 | 36.3 | 0.91 |
| Abbott Laboratories | 83.19 | 1.5 | 147,896 | 44.8 | 68.9 | 1.06 |
| AbbVie, Inc. | 86.02 | 4.9 | 127,947 | 39.5 | 196.3 | 0.88 |
| Aflac, Inc. | 53.88 | 2.0 | 39,541 | 13.2 | 26.3 | 0.71 |
| Air Products & Chemicals, Inc. | 237.41 | 1.9 | 52,365 | 29.8 | 57.4 | 0.81 |
| Archer-Daniels-Midland Co. | 42.71 | 3.2 | 23,837 | 20.2 | 65.5 | 0.81 |
| AT&T, Inc. | 37.81 | 5.4 | 274,668 | 16.9 | 91.0 | 0.61 |
| Automatic Data Processing, Inc. | 170.58 | 1.9 | 73,498 | 31.2 | 57.8 | 1.02 |
| Becton, Dickinson & Co. | 249.23 | 1.2 | 67,207 | 62.9 | 77.7 | 0.99 |
| Brown-Forman Corp. | 67.28 | 1.0 | 32,109 | 39.2 | 38.2 | 0.71 |
| Cardinal Health, Inc. | 55.43 | 3.5 | 16,136 | -4.0 | -13.6 | 0.92 |
| Caterpillar, Inc. | 143.41 | 2.5 | 79,229 | 13.5 | 34.0 | 1.38 |
| Chubb Ltd. | 150.57 | 2.0 | 67,966 | 18.9 | 37.2 | 0.63 |
| Chevron Corp. | 119.30 | 3.9 | 224,578 | 17.0 | 66.8 | 0.85 |
| Cincinnati Financial Corp. | 106.39 | 2.1 | 17,332 | 18.9 | 39.3 | 0.72 |
| Cintas Corp. | 256.13 | 1.0 | 26,250 | 29.4 | 29.3 | 1.01 |
| The Clorox Co. | 144.93 | 2.8 | 18,200 | 22.7 | 63.2 | 0.45 |
| The Coca-Cola Co. | 52.92 | 3.0 | 226,906 | 29.3 | 87.9 | 0.43 |
| Colgate-Palmolive Co. | 66.61 | 2.5 | 57,207 | 24.7 | 62.9 | 0.54 |
| Consolidated Edison, Inc. | 86.59 | 3.4 | 28,861 | 20.3 | 69.0 | 0.24 |
| Dover Corp. | 109.39 | 1.8 | 15,848 | 24.4 | 43.1 | 1.07 |
| Ecolab, Inc. | 182.96 | 1.0 | 52,754 | 34.6 | 34.8 | 0.80 |
| Emerson Electric Co. | 73.42 | 2.7 | 44,809 | 19.6 | 52.3 | 1.17 |
| Exxon Mobil Corp. | 69.60 | 4.9 | 294,781 | 20.3 | 98.5 | 0.92 |
| Federal Realty Investment Trust | 130.06 | 3.2 | 9,904 | 38.6 | 122.1 | 0.52 |
| Franklin Resources, Inc. | 27.40 | 3.8 | 13,572 | 11.6 | 44.1 | 1.11 |
| General Dynamics Corp. | 182.95 | 2.2 | 52,928 | 15.7 | 34.2 | 0.91 |
| Genuine Parts Co. | 102.82 | 2.9 | 14,901 | 18.8 | 55.0 | 0.78 |
| Hormel Foods Corp. | 42.76 | 1.9 | 22,811 | 23.2 | 44.3 | 0.48 |
| Illinois Tool Works, Inc. | 172.87 | 2.4 | 55,481 | 22.7 | 53.3 | 1.20 |
| Johnson & Johnson | 137.13 | 2.7 | 359,092 | 25.8 | 69.7 | 0.61 |
| Kimberly-Clark Corp. | 132.84 | 3.1 | 45,716 | 22.6 | 69.7 | 0.46 |
| Leggett & Platt, Inc. | 52.19 | 3.0 | 6,845 | 23.4 | 70.0 | 1.08 |
| Linde Plc | 205.03 | 1.7 | 110,797 | 21.0 | 35.3 | 0.78 |
| Lowe's Cos., Inc. | 117.62 | 1.8 | 89,871 | 31.1 | 54.4 | 1.04 |
| McCormick & Co., Inc. | 166.09 | 1.3 | 22,120 | 31.2 | 41.9 | 0.39 |
| McDonald's Corp. | 192.98 | 2.4 | 144,857 | 25.1 | 60.3 | 0.43 |
| Medtronic Plc | 111.28 | 1.9 | 148,098 | 32.0 | 59.7 | 0.67 |
| Nucor Corp. | 54.71 | 2.9 | 16,446 | 9.3 | 27.3 | 1.15 |
| People's United Financial, Inc. | 16.29 | 4.3 | 7,203 | 12.4 | 53.6 | 0.96 |
| Pentair Plc | 43.36 | 1.6 | 7,288 | 21.1 | 34.7 | 1.20 |
| PepsiCo, Inc. | 134.03 | 2.8 | 186,728 | 15.2 | 42.7 | 0.53 |
| PPG Industries, Inc. | 125.43 | 1.6 | 29,718 | 24.6 | 38.3 | 0.91 |
| Procter & Gamble Co. | 119.98 | 2.4 | 300,105 | 74.5 | 181.8 | 0.53 |
| Roper Technologies, Inc. | 352.90 | 0.5 | 36,838 | 31.7 | 16.6 | 1.04 |
| S&P Global, Inc. | 267.53 | 0.8 | 64,616 | 31.5 | 26.0 | 0.99 |
| The Sherwin-Williams Co. | 570.17 | 0.7 | 52,483 | 37.6 | 28.0 | 0.87 |
| Stanley Black & Decker, Inc. | 155.19 | 1.7 | 23,575 | 33.3 | 57.3 | 1.52 |
| Sysco Corp. | 79.32 | 2.0 | 40,420 | 24.0 | 47.2 | 0.51 |
| T. Rowe Price Group, Inc. | 120.67 | 2.5 | 28,048 | 15.1 | 37.3 | 1.22 |
| Target Corp. | 127.68 | 2.0 | 65,220 | 20.2 | 41.2 | 0.85 |
| United Technologies Corp. | 147.98 | 2.0 | 127,134 | 24.8 | 49.2 | 1.09 |
| VF Corp. | 85.22 | 2.3 | 33,866 | 26.2 | 60.3 | 1.14 |
| W.W. Grainger, Inc. | 316.50 | 1.8 | 16,840 | 18.4 | 32.5 | 1.07 |
| Walmart, Inc. | 119.96 | 1.8 | 340,915 | 23.8 | 41.9 | 0.61 |
| Walgreens Boots Alliance, Inc. | 61.11 | 2.9 | 54,105 | 14.2 | 41.2 | 1.03 |
| Certain securities may be excluded due to data limitations | ||||||
| Name | Price | Dividend Yield | Market Cap ($M) | Forward P/E Ratio | Payout Ratio | Beta |
Up next in our annual series is S&P Global (SPGI).
S&P Global has a very impressive dividend track record. It has paid a dividend each year since 1937. And, S&P Global has increased its dividend for 46 years in a row. According to the company, it is one of fewer than 25 companies in the S&P 500, that has increased its dividend for at least 46 consecutive years.
This article will take a closer look at S&P Global, and what makes it such a high-quality dividend growth stock.
Business Overview
S&P Global traces its roots back to 1917, when McGraw Publishing Company and the Hill Publishing Company came together. The company was first named McGraw Hill Financial. In 1957, McGraw Hill introduced the S&P 500, the most widely-recognized index of all large-cap U.S. stocks.
S&P Global offers financial services, including credit ratings, benchmarks, analytics, and data, to the global capital and commodity markets. It derives revenue from four operating segments: Ratings, Market Intelligence, Platts, and S&P Dow Jones Indices. S&P Global has a highly profitable business model. It is the industry leader in credit ratings and stock market indexes, which provide it with high profit margins and growth opportunities.
S&P Global has a very strong business model. The company has generated impressive growth rates over the past several years.

Source: Investor Presentation, slide 7.
Today, the S&P 500 is arguably the most widely-known stock market index in the world. The company generates more than $6 billion in annual revenue, with 20,000 employees. The company has a current market cap of more than $65 billion.
S&P Global’s business performed very well during the third quarter (10/29/2019).
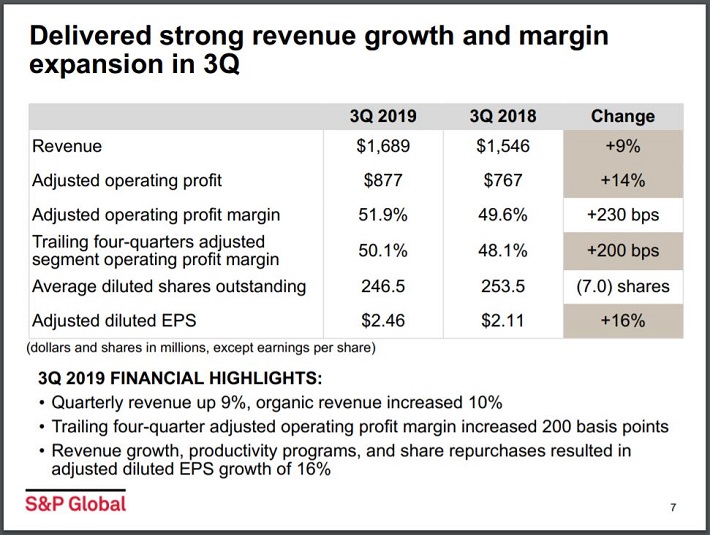
Source: Investor Presentation, slide 7
The company had earnings-per-share of $2.46, which was a 16% improvement from the same quarter the previous year. This result also beat estimates by $0.12. The company managed this improvement despite a 30 bps increase in effective tax rate. Revenue increased 9% to $1.69 billion, topping estimates by $38 million. Along with strong earnings and revenue growth, S&P Global’s operating profit margins expanded by more than 7% year-over-year.
Growth Prospects
S&P Global has significant catalysts for future growth. The global economy continues to expand, which fuels greater demand for financial analysis and debt ratings. This is all crucial information for investors. As a result, ratings revenue continues to rise at a steady pace, and took only a modest dip during the Great Recession.
Through the first three quarters of 2019, S&P Global’s adjusted earnings-per-share has increased 11.5% from the previous year while revenues have improved 4.9%. S&P Global repurchased $500 million worth of shares during the quarter while distributing $140 million in dividends.
Ratings revenue increased 13% due to improvements in high-yield issuance in the U.S. and Europe. Transaction revenue increased 25% on higher debt rating activity and bank loan activity. Revenue for Market Intelligence was up 5% due to gains in Data Management Solutions, Credit Risk Solutions and Desktop products. Platts revenue improved 4% due to growth in subscriptions and Global Trading Services.
Lastly, S&P Dow Jones Indices revenue increased 14% in the third quarter, due to a 17% increase in asset-linked fees. This primarily includes revenue from exchange-traded funds. Assets under management associated with S&P Global’s indexes climbed 5% for the quarter.
For 2019, S&P Global raised its expectations for adjusted earnings-per-share of to a range of $9.30 to $9.40, up from $9.10 to $9.25 previously. We expect annual earnings-per-share growth of 10% through 2024.
Competitive Advantages & Recession Performance
S&P Global enjoys multiple competitive advantages. First, it operates in a highly concentrated industry. It is one of only three major credit ratings agencies in the U.S., along with Moody’s (MCO) and Fitch Ratings.
Put together, these three companies control over 90% of the global financial debt rating industry, with S&P Global on top. And, there are high barriers to entry. Specifically, becoming an accepted rating agency would require a great deal of trust from the financial industry and government that is hard to build quickly, if at all.
Clients pay S&P Global hefty sums for investment research, as S&P Global has built a strong reputation over its many decades of business. These competitive advantages helped the company remain consistently profitable throughout the Great Recession:
- 2007 earnings-per-share of $2.94
- 2008 earnings-per-share of $2.51 (15% decline)
- 2009 earnings-per-share of $2.33 (7% decline)
- 2010 earnings-per-share of $2.65 (14% increase)
S&P Global’s earnings declined in 2008 and 2009, as investors should expect the company to struggle during recessions. A global recession will naturally result in lower demand for financial services, as investors exit the markets. That said, S&P Global quickly bounced back after the recession ended. By 2011, earnings-per-share had hit a new post-recession high.
Valuation & Expected Returns
S&P Global currently trades at ~$264 per share. Using the company’s adjusted earnings-per-share guidance for the year of $9.35, the stock has a price-to earnings ratio of 28.2. This is higher than the stock’s five-year average price-to-earnings ratio of 21.3. If shares were to retreat to this valuation by 2024, investors would see a reduction in annual returns of 5.5%.
A potential bull-case breakdown of future returns is as follows:
- 10% adjusted earnings-per-share growth
- 0.9% dividend yield
- 5.5% multiple reversion
We expect that S&P Global can offer a total return of 5.4% per year through 2024. The stock is down just 3% from its 52-week high. Currently, S&P Global offers a dividend yield that is almost half that of the S&P 500. As a result, SPGI stock is not particularly appealing from a value or income perspective.
Final Thoughts
S&P Global is a strong business, with a long runway of growth up ahead. There will always be a need for financial ratings services. And, future growth potential is strong in new areas like data and financial technology. S&P Global’s acquisitions will accelerate its growth in these segments.
The dividend yield of 0.9% might not be attractive to income investors, but dividend growth investors should view the stock favorably. The company has increased its dividend by 10% per year over the past five years. S&P Global announced a 14% dividend increase last February. The expected payout ratio for 2019 is under 25%, meaning the current payout is safe and there is plenty of room for future increases.
That said, shares are expensive relative to the historical average, earning S&P Global’s stock a hold recommendation at the current price.