


Updated on November 22nd, 2019 by Josh Arnold
Sherwin-Williams (SHW) is a legendary dividend growth stock.
As a member of the Dividend Aristocrats, Sherwin-Williams is one of just 57 S&P 500 stocks that have raised their dividends each year for 25+ years. Sherwin-Williams has manged to grow its dividend for 41 consecutive years, putting it in very rare company when it comes to raising payouts to shareholders.
In addition to the full downloadable spreadsheet, you can see a preview of the Dividend Aristocrats list in the table below:
| 3M Co. | 165.49 | 3.4 | 94,963 | 19.3 | 66.4 | 1.07 |
| A. O. Smith Corp. | 48.21 | 1.8 | 6,640 | 19.9 | 36.3 | 0.91 |
| Abbott Laboratories | 83.19 | 1.5 | 147,896 | 44.8 | 68.9 | 1.06 |
| AbbVie, Inc. | 86.02 | 4.9 | 127,947 | 39.5 | 196.3 | 0.88 |
| Aflac, Inc. | 53.88 | 2.0 | 39,541 | 13.2 | 26.3 | 0.71 |
| Air Products & Chemicals, Inc. | 237.41 | 1.9 | 52,365 | 29.8 | 57.4 | 0.81 |
| Archer-Daniels-Midland Co. | 42.71 | 3.2 | 23,837 | 20.2 | 65.5 | 0.81 |
| AT&T, Inc. | 37.81 | 5.4 | 274,668 | 16.9 | 91.0 | 0.61 |
| Automatic Data Processing, Inc. | 170.58 | 1.9 | 73,498 | 31.2 | 57.8 | 1.02 |
| Becton, Dickinson & Co. | 249.23 | 1.2 | 67,207 | 62.9 | 77.7 | 0.99 |
| Brown-Forman Corp. | 67.28 | 1.0 | 32,109 | 39.2 | 38.2 | 0.71 |
| Cardinal Health, Inc. | 55.43 | 3.5 | 16,136 | -4.0 | -13.6 | 0.92 |
| Caterpillar, Inc. | 143.41 | 2.5 | 79,229 | 13.5 | 34.0 | 1.38 |
| Chubb Ltd. | 150.57 | 2.0 | 67,966 | 18.9 | 37.2 | 0.63 |
| Chevron Corp. | 119.30 | 3.9 | 224,578 | 17.0 | 66.8 | 0.85 |
| Cincinnati Financial Corp. | 106.39 | 2.1 | 17,332 | 18.9 | 39.3 | 0.72 |
| Cintas Corp. | 256.13 | 1.0 | 26,250 | 29.4 | 29.3 | 1.01 |
| The Clorox Co. | 144.93 | 2.8 | 18,200 | 22.7 | 63.2 | 0.45 |
| The Coca-Cola Co. | 52.92 | 3.0 | 226,906 | 29.3 | 87.9 | 0.43 |
| Colgate-Palmolive Co. | 66.61 | 2.5 | 57,207 | 24.7 | 62.9 | 0.54 |
| Consolidated Edison, Inc. | 86.59 | 3.4 | 28,861 | 20.3 | 69.0 | 0.24 |
| Dover Corp. | 109.39 | 1.8 | 15,848 | 24.4 | 43.1 | 1.07 |
| Ecolab, Inc. | 182.96 | 1.0 | 52,754 | 34.6 | 34.8 | 0.80 |
| Emerson Electric Co. | 73.42 | 2.7 | 44,809 | 19.6 | 52.3 | 1.17 |
| Exxon Mobil Corp. | 69.60 | 4.9 | 294,781 | 20.3 | 98.5 | 0.92 |
| Federal Realty Investment Trust | 130.06 | 3.2 | 9,904 | 38.6 | 122.1 | 0.52 |
| Franklin Resources, Inc. | 27.40 | 3.8 | 13,572 | 11.6 | 44.1 | 1.11 |
| General Dynamics Corp. | 182.95 | 2.2 | 52,928 | 15.7 | 34.2 | 0.91 |
| Genuine Parts Co. | 102.82 | 2.9 | 14,901 | 18.8 | 55.0 | 0.78 |
| Hormel Foods Corp. | 42.76 | 1.9 | 22,811 | 23.2 | 44.3 | 0.48 |
| Illinois Tool Works, Inc. | 172.87 | 2.4 | 55,481 | 22.7 | 53.3 | 1.20 |
| Johnson & Johnson | 137.13 | 2.7 | 359,092 | 25.8 | 69.7 | 0.61 |
| Kimberly-Clark Corp. | 132.84 | 3.1 | 45,716 | 22.6 | 69.7 | 0.46 |
| Leggett & Platt, Inc. | 52.19 | 3.0 | 6,845 | 23.4 | 70.0 | 1.08 |
| Linde Plc | 205.03 | 1.7 | 110,797 | 21.0 | 35.3 | 0.78 |
| Lowe's Cos., Inc. | 117.62 | 1.8 | 89,871 | 31.1 | 54.4 | 1.04 |
| McCormick & Co., Inc. | 166.09 | 1.3 | 22,120 | 31.2 | 41.9 | 0.39 |
| McDonald's Corp. | 192.98 | 2.4 | 144,857 | 25.1 | 60.3 | 0.43 |
| Medtronic Plc | 111.28 | 1.9 | 148,098 | 32.0 | 59.7 | 0.67 |
| Nucor Corp. | 54.71 | 2.9 | 16,446 | 9.3 | 27.3 | 1.15 |
| People's United Financial, Inc. | 16.29 | 4.3 | 7,203 | 12.4 | 53.6 | 0.96 |
| Pentair Plc | 43.36 | 1.6 | 7,288 | 21.1 | 34.7 | 1.20 |
| PepsiCo, Inc. | 134.03 | 2.8 | 186,728 | 15.2 | 42.7 | 0.53 |
| PPG Industries, Inc. | 125.43 | 1.6 | 29,718 | 24.6 | 38.3 | 0.91 |
| Procter & Gamble Co. | 119.98 | 2.4 | 300,105 | 74.5 | 181.8 | 0.53 |
| Roper Technologies, Inc. | 352.90 | 0.5 | 36,838 | 31.7 | 16.6 | 1.04 |
| S&P Global, Inc. | 267.53 | 0.8 | 64,616 | 31.5 | 26.0 | 0.99 |
| The Sherwin-Williams Co. | 570.17 | 0.7 | 52,483 | 37.6 | 28.0 | 0.87 |
| Stanley Black & Decker, Inc. | 155.19 | 1.7 | 23,575 | 33.3 | 57.3 | 1.52 |
| Sysco Corp. | 79.32 | 2.0 | 40,420 | 24.0 | 47.2 | 0.51 |
| T. Rowe Price Group, Inc. | 120.67 | 2.5 | 28,048 | 15.1 | 37.3 | 1.22 |
| Target Corp. | 127.68 | 2.0 | 65,220 | 20.2 | 41.2 | 0.85 |
| United Technologies Corp. | 147.98 | 2.0 | 127,134 | 24.8 | 49.2 | 1.09 |
| VF Corp. | 85.22 | 2.3 | 33,866 | 26.2 | 60.3 | 1.14 |
| W.W. Grainger, Inc. | 316.50 | 1.8 | 16,840 | 18.4 | 32.5 | 1.07 |
| Walmart, Inc. | 119.96 | 1.8 | 340,915 | 23.8 | 41.9 | 0.61 |
| Walgreens Boots Alliance, Inc. | 61.11 | 2.9 | 54,105 | 14.2 | 41.2 | 1.03 |
| Certain securities may be excluded due to data limitations | ||||||
| Name | Price | Dividend Yield | Market Cap ($M) | Forward P/E Ratio | Payout Ratio | Beta |
Even among the Dividend Aristocrats, Sherwin-Williams stands out because of its remarkable rate of dividend growth. The company shows no sign of slowing down. Management’s stated goal for the dividend is 30% of prior year earnings. The company believes it can produce 11% to 14% annual growth in earnings-per-share, so we can reasonably expect the same level of growth for the dividend payout.
Sherwin-Williams’ sizable dividend growth forecast makes it an appealing stock to dividend growth investors. This article will analyze the investment prospects of Sherwin-Williams in detail.
Business Overview
Sherwin-Williams is the world’s second-largest manufacturer of paints and coatings. The company distributes its products through wholesalers as well as retail stores. Sherwin-Williams was founded in 1866, and has grown to a market capitalization of $53 billion on annual sales of $18 billion.
The company distributes its products through wholesalers as well as retail stores that bear the Sherwin-Williams name. Its only competitor of comparable size is fellow Dividend Aristocrat PPG Industries (PPG).
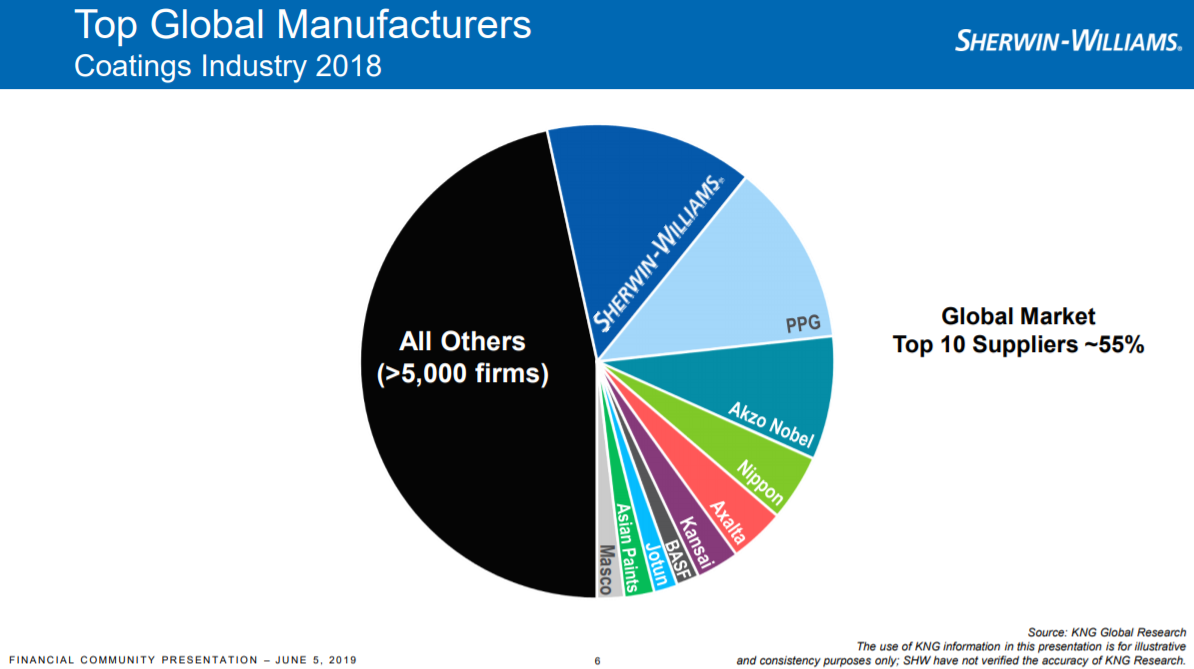
Source: Investor Presentation, page 6
Sherwin-Williams is certainly a market leader. The company has become significantly larger since its relatively recent acquisition of Valspar. The Valspar merger was transformative for Sherwin-Williams. Post-merger, Sherwin-Williams is now divided into three segments: Americas, Consumer Brands, and Performance Coatings. Sherwin-Williams is a much more diversified company than it was prior to the Valspar purchase. Management believes it can deliver strong earnings-per-share growth, with less volatility and variability in earnings.
Sherwin-Williams reported Q3 earnings on 10/22/2019 and results were strong again. Revenue was up 2.9% to $4.87 billion as higher paint sales volume in North America, as well as pricing increases, were partially offset by certain international markets and an unfavorable currency movement. Adjusted earnings came in at $6.65, up 17% from $5.68 as each segment produced higher profits against the year-ago period.
Guidance is for low-single-digit revenue gains in Q4, producing a full-year total of 2% to 4%, while earnings-per-share is now expected to be $21.10 for the year. That would represent a 14% increase from last year’s earnings.
Growth Prospects
Sherwin-Williams has grown at strong rates over the past couple of years. Fiscal 2018 saw sales of $17.5 billion, and this year is set to produce $18 billion. This is lower growth than recent years, but the Valspar acquisition helped drive significant top line expansion. Given the lateness of the economic cycle, we don’t believe double-digit or even high-single-digit top line growth is reasonable to expect. Still, Sherwin-Williams has done enough with margin expansion and share repurchases to boost earnings-per-share at rates well in excess of revenue growth in recent years, which should continue going forward.
Looking ahead, Sherwin-Williams stands to benefit from broad-based demand for its products, especially in the international markets. Demand for Sherwin-Williams’ products is expected to grow most rapidly in the Asia-Pacific region. In addition, the company has scale unlike any of its competitors in Latin America and North America. There is still plenty of growth potential in its more mature markets, but the Valspar acquisition helped to expedite expansion into Asia-Pacific, where the company is relatively small.
These factors should combine to accelerate the company’s revenue growth in the near-term. Sherwin-Williams expects sales growth of 4%-6% per year through the end of fiscal 2020.
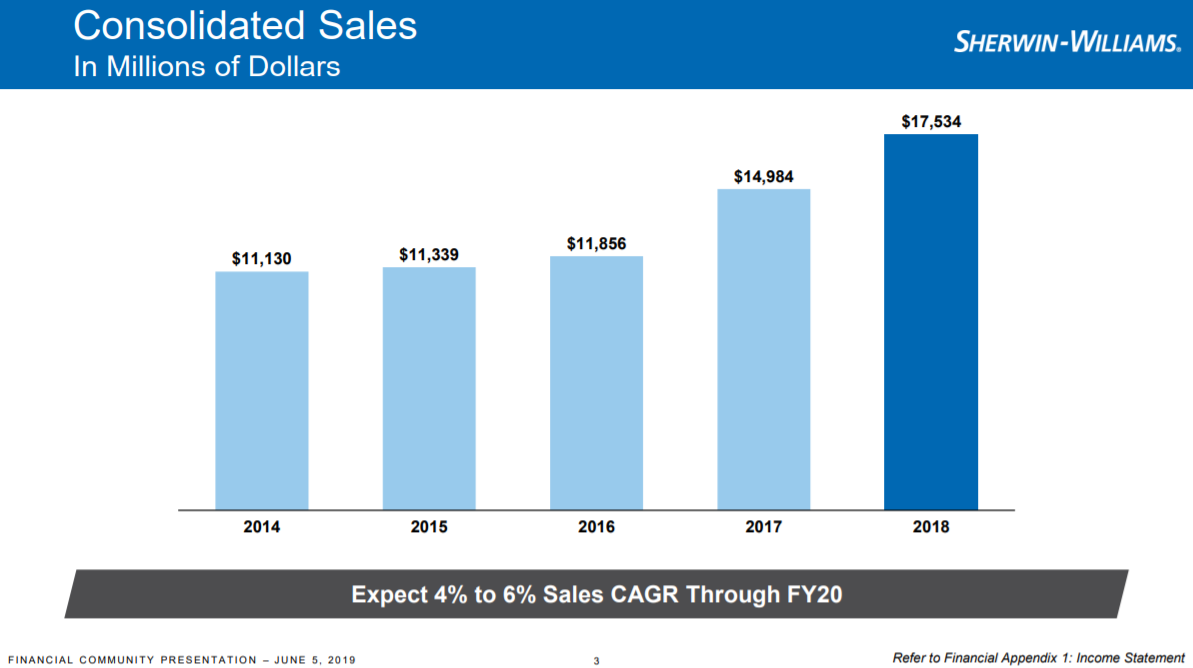
Source: Investor Presentation, page 3
Revenues are just one component of Sherwin-Williams’ future growth in profitability. The Valspar acquisition has presented some meaningful opportunities to reduce expenses by eliminating duplicate roles, integrating supply chains, and combining workforces.
Sherwin-Williams is expecting ~$400 million in annual cost synergies by 2020. Indeed, this chart shows how adjusted SG&A costs have declined significantly already as a percentage of revenue due to synergies with Valspar, which improves margins.
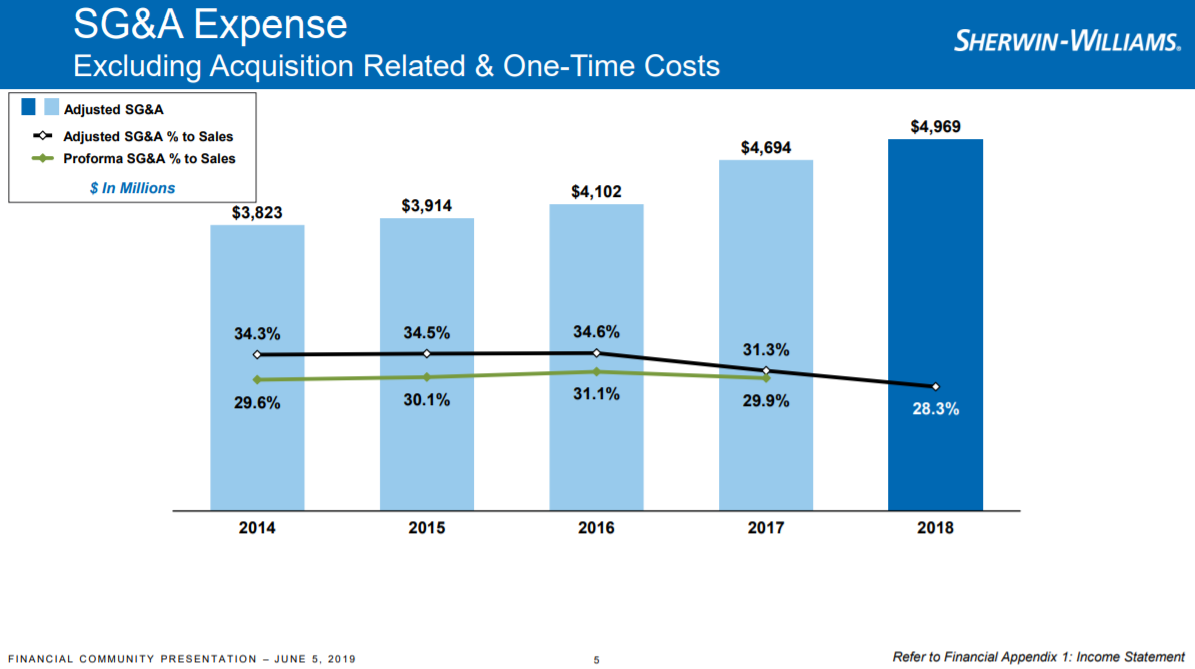
Source: Investor Presentation, page 5
Sherwin-Williams has plenty of opportunities to grow its sales and earnings for the foreseeable future. The company also has a very strong track record of earnings growth. Sherwin-Williams is accustomed to growing earnings at double-digit rates, and management has guided for that to continue in the coming years. This company has a broad and deep portfolio of popular brands with high margins and a positive sales growth outlook. In addition, merger synergies have begun to accrue, but aren’t yet complete.
In short, even though Sherwin-Williams is the dominant player in its sector, it still has a long runway for growth. In total, we see 7% annual earnings-per-share growth in the coming years, with about half of that accruing from a higher top line, and the balance from a combination of margin expansion and share repurchases.
Competitive Advantages & Recession Performance
Sherwin-Williams is not a recession-resistant Dividend Aristocrat. The company’s performance depends on a healthy U.S. and international housing market, which is the underlying driver of paint and coatings sales. Sherwin-Williams has a high level of leverage to construction markets as well as new buildings, which need a myriad of coating products. Unfortunately, this means that when these markets see downturns, the impact can be significant on Sherwin-Williams earnings.
This can be seen by looking at the company’s performance during the 2007-2009 financial crisis:
- 2007 adjusted earnings-per-share: $4.70
- 2008 adjusted earnings-per-share: $4.00 (15% decline)
- 2009 adjusted earnings-per-share: $3.78 (5.5% decline)
- 2010 adjusted earnings-per-share: $4.21 (11% increase)
It took Sherwin-Williams’ earnings three full years to recover from its Great Recession lows; however, the company remained profitable and continued to raise its dividend (which is why it remains a Dividend Aristocrat today). We expect the dividend increase streak will continue during the next recession, but investors should note that its earnings, and therefore the share price, will likely see meaningful declines in a downturn.
Another factor that investors should consider is the company’s increased debt load after the closure of the Valspar acquisition. Sherwin-Williams acquired debt to fund the Valspar acquisition, which resulted in a debt to EBITDA ratio of 4.5x when the deal closed. The company has worked to pay off debt since. It lowered its debt to EBITDA ratio to 2.8x at the end of Q3 2019, and the company maintains a long-term target of 2.0x to 2.5x. Further debt reduction is a positive for the health of the company, but it also means there could be less cash flow available for dividends and/or share repurchases.
Sherwin-Williams elevated debt load combined with the current position in the business cycle may lead some investors to consider investments in more conservative securities. Earnings are likely to fall if the economy begins to contract and the housing market slows. We don’t believe it would result in negative earnings by any means, but the earnings and share price would suffer under such a scenario.
Valuation & Expected Total Returns
Sherwin-Williams has many of the characteristics of a high-quality business, and it is valued as such. The stock trades with a price-to-earnings multiple of 27.3 on its 2019 earnings-per-share estimate of $21.10, which compares to our estimate of fair value of 20. That implies a ~6% headwind to total returns in the coming years as the stock is significantly overvalued after a huge rally in 2019.
However, this is not a stock that is likely to sink to a low price-to-earnings ratio, given its enormously successful history of growing earnings. Investors are willing to pay more for premium growth, and Sherwin-Williams fits that description.
In addition, we expect 7% long-term annual earnings growth for Sherwin-Williams. The stock also has a secure dividend, which yields 0.8% right now. This results in annual expected returns of just 1.6% over the next five years as the headwind from the valuation essentially offsets projected earnings growth.
The stock’s unfavorable valuation means that we recommend investors sell Sherwin-Williams. The dividend yield is still quite low, so it is not a compelling income stock. However, the high rate of dividend increases makes the stock attractive for long-term dividend growth investors. The company’s dividend is also very safe.
Final Thoughts
Sherwin Williams’ acquisition of Valspar created compelling growth opportunities for this high-quality dividend growth stock. The company should continue to grow its revenue, earnings, and dividends at a high rate over the next several years, barring a major recession.
However, the valuation is too high to warrant a buy recommendation at this time. This is a typical example of a great business trading at a not-so-great price. The following Warren Buffett quote is particularly appropriate in this situation:
“For the investor, a too-high purchase price for the stock of an excellent company can undo the effects of a subsequent decade of favorable business developments.” – Warren Buffett
We think there is a lot of growth ahead along with strong payout expansion, but the very high valuation means we cannot recommend Sherwin-Williams at this point.