


Published on August 7th, 2022 by Nikolaos Sismanis
There is no exact definition for blue chip stocks. We define it as a stock with at least ten consecutive years of dividend increases. We believe an established track record of annual dividend increases going back at least a decade shows a company’s ability to generate steady growth and raise its dividend, even in a recession. As a result, we feel that blue chip stocks are among the safest dividend stocks investors can buy.
With all this in mind, we created a list of 350+ blue-chip stocks which you can download by clicking below:
In addition to the Excel spreadsheet above, we will individually review the top 50 blue chip stocks today as ranked using expected total returns from the Sure Analysis Research Database.
This installment of the 2022 Blue Chip Stocks In Focus series will analyze Unum Group (UNM).
Business Overview
Headquartered in Chattanooga, TN, Unum Group is an insurance holding company providing a broad portfolio of financial protection benefits and services. The company operates through its Unum US, Unum UK, Unum Poland, and Colonial Life businesses, providing disability, life, accident, critical illness, dental, and vision benefits to millions of customers. The $7.1 billion company generated $12 billion in revenue last year.

Source: Investor Presentation
On May 26th, 2022, Unum increased its dividend by 10% to a quarterly rate of $0.33.
On August 2nd, 2022, Unum reported Q2 2022 results for the period ending June 30th, 2022. For the quarter, Unum generated revenue of $3.04 billion, up 1.8% compared to the prior-year period. A small increase in premium income was more than offset by a reduction in investment income and gains.
Reported net income equaled $370.4 million or $1.83 per share compared to $182.9 million or $0.89 per share in Q2 2021. On an adjusted basis, earnings-per-share equaled $1.91 versus $1.39 previously. Adjusted book value equaled $57.32 compared to $52.39 in the year-ago period.
Unum also raised its outlook, now anticipating an increase in after-tax operating income per share of 40% to 45%, up from 15% to 20% previously.
Growth Prospects
In the 2010 through 2019 stretch, Unum grew its earnings-per-share by an average compound growth rate of 7.8% per annum. More impressive is the idea that earnings-per-share grew every single year during this period. Results were helped by an average business growth rate, around ~3% annually, aided by a significant share repurchase program, retiring nearly -5% of the share count each year.
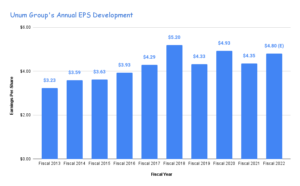
Source: SEC filings, Author
Moving forward, this program will continue to be an important factor considering the security’s persistently low valuation. Of course, 2020 and 2021 were down years.
Unum can get back to growth via reasonable improvement in premium and investments, expense management, and a meaningful share repurchase program over time. Rising interest rates are also likely to contribute to the insurer’s results moving forward.
While Unum has put together a solid growth record, we highlight that this has been dependent on share repurchases to a large extent. We are forecasting a 3% growth in earnings-per-share through 2027 after improved guidance.
Regarding its dividend-per-share, it has grown every year over the past 14 years, with no exception. The 10-year dividend-per-share CAGR stands at 9.76%, while the latest dividend increase of 10% further reassured investors that the pace of dividend growth should remain robust going forward. After all, the company is paying a rather small percentage of its underlying earnings.
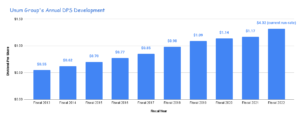
Source: SEC filings, Author
Competitive Advantages & Recession Performance
Unum has demonstrated a strong operating history in good times or bad for decades now. During the Great Recession, the company posted rather strong results
You can see a rundown of Unum Group’s earnings-per-share from 2007 to 2010 below:
- 2007 earnings-per-share of $2.19
- 2008 earnings-per-share of $2.51
- 2009 earnings-per-share of $2.57
- 2010 earnings-per-share of $2.71
In fact, it’s quite impressive that the company’s earnings didn’t decline, as most insurers suffered dramatically at the time. Furthermore, the dividend kept increasing during this time as well. We also believe that the dividend should remain well-covered, with the latest rather aggressive dividend hike proving that. The payout ratio stands at a quite comfortable 27.5%.
With that being said, it’s hard to gain a competitive advantage within the industry as insurance products are commodity-like in nature. Still, we are encouraged by the solid results of the company in all operating environments, the conservative dividend payout ratio, and the focus on share repurchases, excluding 2020 and 2021. Moreover, we prefer the slow and steady long-term growth of the business instead of chasing short-term results.
Valuation & Expected Returns
During the past decade, shares of Unum have traded hands with an average valuation of about 8 times earnings, with a range from 5 to 12. We are using 8 times earnings as our starting fair value estimate. With shares trading at 7.4 times our earnings estimate for 2022, this implies the potential for a valuation tailwind.
If the price-to-earnings multiple expands from 7.4 to 8, future returns would be boosted by 1.6% per year over the next five years. Combined with our EPS & DPS growth rates, as well as the current dividend yield, we project annualized returns could amount to 7.5% through 2027.
Accordingly, we rate Unum Group a hold.
Final Thoughts
Unum has put together a solid operating history, led by a steady underlying business
supported by a meaningful share repurchase program. The ongoing rise in rates is likely to boost the company’s results moving forward as well.
We are forecasting a 7.5% annual total return potential over the next five years, driven by a 3.5% starting dividend yield, 3% growth rate, and the potential for a valuation tailwind.
The Blue Chips list is not the only way to quickly screen for stocks that regularly pay rising dividends.
- The Dividend Aristocrats: S&P 500 stocks with 25+ years of consecutive dividend increases.
- The High Yield Dividend Aristocrats List is comprised of the Dividend Aristocrats with the highest current yields.
- The Dividend Kings List is even more exclusive than the Dividend Aristocrats. It is comprised of 44 stocks with 50+ years of consecutive dividend increases.
- The High Yield Dividend Kings List is comprised of the 20 Dividend Kings with the highest current yields.
- The High Dividend Stocks List: stocks that appeal to investors interested in the highest yields of 5% or more.
- The Monthly Dividend Stocks List: stocks that pay dividends every month, for 12 dividend payments per year.
- The 20 Highest Yielding Monthly Dividend Stocks: Monthly dividend stocks with the highest current yields.
- The Dividend Champions List: stocks that have increased their dividends for 25+ consecutive years.
Note: Not all Dividend Champions are Dividend Aristocrats because Dividend Aristocrats have additional requirements like being in The S&P 500. - The Dividend Contenders List: 10-24 consecutive years of dividend increases.
- The Dividend Challengers List: 5-9 consecutive years of dividend increases.
- The Complete List of Russell 2000 Stocks: arguably the world’s best-known benchmark for small-cap U.S. stocks.
- The Best DRIP Stocks: The top 15 Dividend Aristocrats with no-fee dividend reinvestment plans.
- The 2022 High ROIC Stocks List: The top 10 stocks with high returns on invested capital.
- The 2022 High Beta Stocks List: The 100 stocks in the S&P 500 Index with the highest beta.
- The 2022 Low Beta Stocks List: The 100 stocks in the S&P 500 Index with the lowest beta.