


Published on August 8th, 2022, by Felix Martinez
There is no exact definition for blue chip stocks. We define it as a stock with at least ten consecutive years of dividend increases. We believe an established track record of annual dividend increases going back at least a decade shows a company’s ability to generate steady growth and raise its dividend, even in a recession.
As a result, we feel that blue chip stocks are among the safest dividend stocks investors can buy.
With all this in mind, we created a list of 350+ blue-chip stocks, which you can download by clicking below:
In addition to the Excel spreadsheet above, we will individually review the top 50 blue chip stocks today as ranked using expected total returns from the Sure Analysis Research Database.
This article will analyze MDU Resources Group (MDU) as part of the 2022 Blue Chip Stocks In Focus series.
Business Overview
MDU Resources is a regulated energy delivery, transportation, and construction materials and services business. The company was founded in 1924, and since then, it has grown from a small electric utility in North Dakota to a market capitalization of $5.9 billion.
The company operates in five business segments, which include: Electric segment, which generates, transmits, and distributes electricity in Montana, North Dakota, South Dakota, and Wyoming; The natural gas distribution segment distributes natural gas in those states, as well as in Idaho, Minnesota, Oregon and Washington; The pipeline segment provides natural gas transportation and underground storage services through a regulated pipeline system primarily in the Rocky Mountain and northern Great Plains regions of the United States; The construction materials and contracting segment mines, processes and sells construction aggregates (crushed stone, sand, and gravel); produces and sells asphalt mix, and supplies ready-mixed concrete; and The construction services segment.
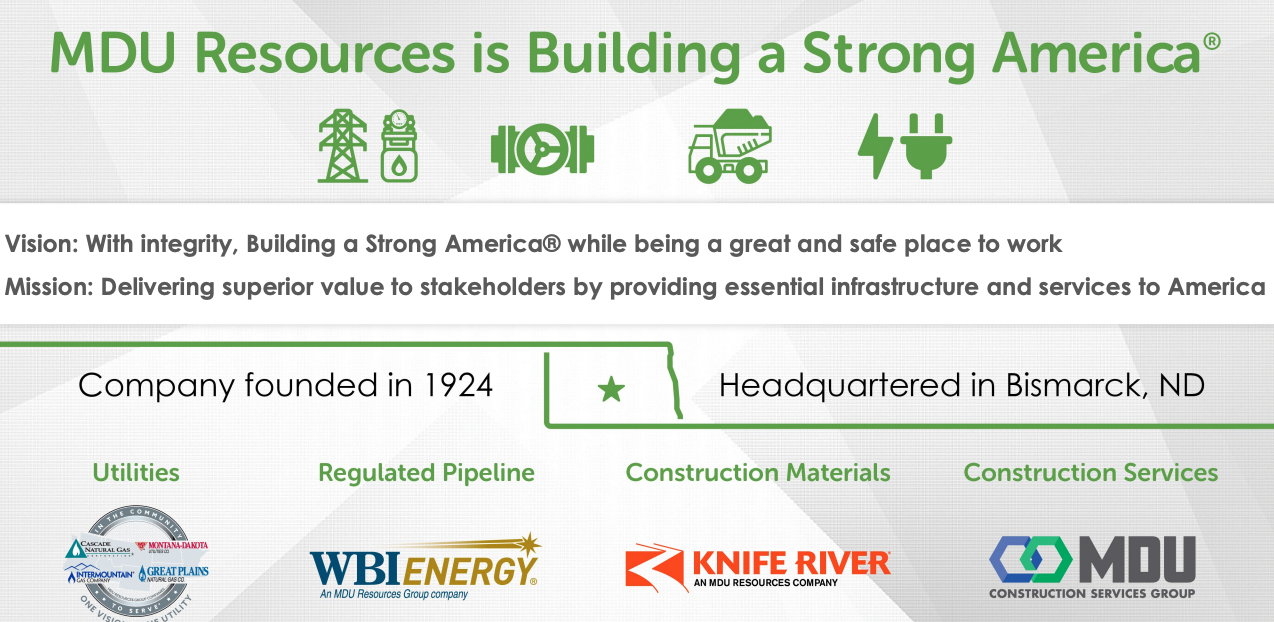
Source: Investor Presentation
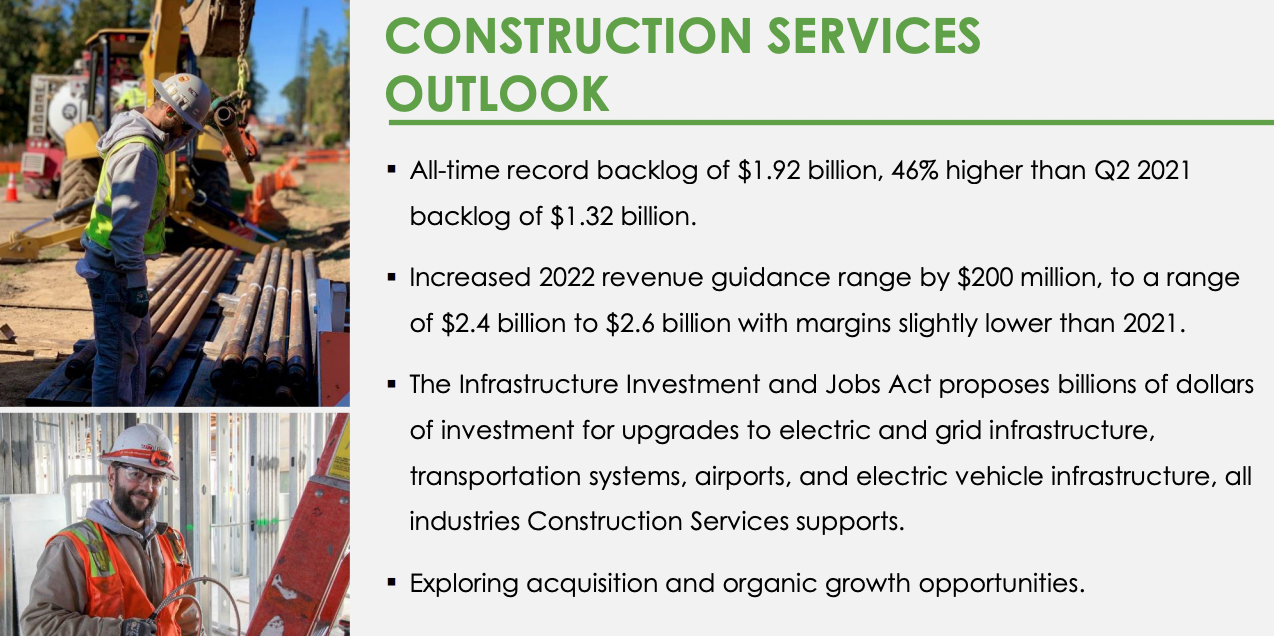
On August 4th, 2022, the company reported second and six months results for Fiscal Year (FY)2022. The construction services business had all-time record quarterly revenues, up 30% from the second quarter of 2021, and record second-quarter earnings of $34.5 million, compared to $28.9 million in the second quarter of 2021.
The electrical and mechanical services segment was robust during the quarter, notably for data centers, hospitality, and commercial facilities. The market remains healthy for construction services work, with an all-time record backlog of $1.92 billion for the quarter, up 46% compared to $1.32 billion for 2Q2021. As a result of the solid start for the year, the company has increased the 2022 revenue guidance range by $200 million for the construction services business.
The construction materials business also had a record second-quarter revenue, up 12% from the second quarter of 2021, and earned $32.6 million, compared to $51.4 million in the second quarter of 2021. While pricing increases drove revenue growth, higher fuel, material, and labor costs outpaced these increases. The market need remains strong for construction materials and contracting work, with an all-time record backlog of $1.13 billion at the end of the quarter, up 24% compared to $912 million for 2Q2022.
For the quarter, net income is down 29.4% from $100.2 million in 2Q2021 to $70.7 million during the second quarter of 2022. This was driven by lower revenue in the Electric, pipeline, and construction materials and contracting segments. Thus, earnings per share for the quarter compared to the second quarter of 2021 were down 30%.
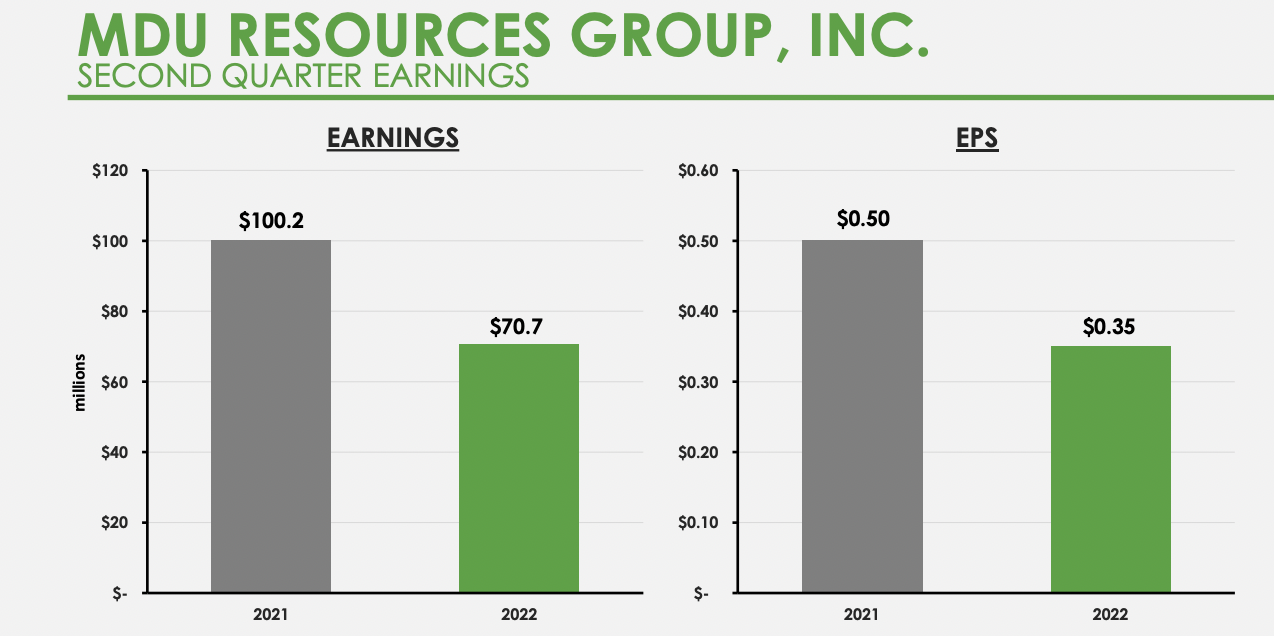
Source: Investor Presentation
Growth Prospects
Since the company is in the energy delivery, transportation, and construction materials and services business, it is cyclical. Thus, earnings has growth years and down years.
For example, over the past ten years, the company’s earnings have had a Compound Annual Growth Rate (CAGR) of 5.3%. However, over the past five years, earnings CAGR has been 9.5% due to the construction business increase. However, in 2012, earnings fell 3%. Also, in 2014 and 2015, earnings fell in consecutive years of 30% and 14%, respectively.
Our earnings growth forecast is 3% annually because the construction business may suffer during a prolonged downturn, but that appears to be no threat at this point. Indeed, the construction business continues to set records but has begun to show some cracks in recent results, given constraints outside the company’s control.
Source: Investor Presentation
Competitive Advantages & Recession Performance
MDU’s competitive advantage can also be its downfall in that it operates a utility and pipeline business that is both stable, but it is also in construction, which is one of the most cyclical industries. This gives MDU a significant leg up on other utilities in the good times but can be its downfall in times of economic hardship.
The company did ok during the Great Recession. For example, earnings fell hard in 2008 by 36%, but in the following years, earnings stabilized and were up 24% in 2009. It was in decline in the following years, but nothing extreme.
You can see a rundown of Caterpillar’s earnings-per-share from 2007 to 2011 below:
- 2007 earnings-per-share of $1.76
- 2008 earnings-per-share of $1.13 (36% decrease)
- 2009 earnings-per-share of $1.40 (24% increase)
- 2010 earnings-per-share of $1.29 (8% decrease)
- 2011 earnings-per-share of $1.19 (8% decrease)
The company has an acceptable balance sheet. The company sports a debt-to-equity ratio of 0.9 and a long-term debt-to-capital ratio of 42.8. Also, the interest coverage ratio is 5.0, which is a respectable ratio, meaning that the company covers the interest on its debt well. Overall, the company sports an S&P credit rating of BBB+, an investment grade rating.
Valuation & Expected Returns
MDU’s price-to-earnings (PE) multiple has moved around a lot, which we expect for a cyclical company. The multiple is well off the highs of 2014/2015 and is trading under our fair value estimate of 15 times earnings at just 13.5 times this year’s earnings estimate.
We think that a 15 PE is fair for this company. Currently, the company has a PE of 15.5x 2022 earnings of $1.90 per share. Thus, the company is slightly overvalued to our fair PE ratio.
The company has an impressive dividend history. It has paid a remarkable 81 consecutive years of dividends. It has been growing its dividend for 30 consecutive years. Over the past ten years, the dividend has grown at a CAGR of 2.7%. Over the past five years, the dividend growth rate has been 2.5%.
With the dividend yield of 2.9% and expected earnings growth rate of 3% and a slight overvaluation, we expect the company to return 5.8% over the next five years.
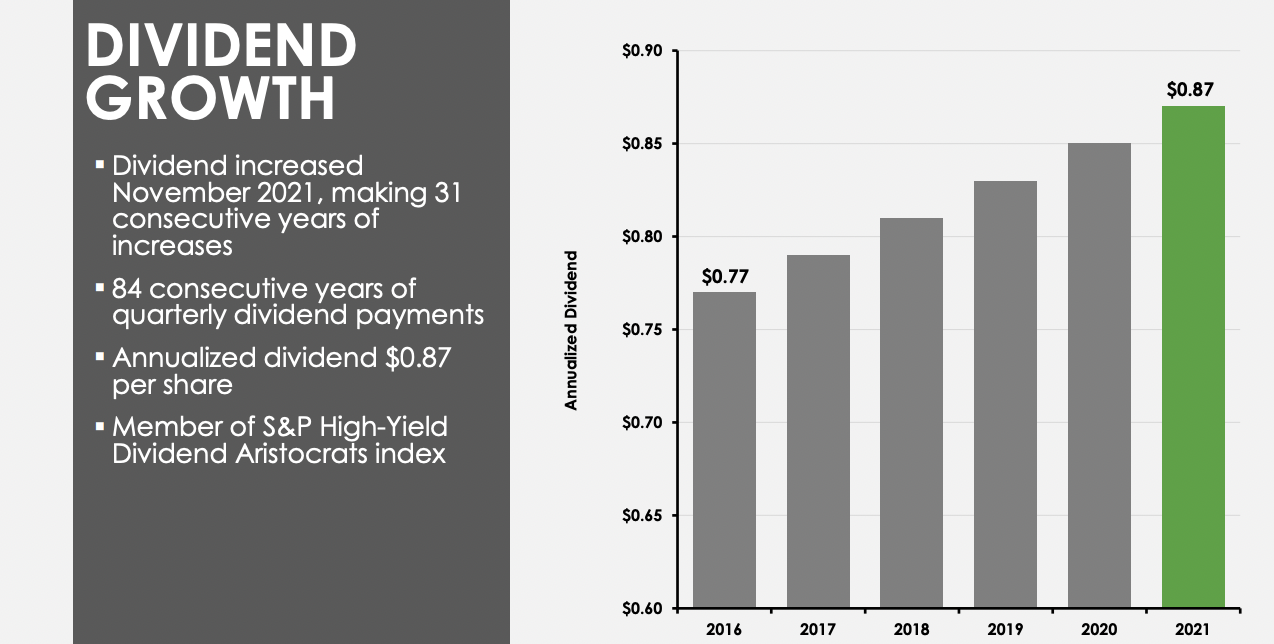
Source: Investor Presentation
Final Thoughts
We forecast 5.8% annual total returns going forward for MDU consisting of the 2.9% current yield, a headwind from the valuation, and 3% earnings-per-share growth. Thus we rate the stock as a hold, as total returns have moved lower on weaker expected earnings and a slightly lower fair value estimate.
The Blue Chips list is not the only way to quickly screen for stocks that regularly pay rising dividends.
- The Dividend Aristocrats: S&P 500 stocks with 25+ years of consecutive dividend increases.
- The High Yield Dividend Aristocrats List is comprised of the Dividend Aristocrats with the highest current yields.
- The Dividend Kings List is even more exclusive than the Dividend Aristocrats. It is comprised of 44 stocks with 50+ years of consecutive dividend increases.
- The High Yield Dividend Kings List is comprised of the 20 Dividend Kings with the highest current yields.
- The High Dividend Stocks List: stocks that appeal to investors interested in the highest yields of 5% or more.
- The Monthly Dividend Stocks List: stocks that pay dividends every month, for 12 dividend payments per year.
- The 20 Highest Yielding Monthly Dividend Stocks: Monthly dividend stocks with the highest current yields.
- The Dividend Champions List: stocks that have increased their dividends for 25+ consecutive years.
Note: Not all Dividend Champions are Dividend Aristocrats because Dividend Aristocrats have additional requirements like being in The S&P 500. - The Dividend Contenders List: 10-24 consecutive years of dividend increases.
- The Dividend Challengers List: 5-9 consecutive years of dividend increases.
- The Complete List of Russell 2000 Stocks: arguably the world’s best-known benchmark for small-cap U.S. stocks.
- The Best DRIP Stocks: The top 15 Dividend Aristocrats with no-fee dividend reinvestment plans.
- The 2022 High ROIC Stocks List: The top 10 stocks with high returns on invested capital.
- The 2022 High Beta Stocks List: The 100 stocks in the S&P 500 Index with the highest beta.
- The 2022 Low Beta Stocks List: The 100 stocks in the S&P 500 Index with the lowest beta.